
Human donors
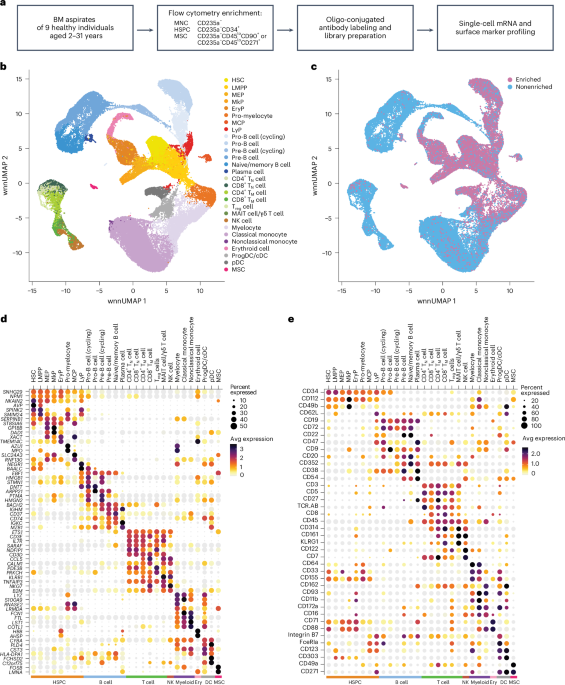
BM samples were obtained from three independent cohorts, each used for distinct analyses. All samples were obtained through the Biobank of the Princess Máxima Center for Pediatric Oncology, Utrecht, the Netherlands. Cohort demographics, including donor numbers, age ranges and sex distributions, are provided in Supplementary Tables 1, 7 and 14. For CITE-seq, BM aspirates from healthy individuals (n = 9, 2.1–31.3 years, three male and six female donors; Supplementary Table 1) were acquired. BM aspirates had been collected bilaterally from the posterior superior iliac crests as part of a stem cell donation to an affected relative. None of the healthy donors received any HSC-mobilizing treatment before donation. Written informed consent was obtained from all donors or legal guardians. Approval was granted by the Institutional Review Board of the Princess Máxima Center (PMCLAB2022.0328).
For Xenium-based spatial transcriptomics, formalin-fixed paraffin-embedded (FFPE) BM trephine biopsies were analyzed from an independent cohort of YP (n = 3, 0.7–1.5 years, two male and one female donor) and AYA donors (n = 3, 13.5–23 years, all male donors). As BM biopsies are invasive and not routinely performed in healthy individuals, samples were obtained from individuals undergoing diagnostic evaluation for suspected BM metastasis of solid tumors. All selected individuals were ultimately diagnosed with localized disease and showed no evidence of BM involvement (Supplementary Table 7). Written informed consent was obtained from all donors or legal guardians. Approval was granted by the Institutional Review Board of the Princess Máxima Center (PMCLAB2022.0351).
For BM cytokine measurements, BM plasma from cancer-free BM aspirates (n = 78, ages 0–20 years, 47 male and 31 female donors; Supplementary Table 14) was acquired. All aspirates were derived from individuals diagnosed with localized solid tumors, including low-grade embryonal rhabdomyosarcoma, Ewing sarcoma, ganglioneuroblastoma, malignant rhabdoid tumor, neuroblastoma or small cell sarcoma, without any evidence for BM involvement. Informed consent was obtained from all donors or legal guardians. Approval was granted by the Institutional Review Board of the Princess Máxima Center (PMCLAB2025.0620).
Sample preparation for CITE-seq
Residual mononuclear cells from BM aspirates, leftover after graft infusion, were isolated by Ficoll (Cytiva Life Sciences) density gradient centrifugation and cryopreserved in liquid nitrogen until further use. For CITE-seq, cryopreserved BM samples were thawed rapidly in a water bath at 37 °C. An equal volume of prewarmed thawing medium (DMEM, high glucose, pyruvate, no glutamine and 20% fetal calf serum) was added to the viably frozen cell suspension in a dropwise fashion. The cell suspension was transferred to a 50-ml Falcon tube and was further diluted (1:10) by dropwise addition of prewarmed thawing medium. Cells were centrifuged at 400g for 5 min at 4 °C. The cell pellet was resuspended in thawing medium containing DNase (100 µg ml−1; Roche) with MgCl2 (10 mM; Merck) and incubated for 30 min at 4 °C. After incubation, cells were centrifuged at 400g for 5 min at 4 °C and resuspended in cell staining buffer (CSB; Biolegend). The number of cells in the suspension was established using the Countess II cell counter (Invitrogen).
Cell sorting and multiplexing for CITE-seq
Before library preparation, each individual’s sample was enriched for HSPC and MSC, which were multiplexed with the nonenriched cell fraction of another genetically distinct individual. For this, FcR blocking reagent (Human Trustain FcX, Biolegend) was added to the cells at a 1:10 dilution and incubated on ice for 5 min. Cells were then incubated with Zombie NIR viability dye (BioLegend) on ice in the dark for 15 min. After incubation, the cell suspension was washed by adding CSB and centrifuging at 400g at 4 °C, followed by resuspension. Next, the cells were incubated on ice in the dark for 30 min with a customized mix of fluorophore-conjugated antibodies and oligonucleotide-conjugated antibodies (Supplementary Tables 15 and 16). Following incubation, the cells were washed three times with CSB and centrifuged at 400g at 4 °C after each wash. The cell suspension was then filtered using a 35-µm filter and sorted using a Sony SH800S cell sorter (SONY SH800S system software v2.1), with a uniform gating strategy for all samples (Supplementary Fig. 1). In general, we sorted 2.5 × 10⁴ nonenriched, erythrocyte precursor-depleted cells (Zombie NIR−CD235a−) from one individual and combined with 1 × 10⁴ HSPC (Zombie NIR−CD235a−CD45−CD34+) and up to 2 × 10³ MSC (Zombie NIR−CD235a−CD45loCD34−CD271+ or Zombie NIR−CD235a−CD45loCD34−CD90+) of another genetically distinct individual. During subsequent data analysis (described below), cells were demultiplexed and assigned to their original sample based on SNVs specific for each individual. After mixing, the resulting cell suspensions were counted using Trypan Blue and a Bürker counting chamber.
Library preparation and sequencing
Approximately 40,000 cells per multiplexed sample were loaded onto a Chromium Single Cell G chip and used for library preparation using a Chromium Next GEM Single Cell 3′ Library and Gel Bead Kit v3.1 (10x Genomics) according to the manufacturer’s instructions. For each multiplexed sample, two libraries were prepared, one for the RNA and one for the antibody capture modality. Each library was sequenced using a NovaSeq 6000 (Illumina) and the following number of cycles: read 1: 28; read i7: 10; read i5: 10; read 2: 91.
Xenium experiments
In collaboration with the Department of Pathology, representative regions from each BM biopsy (n = 6 biopsies, one to three regions per biopsy; Supplementary Table 7) were identified and incorporated into a tissue microarray (TMA), comprising one to three BM cores per individual (1.5 mm in diameter each). A 5-µm TMA section was prepared for spatial transcriptomics according to the Demonstrated Protocols Xenium In Situ for FFPE Tissue Preparation Guide (CG000578, 10x Genomics) and Xenium In Situ for FFPE Tissues Deparaffinization and Decrosslinking (CG000580, 10x Genomics). The Human Multi-Tissues and Cancer Panel probe set was supplemented with probes targeting 100 custom genes (Supplementary Table 8) and Cell Segmentation Reagents. Probe hybridization, ligation and rolling circle amplification were performed by the Leiden Genome Technology Center at the Leiden University Medical Center, following the manufacturer’s protocol (CG000582 Rev E, 10x Genomics).
CITE-seq data preprocessing
CITE seq data were processed using CellRanger count with feature barcoding (version 7.1.0, 10x Genomics) using the refdata-gex-GRCh38-2020-A transcriptome and a modified Feature Reference file (Supplementary Table 14).
CITE-seq genotype demultiplexing and barcode filtering
Cells from multiplexed samples were SNV-based genotype-demultiplexed using souporcell (singularity image created 1 December 2021)51. Barcodes with less than 1,500 transcripts and/or a percentage of mitochondrial genes above 10% were removed. Also, barcodes classified as doublets or unassigned genotypes by souporcell51 and barcodes classified as doublets in over five of ten runs using scDblFinder (version 1.18.0)52 were discarded.
CITE-seq normalization, dimensional reduction, feature deconfounding and integration
Further processing and analyses were performed in R (version 4.4.0) using Seurat (version 5.1.0)20. For each individual, donor gene expression data were SCTransform normalized with SCTransform (v2, number of variable features = 3,000). Dimensional reduction was conducted with the RunPCA function from Seurat. SCT integration features were calculated using the SelectSCTIntegrationFeatures function from Seurat. Using gene lists from the SCutils package (version 1.123), the following genes were filtered out from the SCT integration features, provided they were also found as variable features: genes specific to the S or G2M cell cycle phase, donor-specific genes correlating with the S or G2M phase, male and female-specific genes, stress-related genes and ribosomal protein genes. Gene expression data were integrated across donors with canonical correlation analysis (CCA), using the IntegrateLayers function in Seurat and the filtered SCT integration features. Antibody capture data were normalized per library using DSBantibody normalization (version 1.0.3)20. For each individual donor, FindVariableFeatures and ScaleData were run, and dimensional reduction was performed with the RunPCA function from Seurat. Data were also integrated with CCA using the IntegrateLayers function in Seurat and all antibodies as integration features.
CITE-seq visualization, clustering and cell-type annotation
A WNN graph was created with the FindMultiModalNeighbors function in Seurat, using the integrated reductions of both RNA and ADT modalities. A wnnUMAP was created from this WNN graph with RunUMAP, using 30 principal components for both modalities. Clustering was performed using FindClusters from Seurat with the wsnn graph, the SLM modularity optimization algorithm, as recommended by the Weighted Nearest Neighbor Analysis vignette from Seurat, and a resolution of 0.4.
Cell-type annotation was performed by combining three complimentary annotation approaches, performed with gene expression log-normalized data. First, cell types were inferred with SingleR (version 2.6.0)53. Second, individual cells were mapped to two external reference BM datasets11,13. Mapping to the CITE-seq dataset bmcite (version 0.3.0) from SeuratData (version 0.2.2.9001) was performed as recommended by the Seurat multimodal reference mapping vignette18. The Gene Expression BM dataset in DISCO19 was downsampled to a maximum of 3,000 cells per cell type and SCTransform normalized, followed by generation of a principal component analysis and UMAP, which were in turn used for reference mapping, according to the Seurat Mapping and annotating query datasets vignette. Third, antibody capture data and RNA expression data from known marker genes were used to confirm cell-type annotations.
For in-depth analysis of the erythroid lineage, myeloid lineage and T and NK cells, the respective clusters were subsetted, followed by subset-specific SCT normalization, dimensional reduction, feature deconfounding, integration and clustering at resolutions of 0.7, 0.5 and 0.3, respectively. Cell-type annotations were then redefined as described above. The resulting Seurat object provided cell-type annotations at multiple levels of resolution, ranging from broad categories (major groups, for example, T cells) to more detailed classifications (high-resolution clusters, for example, γδT cells).
CITE-seq subclustering of LyP cells
For in-depth analysis of LyP cells, cells were subsetted and analyzed as described above, with the following deviations: for clustering, a resolution of 0.1 was used; CCA integration between donors was not performed.
CITE-seq differential gene and protein expression
To compare each major group and high-resolution cell type against all other cell types, we used the wilcoxauc function in presto (version 1.0.0) to find cell-type-specific, significantly differentially expressed genes and proteins. We used the following thresholds: p-adj < 0.01, pct_in – pct_out ≥ 0, pct_in > 20, auc > 0.5 and logFC > 0. For each cell type, the FindMarkers function (test.use = ‘wilcox’, logfc.threshold = 0, min.pct = 0.01) was used to identify genes and proteins with significant differential expression between YP and AYA cells (thresholds: p-adj < 0.01 and FC > 1.5 and pct.1 > pct.2 or p-adj < 0.01 and FC < –1.5 and pct.1 < pct.2). From these cell-type-specific young and old gene lists, we computed module scores using Seurat’s AddModuleScore function and assessed scores per cell. Module scores were visualized as mean module scores per cluster using the ggradar package (version 0.2), capping negative average scores at 0. For LyP cell subclusters, the FindMarkers function (test.use = ‘wilcox’, logfc.threshold = 0, min.pct = 0.01) was used to identify significantly differentially expressed genes and proteins between clusters 0 and 1 (thresholds: p-adj < 0.01 and FC > 2 and pct.1 > pct.2 or p-adj < 0.01 and FC < –2 and pct.1 < pct.2). For all differential gene expression analyses, male- and female-specific genes were removed. For comparisons of major groups and high-resolution clusters, confounder genes mentioned above were also removed. Gene Ontology enrichment analysis was performed using the enrichGO function from the clusterProfiler (version 4.12.0) package, using biological process terms.
Transcription factor activity analysis in CITE-seq data
Inference of transcription factor network activity was performed using pySCENIC (image version aertslab-pyscenic-0.11.2.sif)54. For this, we used a loom file with raw transcript counts of a downsampled dataset as input, along with the ‘hs_hgnc_tfs.txt’ transcription factor list, the ‘motifs-v9-nr.hgnc-m0.001-o0.0.tbl’ motifs and the ‘hg38__refseq-r80__10kb_up_and_down_tss.mc9nr.feather’ input databases. Only transcription factors that were identified in two or more of three independent runs were analyzed. Activity per cell was calculated as the mean AUCell values across runs. For LyP cell subclusters, FindMarkers (test.use = ‘wilcox’, logfc.threshold = 0, min.pct = 0.01) was used to identify significant differential regulon activity between clusters 0 and 1 (thresholds: p-adj < 0.01 and FC > 1).
Cell interaction analysis in CITE-seq data
Interaction analysis and ligand prioritization were performed using NicheNet (nichenetr package, version 2.2.0)39. Ligand activity analysis was performed on genes upregulated in LyP-B or LyP-S cells (identified using the FindMarkers function as described above), using the top n = 5,000 downstream targets for each ligand and a quantile cutoff of 0.001. Ligands were prioritized by equally weighing the following two criteria: (1) the predicted ligand activity and (2) LyP subset-specific receptor expression.
Xenium data preprocessing, filtering, normalization and dimensional reduction
Imaging and signal decoding were performed using the Xenium on-board analysis pipeline (10x Genomics, version xenium-3.1.1.0). The Xenium ranger relabel function was applied after removing the FLT3LG feature, due to lack of specificity of this custom probe. Cell segmentation was performed using a probabilistic segmentation method (ProSeg) to infer refined cell boundaries55. Regions of interest corresponding to the individual cores were selected in Xenium Explorer (version 3). For the selected cells, metadata and gene expression profile matrices were imported into scanpy (version 1.11.3)56 for downstream analyses. Quality assessment matrices were performed on the cells, including normalizing gene counts to total cell volume. Cells with a sum log1 (P value)-scaled gene count greater than 3.5 were retained for downstream analyses. An autoencoder variational model, ResolVI (scvi-tools, version 1.3.3), was applied, treating all BM cores as one batch (model parameters: n_hidden = 32, n_latent = 10, n_layers = 2, dropout_rate = 0.05)57 to obtain a low-dimensional representation with ten dimensions. The latent representation was used for constructing a UMAP.
Xenium visualization, clustering and cell-type annotation
Leiden clustering (resolution 2.4, ten iterations) was performed based on the ResolVI latent space (resolution 2.4, ten iterations). For cell-type annotation, we used reference mapping with Tangram58 against the adult BM atlas as published by Bandyopadhyay et al.14 and Zeng et al.59 and CITE-seq data from this manuscript. Cells were then subdivided into major groups: HSPC, T/NK cells, megakaryocyte lineage, B cell lineage, myeloid lineage, erythroid lineage and nonhematopoietic clusters. These subsets were reclustered at resolutions of 0.3, 0.5 and 1.0. Final annotations were assigned by integrating reference-based predictions with known marker gene expression, yielding both broad and fine-grained cell-type labels.
Comparison of LyP cell subtypes in CITE-seq data and a public dataset of CD34+ cells
A public scRNA-seq dataset of CD34+ cells isolated from BM aspirates of 15 donors (ages 2–77 years; 8 male and 7 female donors)32 was downloaded from the Gene Expression Omnibus (GEO) under accession number GSE189161. Transcripts in all cells were log normalized per sample (orig.ident) to a total of 10,000 transcripts. LyP exhibiting LyP score >0 with more than 1,500 transcripts were retained for downstream analyses. Module scores were constructed from differentially expressed genes in the LyP, LyP-B and LyP-S populations from the CITE-seq data in this manuscript, excluding sex- and cell cycle-related genes. Relative cell fractions of cells with an LyP-B score of >0 and LyP-S score ≤0 (LyP-B); cells with a LyP-S score >0 and LyP-B score ≤0 (LyP-S) and cells with LyP-B score ≤0 and LyP-S score ≤0 (double-negative LyP) were compared.
Cytokine measurements in BM plasma
BM plasma (the cell-free fraction of BM aspirates) was collected by Ficoll (Cytiva Life Sciences) density gradient centrifugation of EDTA-anticoagulated BM aspirates (n = 78 samples; Supplementary Table 14). The resulting plasma was stored at –80 °C until further analysis. IL-7 and IL-15 were measured using the LEGENDplex Human Hematopoietic Stem Cell Panel (Biolegend). Samples were processed, and cytokine levels were measured according to the manufacturer’s instructions, with the sole deviation being an extended overnight incubation during the initial incubation step to optimize cytokine detection. Cytokine concentrations were analyzed in R and visualized using the ggplot2 (version 3.5.1) and ggbeeswarm (version 0.7.2) packages. Cytokine concentrations lower than the detection limit (IL-15, <271.56 pg ml−1; IL-7, <0.317 pg ml−1) were assigned half the value of the detection limit. Outliers were identified and removed.
Statistics and reproducibility
Dimensional reduction of BM composition data was performed using principal component analysis and the prcomp function from the stats package (version 4.4.0). The relative abundance of cell types, LyP-B and LyP-S cell subsets and cycling versus noncycling LyP between YP BM and AYA BM was compared using a two-sided Wilcoxon rank-sum test. Correlations between B cell and LyP-B cell frequencies were calculated using the stat_correlation function (method = ‘pearson’) from the ggpmisc package (version 0.6.0). To allow reliable comparisons of rare cell types (cycling versus noncycling LyP and MSC subsets), the enriched and nonenriched were pooled. For all other comparisons, the nonenriched fractions were used. For comparison of spatial cell-type composition, mixed-effects logistic regression models were used (lme4 package, version 1.1-35.5) with donor as a random effect to account for multiple cores per individual; P values were adjusted for multiple testing using the Benjamini–Hochberg false discovery rate method. YP and AYA sample cytokine concentrations were compared using a Wilcoxon rank-sum test. No statistical methods were used to predetermine sample sizes, but our sample sizes are similar to those reported in previous publications60.
Reporting summary
Further information on research design is available in the Nature Portfolio Reporting Summary linked to this article.