
Social status influences T-cell responses to vaccination
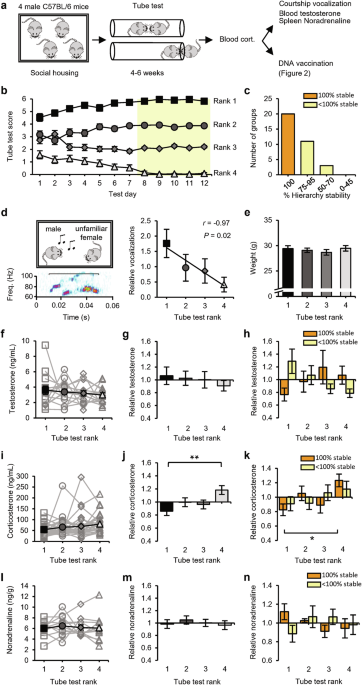
We used the tube test to determine the social hierarchy among groups of four 2-month-old male mice that were housed together since weaning24 (Fig. 1a). Pairs of mice were allowed to enter a tube from opposite ends to meet in the middle, and the mouse that forced the opponent to retreat was scored as the more dominant of the pair. On each testing day, the mice were confronted with each of their fellow group members twice (in both directions of the tube) and were therefore able to score a maximum of 6 wins. Groups were tested for at least 4 weeks, during which a transitive social hierarchy became evident (Fig. 1b). The social status of each mouse was determined on the basis of the final 5 testing days, when the tube-test results remained stable in the majority of groups (Fig. 1c). Typically, encounters in the tube between two high-ranked mice took longer on average before a winner was decided than encounters that included a subordinate mouse (Supplementary information, Fig. S1a). As a complementary test for social status, mice were exposed to a female mouse to record ultrasonic courtship vocalizations.24 A linear correlation between tube-test rank and relative amount of vocalization confirmed that tube-test ranks were a reflection of social status (Fig. 1d). As reported for groups of age-matched mice,28 social ranks were not determined by physical size, since different ranks had, on average, comparable body mass (Fig. 1e). Although testosterone levels can be a predictor of social status,13,29 blood testosterone levels were similar among social ranks, both in absolute levels (Fig. 1f) and in levels relative to the group average (Fig. 1g). Studies in nonhuman primates indicate that high testosterone primarily correlates with high social status when the social hierarchy is unstable, suggesting that testosterone production increases when high social status is under threat.30 Consistent with these studies, we observed a positive correlation between social status and testosterone in unstable hierarchies but not in fully stable hierarchies (Fig. 1h and Supplementary information, Fig. S2a).

a Schematic of the experimental design: 34 groups of four male mice were subjected to the tube test. At the end of this testing period, blood samples were taken for measurement of corticosterone levels. Mice were then exposed to a courtship vocalization test, followed by measurement of blood testosterone and spleen noradrenaline levels (14 groups), or received DNA vaccination (20 groups; see Fig. 2). b Tube-test scores on each test day (n = 34 groups). Social ranks are based on performance on the last 5 test days (yellow). c Percentage of hierarchy stability during the last 5 test days. d Example vocalization (left) and the amount of vocalization relative to the group average per rank of social groups (n = 9). e Weight of mice per rank (n = 14 groups). f–h Blood testosterone per rank of social groups (n = 14) in absolute levels (f), relative to the group average (g), and relative to the group average split between 100% (orange; n = 6) and < 100% (yellow; n = 8) hierarchy stability (h). i–k Blood corticosterone per rank of social groups (n = 29) in absolute levels (i), relative to the group average (j), and relative to the group average split between 100% (orange; n = 17) and < 100% (yellow; n = 12) hierarchy stability (k). l–n Noradrenaline levels in spleen per rank of social groups (n = 12) in absolute levels (l), relative to the group average (m), and relative to the group average split between 100% (orange; n = 5) and < 100% (yellow; n = 7) hierarchy stability (n). Black square: rank 1; dark-gray circle: rank 2; gray diamond: rank 3; light-gray triangle: rank 4. Data are mean ± SEM. *P < 0.05, **P < 0.01. Statistics: one-way ANOVA with Tukey’s multiple-comparison test (e–n) and Pearson’s correlation (d).
To assess whether a subordinate role within these groups of 4 male mice was accompanied by chronic psychosocial stress, blood samples were taken and analyzed for levels of corticosterone. The serum corticosterone concentration was low in the majority of groups (on average 67 ng/mL), and although it did not differ significantly among ranks (Fig. 1i), we did observe a negative correlation between social status and corticosterone levels (Supplementary information, Fig. S2b). When we calculated corticosterone levels relative to the group average, they were significantly higher in 4th-ranked mice than in 1st-ranked mice (Fig. 1j), particularly in groups whose hierarchy was fully stable (Fig. 1k). As an index for basal stress levels mediated by the sympathetic nervous system (SNS), spleens were isolated, and the concentration of noradrenaline was measured. Noradrenaline levels were similar among social ranks (Fig. 1l, m) in both stable and unstable hierarchies (Fig. 1n and Supplementary information, Fig. S2c), indicating that social status did not influence basal SNS activity. We used this experimental setup of social groups with four male mice as a model to study the relationship between social status and adaptive immune responses.
To challenge the adaptive immune system, we chose a vaccination strategy that triggers robust immune responses of CD8+ T-cells. We applied a DNA vaccination by intradermally tattooing a plasmid encoding the immunodominant MHC class I epitope of herpes simplex virus glycoprotein B (gB). This vaccination method was designed to selectively activate T-cells and was previously shown to induce the clonal expansion of antigen-specific CD8+ T-cells, leading to functional T-cell responses.31 Mice were vaccinated three times at the hind leg at two-day intervals, and blood samples were drawn at multiple time points after vaccination and analyzed by flow cytometry (Fig. 2a). The percentage of gB-specific T-cells among the CD8+ population was determined by MHC-tetramer staining (Fig. 2b, c). To test whether chronic elevations in corticosterone or testosterone affected T-cell populations in our model system, mice were implanted with pellets that released either of these hormones. Corticosterone, and to a lesser extent testosterone, suppressed the basal levels of lymphocytes circulating in the blood (Supplementary information, Fig. S3). Chronically high levels of corticosterone also severely suppressed the increase in gB-specific T-cells upon DNA vaccination, whereas high testosterone levels had no significant effect (Supplementary information, Fig. S3).

a Schematic of the experimental design: 20 groups of four male mice were subjected to the tube test and then received gB vaccination. Afterwards, for 15 of the 20 groups, 1 more week of the tube test was performed, followed by OVA vaccination. Sampling time points for FACS analysis are indicated in blue. b Basal T-cell levels in blood did not differ among social ranks. Example of a forward–side scatter FACS dot plot from a blood sample, with the lymphocyte population in red, and the percentage of lymphocytes in blood leukocytes (left). Representative FACS histogram of CD8 immunostaining of the lymphocyte population and the percentage of CD8+ cells in lymphocytes (right). Data are presented by rank (n = 20) within social groups of C57BL/6 mice. c Representative FACS plots of CD8+ T-cells (in red box) that recognize MHC tetramers loaded with gB peptide at day 12 after vaccination. d, e Time course of the percentage of gB-specific T-cells for all mice (n = 80; d) and split by rank (n = 20 groups; e). f–h Percentage of gB-specific T-cells (day 12) per rank of social groups (n = 20) in absolute levels (f), relative to the group average (g), and relative to the group average split between 100% (orange; n = 14) and < 100% (yellow; n = 6) hierarchy stability (h). i Relative blood corticosterone levels vs relative gB-specific T-cell expansion (n = 60 mice). j–m Representative FACS plots of CD8+ T-cells (in red box) that recognize MHC tetramers loaded with OVA peptide at day 12 after vaccination (j) and percentages of OVA-specific CD8+ T-cells per rank (n = 15 groups) shown as a time course (k), on day 12 (l), and relative to the group average (m). Black square: rank 1; dark-gray circle: rank 2; gray diamond: rank 3; light-gray triangle: rank 4. Data are mean ± SEM. *P < 0.05, **P < 0.01. Statistics: one-way ANOVA with Tukey’s multiple-comparison test (b, f, g, h, l, m), two-way ANOVA with Tukey’s multiple-comparison test (e, k), and Pearson’s correlation (i).
We compared the basal T-cell levels among mice of different social status. The percentages of total lymphocytes among leukocytes and of CD8+ T-cells among lymphocytes did not differ among ranks (Fig. 2b), consistent with the above finding that hormone levels were not sufficiently different among ranks to affect the basal percentages of T-cells in blood. Upon vaccination, the percentages of antigen-specific CD8+ T-cells gradually increased, peaking at day 12 after the 1st vaccination (Fig. 2d). Whereas gB-specific CD8+ T-cell levels progressed similarly for 1st-, 3rd-, and 4th-ranked mice, these percentages were 60% higher, on average, for 2nd-ranked mice than for the other ranks at day 12 post vaccination (Fig. 2e). The average antigen-specific CD8+ T-cell percentages at peak day 12 were significantly higher in 2nd-ranked mice than in 1st- and 4th-ranked mice in terms of absolute value (Fig. 2f) and significantly higher in 2nd-ranked mice than in the three other ranks when calculated relative to the group average (Fig. 2g). The greater potential for T-cell responses in 2nd-ranked mice was seen in both stable and unstable hierarchies (Fig. 2h). Although the increased gB-specific T-cell levels in blood induced by DNA vaccination were highly sensitive to elevated corticosterone levels (Supplementary information, Fig. S3), we observed no significant correlation between relative corticosterone level and the relative magnitude of T-cell responses (Fig. 2i). To examine whether our observation of greater T-cell responses in 2nd-ranked mice was independent of the specific antigen used, we re-established the tube-test ranks and then challenged the mice with a DNA vaccine encoding the immunodominant ovalbumin epitope. As observed after vaccination with the gB epitope, 2nd-ranked mice showed the largest increase in ovalbumin-specific CD8+ T-cell levels (Fig. 2j–m).
GluA1 expression is required for the distinct T-cell responses of 2nd-ranked mice
Social hierarchies in mice have a strong genetic basis32 and are influenced by the capacity for social learning and synaptic plasticity.33,34 To explore potential brain mechanisms that may link social status to peripheral T-cell responses, we used a mouse model in which the gene encoding the AMPAR subunit GluA1 was knocked out (GRIA1−/−). Owing to the absence of GluA1 in the brain, GRIA1−/− mice display impairments in LTP, memory encoding, and other forms of adaptive behavior.35,36,37 GluA1 expression is enriched in the nervous system and is undetectable in lymphoid tissues,38 making it unlikely that GluA1 expressed outside the brain directly influences immune responses.
We exposed social groups consisting of four GRIA1−/− littermate mice to the tube test (Fig. 3a). GRIA1−/− mice were able to establish social hierarchies (Fig. 3b), although with reduced stability compared with the social groups of wild-type (WT) mice (Fig. 3c and Supplementary information, Fig. S1b). Compared with WT mice, pairs of GRIA1−/− mice spent less time in the tube on average before a winner was decided (Supplementary information, Fig. S1a). Specifically, whereas encounters between WT mice were shorter when they involved a subordinate, encounters between GRIA1−/− mice were shorter irrespective of social rank. The tube-test results correlated significantly with the amount of courtship vocalizations (Fig. 3d), indicating that the behavior of GRIA1−/− mice in the tube test reflected hierarchical behavior. Serum corticosterone levels were low on average in these groups of GRIA1−/− mice (64 ng/mL), with slight differences between 2nd- and 3rd-ranked mice (Fig. 3e, f). The percentages of circulating lymphocytes were similar among ranks (Fig. 3g), indicating that basal T-cell levels were independent of social rank. Vaccination induced an increase in gB-specific CD8+ T-cell percentages in blood (Fig. 3h), which, in contrast to results from WT mice, was of a similar magnitude for the four different ranks (Fig. 3i, j). Antigen-specific T-cell levels were not correlated with relative corticosterone levels (Fig. 3k). These data indicate that social status does not influence T-cell immunity in the absence of GluA1 expression. In other words, 2nd-ranked mice must express GluA1 in order to show improved T-cell responses.

a Schematic of the experimental design: social groups (n = 12) consisting of 4 male GRIA1−/− mice (red) were subjected to the tube test. At the end of the testing period, courtship vocalizations and blood corticosterone were measured, and the mice then received gB vaccination. Sampling time points for FACS analysis are indicated in blue. b Tube-test scores on each test day. Social ranks are based on the last 5 test days (yellow). c Percentage of hierarchy stability during the last 5 test days. d Amount of vocalization relative to the group average per rank. e, f Blood corticosterone levels among ranks of social groups calculated as absolute levels, with individual groups shown as red open symbols and the average shown as red solid symbols (e), and as levels relative to the group average (f). g Percentage of lymphocytes in blood leukocytes (left) and percentage of CD8+ cells in lymphocytes (right) among ranks of GRIA1−/− groups. h Time course of the percentage of gB-specific T-cells per rank. i, j Percentage of gB-specific T-cells (day 12) per rank of social groups calculated as absolute levels (i) and relative to the group average (j). k Relative blood corticosterone levels vs relative gB-specific T-cell expansion. Red square: rank 1; dark-pink circle: rank 2; pink diamond: rank 3; light-pink triangle: rank 4. Data are mean ± SEM. *P < 0.05. Statistics: one-way ANOVA with Tukey’s multiple comparison test (e–g, i, j), two-way ANOVA with Tukey’s multiple comparison test (h), and Pearson’s correlation (d, k).
To examine whether mice benefit from expressing GluA1 in terms of becoming socially dominant and having improved T-cell responses, we established the social hierarchy in social groups composed of one GRIA1+/+ (WT), one GRIA1−/− (knockout), and two GRIA1+/− (heterozygote) littermates (Fig. 4a). These groups of mice developed stable hierarchies (Fig. 4b, c) with GRIA1−/− mice consistently ending up at the lowest rank (Fig. 4d), indicating that the lack of GluA1 provides a competitive disadvantage in tube-test encounters. Interestingly, the presence of GluA1 throughout the brain is not necessarily a prerequisite for becoming 1st in rank, since WT mice were ranked 2nd in the majority of groups (8 out of 12) (Fig. 4d). We did not observe differences in basal corticosterone levels among social ranks (Fig. 4e, f and Supplementary information, Fig. S1c) or GRIA1 genotypes (Fig. 4g), and the basal levels of circulating lymphocytes did not differ among GRIA1−/−, GRIA1+/−, and GRIA1+/+ mice (Fig. 4h). Upon DNA vaccination, gB-specific T-cells reached higher levels in 2nd-ranked mice compared with other ranks (Fig. 4i–k and Supplementary information, Fig. S1d). Correspondingly, T-cell responses tended to be greater in WT GRIA1+/+ mice than in GRIA1−/− littermates, with GRIA1+/− heterozygotes showing intermediate responses (Fig. 4l, m). Antigen-specific CD8+ T-cell responses were not correlated with relative glucocorticoid levels in these groups of mice (Fig. 4n). These results suggest that mice with increased synaptic plasticity throughout the brain have greater T-cell responses. However, our results do not reveal whether there is a direct or indirect causal relationship between brain synapses and the immune system.

a Schematic of the experimental design: social groups (n = 12) consisting of one GRIA1+/+ (black), two GRIA1+/− (brown), and one GRIA1−/−(red) littermate were subjected to the tube test. At the end of the testing period, blood corticosterone was measured, and the mice then received gB vaccination. Sampling time points for FACS analysis are indicated in blue. b Tube-test scores for each test day. Social rank was based on the last 5 test days (yellow). c Percentage of hierarchy stability during the last 5 test days. d Distribution of GRIA1 genotypes among ranks within social groups. e–g Blood corticosterone levels of social groups presented as absolute levels per rank, with individual groups shown as open symbols and the average shown as black solid symbols (e), levels relative to the group average per rank (f), and levels relative to the group average per genotype (g). h Percentage of lymphocytes in blood leukocytes (left) and percentage of CD8+ cells in lymphocytes (right) among GRIA1 genotypes. i–k Percentage of gB-specific CD8+ T-cells shown as a time course (i), as absolute levels (day 12) (j), and relative to the group average (k) per rank. l, m Percentage of gB-specific CD8+ T-cells shown as a time course (l) and relative to the group average (m) per genotype. n Relative blood corticosterone levels vs relative gB-specific T-cell responses. Black square: rank 1; dark-gray circle: rank 2; gray diamond: rank 3; light-gray triangle: rank 4. Data are mean ± SEM. *P < 0.05, **P < 0.01. Statistics: one-way ANOVA with Tukey’s multiple comparison test (e–h, j, k, m), two-way ANOVA with Tukey’s multiple comparison test (i, l), and Pearson’s correlation (n).
GluA1-expression in the dmPFC promotes T-cell responses
AMPAR plasticity in dmPFC neurons helps to promote a high social status.24,27 To assess whether GluA1 expression affects synaptic currents onto dmPFC neurons, we performed whole-cell electrophysiology on layer 5 excitatory neurons in the prelimbic (PL) area of the dmPFC of brain slices from mice with different GRIA1 backgrounds. PL synapses were significantly weaker in GRIA1−/− mice than in WT littermates, with those of GRIA1+/− heterozygotes being intermediate (Fig. 5a). To assess whether GluA1 expression in the dmPFC helps to promote a high social status and possibly improved T-cell immunity, we applied adeno-associated virus (AAV)-mediated gene transfer to GRIA1−/− mice. AAV encoding GFP-tagged GluA1 (or GFP as a control) was targeted bilaterally to the PL of the dmPFC in 3–4-week-old GRIA1−/− mice. The transgenes were placed under the control of the CaMKIIα promoter to selectively express GFP-GluA1 in excitatory neurons.39 Immunohistochemistry with a GluA1-specific antibody showed that GluA1 expression was largely confined to the PL area of the dmPFC (Fig. 5b). Whole-cell electrophysiology recordings demonstrated that GluA1 expression significantly increased synaptic strength at GFP-expressing layer 5 pyramidal neurons in the PL area (Fig. 5c).

a Representative traces, average mEPSC frequency, and mEPSC amplitude recorded from PL–dmPFC layer 5 neurons of WT (black, n = 24 cells), GRIA1-heterozygous (brown, n = 16 cells), and GRIA1-knockout (red, n = 21 cells) littermate mice. b AAV-mediated expression of GFP-GluA1 selectively in the PL-dmPFC of GRIA1−/− mice assessed by GluA1 immunostaining. Scale bars: left, 500 µm; right, 15 µm. c Representative traces, average mEPSC frequency, and mEPSC amplitude recorded from GFP-expressing PL–dmPFC layer 5 neurons of GRIA1−/− mice injected with AAV-GFP (green, n = 25 cells) or AAV-GFP-GluA1 (blue, n = 30 cells). Data are mean ± SEM. *P < 0.05, **P < 0.01, ****P < 0.0001. Statistics: one-way ANOVA with Tukey’s multiple-comparison test (a) and unpaired Student’s t-test (c).
After viral injection, male GRIA1−/− littermate mice were placed in social groups of four, in which one mouse received AAV encoding GFP-GluA1 and the other three received AAV encoding GFP (Fig. 6a). When exposed to the tube test, a clear social hierarchy became evident in all groups (Fig. 6b). These hierarchies were as stable, on average, as those in groups of GRIA1−/− mice (Fig. 6c and Supplementary information, Fig. S1b). Social ranks as established in the tube test were significantly correlated with performance in the courtship vocalization test, and the amount of vocalization was independent of GluA1 expression in the dmPFC (Fig. 6e). In the 8 social groups tested, mice expressing GluA1 in the dmPFC were ranked 1st in 4 groups, 2nd in 1 group, 3rd in 1 group, and 4th in 2 groups (Fig. 6d). It was recently shown that different cortical layers within the dmPFC have opposite effects on social status: whereas increased activity of layer 5 dmPFC neurons leads to an increase in social status, increased activity of layer 2/3 neurons lowers social status.40 For each mouse that was injected with AAV expressing GFP-GluA1, we calculated the extent to which GluA1 was expressed in layer 5 vs layer 2/3 in the dmPFC (Supplementary information, Fig. S4a). Mice in which GluA1 expression was predominantly targeted to layer 5 ended up at a high social status, whereas those in which GluA1 expression tended to be relatively higher in layer 2/3 had a low status within their social group (Supplementary information, Fig. S4b). Neither social rank nor GluA1-expression in the dmPFC influenced blood corticosterone levels (Fig. 6f, g) or basal levels of CD8+ lymphocytes circulating in blood (Fig. 6h) in these groups of mice. DNA vaccination triggered an increase in the percentage of gB-specific CD8+ T-cells, but this increase did not differ significantly among the social ranks (Fig. 6i–k). Direct comparison between mice that received GFP-GluA1 or GFP revealed that expression of GluA1 in the dmPFC enhanced T-cell responses (Fig. 6j, l, m), suggesting that dmPFC neurons can regulate T-cell immunity. The magnitude of T-cell responses was not correlated with relative blood corticosterone levels (Fig. 6n).

a Schematic of the experimental design: social groups (n = 8) consisting of four male GRIA1−/− littermate mice, one of which received GFP-GluA1 (blue) and three of which received GFP (green), were subjected to the tube test. At the end of the testing period, courtship vocalizations and blood corticosterone were measured, and the mice then received gB vaccination. Sampling time points for FACS analysis are indicated in blue. b Tube-test scores for each test day. Social rank was based on the last 5 test days (yellow). c Percentage of hierarchy stability during the last 5 test days. d Number of courtship vocalizations relative to the group average per rank (left) and comparison between GFP-GluA1-expressing and GFP-expressing mice (right). e Distribution of GFP-GluA1-expressing (blue) or GFP-expressing (green) mice among ranks of social groups. f, g Blood corticosterone levels shown as absolute levels per rank (f), shown relative to the group average per rank (g, left), and compared between GFP-GluA1-expressing and GFP-expressing mice (g, right). h Percentage of lymphocytes in blood leukocytes (top) and percentage of CD8+ cells in lymphocytes (bottom) for mice receiving GFP-GluA1 vs GFP. i–k Percentage of gB-specific CD8+ T-cells shown as a time course (i), in absolute levels (day 12) (j), and relative to the group average (k) per rank. l, m Percentage of gB-specific CD8+ T-cells shown as a time course (l) and relative to the group average (m), comparing GFP-GluA1-expressing vs GFP-expressing mice. n Relative blood corticosterone levels vs relative gB-specific T-cell expansion. Square: rank 1; circle: rank 2; diamond: rank 3; triangle: rank 4. Data are mean ± SEM. *P < 0.05, ****P < 0.0001. Statistics: one-way ANOVA with Tukey’s multiple-comparison test (f, g left, j, k), Pearson’s correlation (e left, n), unpaired Student’s t-test (e right, g right, h, m), and two-way ANOVA with Tukey’s multiple-comparison test (i, l).
On the basis of these findings, we considered two possibilities: either GluA1 expression in the dmPFC enhances social status, which in turn promotes T-cell responses, or GluA1 expression regulates social status and T-cell responses in parallel. To differentiate between these possibilities, we tested whether dmPFC synapses could stimulate T-cell responses in the absence of social interactions. Littermate GRIA1−/− mice were injected in the PL region with AAV expressing either GFP-GluA1 or GFP at 3–4 weeks of age and were then solitarily housed (Fig. 7a). To enable comparison with socially housed mice, these mice were trained in crossing the tube (without an opponent) and were exposed to a female to record courtship vocalization, which was not influenced by GluA1 expression in dmPFC neurons (Fig. 7b). These experiments with solitary mice (Fig. 7) were performed largely in parallel with those of socially housed mice (Fig. 6). The solitary mice were socially isolated after weaning, which has previously been reported to cause neurochemical and behavioral changes41 but without affecting basal stress levels.42,43,44,45 Correspondingly, we found that plasma corticosterone levels of solitary mice were comparable to those of socially housed mice (Supplementary information, Fig. S5a). As seen in social groups, GluA1 in the dmPFC did not affect corticosterone levels (Fig. 7c, d). In addition, noradrenaline levels in immune organs were not altered in solitary mice with GluA1 in the dmPFC (Fig. 7e). These data indicate that the increased strength of dmPFC synapses in GRIA1−/− mice did not change basal hypothalamic-pituitary-adrenal (HPA) axis or SNS activity. In line with this observation, basal levels of CD8+ T-cells in blood serum were not affected by GluA1 expression in the dmPFC (Fig. 7f). However, solitary mice expressing GluA1 in the dmPFC showed, on average, a greater increase in antigen-specific T-cells in response to vaccination (Fig. 7g). Although this increase in T-cell levels was not significantly greater in GluA1-transfected mice at peak day 14 (Fig. 7i, j), statistical significance was observed when taking the average of days 12, 14, and 17 combined (Supplementary information, Fig. S5b). These data suggest that dmPFC synapses do not require social behavior to boost T-cell responses.

a Schematic of the experimental design: solitary GRIA1−/− mice that received AAV expressing GFP-GluA1 (blue, n = 9) or GFP (green, n = 9) in the dmPFC or that received AAV expressing GFP-GluA1 in either the dmPFC (blue, n = 9) or the somatosensory cortex (S1, red, n = 9) were subjected to tube passing without an opponent. Courtship vocalizations and blood corticosterone were measured, and the mice then received gB vaccination. Sampling time points for FACS analysis are indicated in blue. b Number of courtship vocalizations relative to the average of littermates. c, d Blood corticosterone levels shown as absolute levels (c) and relative to the littermate average (d). e Relative noradrenaline levels in spleen, heart, and bone marrow of GRIA1−/− littermate mice with AAV-injection in the dmPFC expressing either GFP-GluA1 (n = 5) or GFP (n = 4). f Percentage of lymphocytes in blood leukocytes (left) and percentage of CD8+ cells in lymphocytes (right). g, h Time course of the percentage of gB-specific CD8+ T-cells upon expression of GFP-GluA1 or GFP in the dmPFC (g) and upon GFP-GluA1 expression in either the dmPFC or S1 (h). i, j Percentage of gB-specific T-cells (day 14) in absolute levels (i) and relative to the littermate average (j). k No correlation was observed between relative blood corticosterone levels and relative gB-specific T-cell expansion. l Significant correlation between the percentage of the PL area in the dmPFC positive for GluA1-immunostaining and the relative T-cell response of social (Fig. 7) and solitary GRIA1−/− mice that received GFP-GluA1 in the PL-dmPFC (n = 26). Data are mean ± SEM. *P < 0.05. Statistics: unpaired Student’s t-test (b–f, i, j), Pearson’s correlation (k, l), and two-way ANOVA with Tukey’s multiple comparison test (g, h).
Because GluA1 can be considered a foreign antigen to GRIA1−/− mice, the injected AAV expressing GluA1 may theoretically have primed their immune systems, possibly further influencing immune responses. To control for this possibility, we included an experiment in which littermate GRIA1−/− mice were injected with AAV expressing GFP-GluA1 either in the dmPFC or in a brain region not expected to be involved in linking social status to the immune system: the primary somatosensory cortex (S1). The mice were subsequently solitarily housed (Fig. 7a). These solitary mice showed similar levels of courtship vocalization irrespective of whether GluA1 was expressed in the dmPFC or S1 (Fig. 7b). Blood corticosterone levels were higher in these groups of solitary mice than in solitary mice from the previous experiment (Fig. 7c), and although this had no effect on the basal percentages of circulating CD8+ T-cells (Fig. 7f), the overall magnitude of T-cell increase was lower than that in the previous experiment (Fig. 7i; Supplementary information, Fig. S5b). Nevertheless, GRIA1−/− mice that received GFP-GluA1 in the dmPFC showed a significantly greater expansion of antigen-specific CD8+ T-cells than those that received GFP-GluA1 in S1 in this experiment (Fig. 7h–j; Supplementary information, Fig. S5b), indicating that GluA1 expression specifically in the dmPFC increases T-cell responses without a contribution of antigenic effects. The relative magnitude of gB-specific T-cell expansion was not correlated with relative basal corticosterone levels (Fig. 7k). When we combined data from all GRIA1−/− mice that received GFP-GluA1 in the dmPFC (i.e., both socially and solitarily housed mice), the relative gB-specific T-cell level was positively correlated with the percentage of GluA1-expression in the PL region (Fig. 7l). When percentages of GluA1-expression in layers 2/3 and 5 were calculated separately, this correlation was statistically significant for layer 5 neurons but not for layer 2/3 neurons (Supplementary information, Fig. S4c, d). These results indicate that strengthening dmPFC excitatory synapses in GRIA1−/− mice was sufficient to promote T-cell expansion upon vaccination, demonstrating a mechanistic link between synaptic strength in the dmPFC and the peripheral adaptive immune system.
Activation of dmPFC neurons promotes T-cell responses
We observed that increasing synaptic strength onto dmPFC neurons selectively boosted the T-cell responses induced by vaccination. Since increased synaptic strength may translate to increased output activity, we next tested whether T-cell responses were enhanced when dmPFC neurons increased their activity. We applied the excitatory DREADD (designer receptors exclusively activated by designer drugs) system by bilaterally injecting AAV encoding the Gq-coupled hM3D receptor into the PL area of the dmPFC of WT mice (Fig. 8a). Expression of hM3Dq, which was under the control of a CaMKIIα promoter, only affects neuronal function in the presence of clozapine-based drugs such as deschloroclozapine (DCZ),46,47 showing a significant increase in intrinsic excitability in dmPFC neurons (Supplementary information, Fig. S6a). Mice received injections of AAV expressing either hM3Dq-mCherry or mCherry as a control and were vaccinated 3–4 weeks later with the gB epitope (Fig. 8a). As expected, basal lymphocyte levels circulating in the blood did not differ between the two groups of mice (Supplementary information, Fig. S6b). On days 10, 12, and 14 after the first vaccination, which were the time points when expansion of gB-specific T-cells was observed, the mice received an injection of DCZ. Two hours after DCZ injection, blood samples were taken and analyzed by fluorescence-activated cell sorting (FACS). On the days when mice were injected with DCZ, gB-specific T-cell levels were significantly higher in mCherry-hM3Dq-expressing mice than in mCherry-expressing mice (Fig. 8b, c). Injection of DCZ together with propranolol, a drug that selectively blocks β-adrenergic receptors (the type of adrenergic receptor that CD8+ T-cells primarily express), still boosted gB-specific CD8+ T-cell responses (Supplementary information, Fig. S6c), arguing against involvement of the SNS in communication between the dmPFC and the immune system. Inhibition of dmPFC neurons by expression of the inhibitory DREADD hM4Di in the PL area tended to reduce the expansion of gB-specific T-cells upon vaccination (Supplementary information, Fig. S6d). These data indicate that the activity of dmPFC neurons influences antigen-specific T-cell responses to vaccination.

a Representative image of AAV-mediated hM3Dq-mCherry expression (scale bars: left, 500 µm; right, 25 µm) selectively in the PL-dmPFC of WT mice and schematic of the experimental design with sampling time points indicated in blue. b Representative FACS plots of CD8+ T-cells (in red box) that recognize MHC tetramers loaded with gB peptide at day 12 after vaccination. c Time course of the absolute percentage of gB-specific CD8+ T-cells, showing a comparison between hM3Dq-mCherry (red; n = 22) and mCherry (gray; n = 21) in the dmPFC and relative to the littermate average (day 14). d Volcano plot of differentially expressed genes in splenic CD8+ T-cells at day 14 after vaccination. Data are mean ± SEM. *P < 0.05. Statistics: unpaired Student’s t-test (c, right) and two-way ANOVA with Tukey’s multiple-comparison test (c, left).
We next asked whether activation of dmPFC neurons altered the gene expression profiles of peripheral CD8+ T-cells. Mice that expressed hM3Dq-mCherry or mCherry in PL-dmPFC neurons received injections of DCZ on days 10, 12, and 14 after vaccination, and their spleens were isolated 2 h after the third DCZ injection (day 14) (Supplementary information, Fig. S7a). DNA vaccination led to an accumulation of gB-specific CD8+ T-cells in the spleen (Supplementary information, Fig. S7b) similar to that observed in the blood. FACS was used to sort splenocytes for CD8+ cells, on which we then performed gene expression (RNA sequencing) analysis. This analysis revealed that 192 genes were significantly upregulated and 102 genes were significantly downregulated in CD8+ cells of mice with hM3Dq-mCherry in the dmPFC (Fig. 8d and Supplementary information, Fig. S7c, d), indicating that activation of dmPFC neurons alters the gene expression patterns of CD8+ splenocytes. To understand which functional pathways were linked to these differences in gene expression, we performed a Kyoto Encyclopedia of Genes and Genomes (KEGG) analysis, which revealed significant activation of the p38 MAPK pathway in CD8+ splenocytes, specifically on the basis of the genes that were upregulated (Supplementary information, Fig. S8). The MAPK pathway is activated upon T-cell receptor activation and promotes both proliferation and survival of CD8+ T-cells.48 The two genes that were most significantly upregulated, Hspa1a (10-fold) and Hspa1b (12-fold), encode Hsp70 heat-shock proteins, which interact with MAPK and are known to maintain protein homeostasis and avert apoptosis.49 Other notable genes whose expression changed significantly encoded the interleukin-7 receptor (IL7R; 1.4-fold down), chemokine receptor CXCR4 (1.6-fold down), invariant chain CD74 (1.6-fold up), and CD8 alpha chain (CD8a; 1.2-fold up) (Supplementary information, Fig. S7d and Table S1). IL7R and CXCR4 are expressed on naïve T-cells and are downregulated upon T-cell receptor activation.50,51 CD74 has been identified as an activation marker of T-cells,52 and CD8a gene expression increases in CD8+ effector T-cells upon exposure to pro-inflammatory cytokines.53 Combined, these gene expression patterns point toward increased proliferation and/or survival of CD8+ T-cells in response to vaccination as a consequence of dmPFC neuronal stimulation, which leads to higher levels of activated effector T-cells in the spleen.