
XPC is required for Th17 cells differentiation
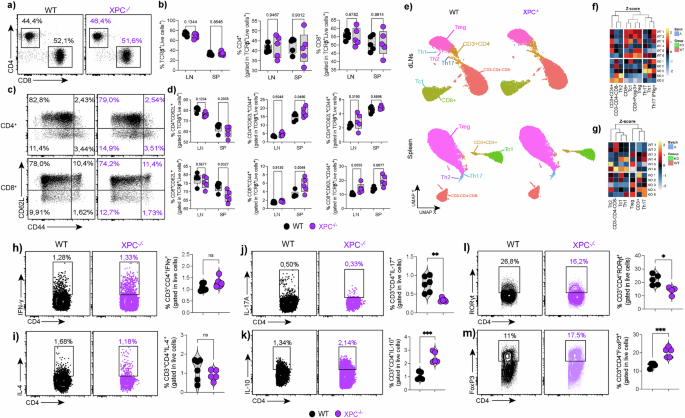
Initially, we investigated whether lack of XPC affects the differentiation of CD4+ and CD8 + T cells under steady-state conditions. We collected draining lymph nodes and spleens from 6–8 week-old WT and XPC−/− mice. Flow cytometry analysis revealed no significant difference in the frequency of CD4+ and CD8+ T cells between WT and XPC−/− mice in the lymph nodes and spleens (Fig. 1a, b). Moreover, the frequency of naive (CD62L+CD44−) and memory (CD62L−CD44+) subsets of both CD4+ and CD8+ T cells was comparable between the two groups (Fig. 1c, d).

a–b Flow-cytometric analysis of total CD4⁺ and CD8⁺ T-cell frequencies in draining lymph nodes (LN) and spleen (SP) from WT and XPC⁻/⁻ mice under steady-state conditions (n = 5 per group). Data are shown as box plots, in which the center line represents the median, the bounds of the box indicate the 25th and 75th percentiles, and the whiskers denote minimum and maximum values. Individual dots represent independent biological replicates. Statistical significance was assessed using a two-sided unpaired Student’s t-test, with exact P values indicated. c–d Frequencies of naïve (CD62L⁺CD44⁻) and memory (CD62L⁻CD44⁺) subsets within CD4⁺ and CD8⁺ T cells from LN and SP of WT and XPC⁻/⁻ mice (n = 5 per group). Box plots are defined as in (a–b). Statistical analysis was performed using a two-sided unpaired Student’s t-test, with exact P values reported. e UMAP projection of flow cytometry data from total CD3⁺ T cells showing comparable overall distribution of major subsets (Th1, Th2, Th17, Treg, Tc1, CD8⁺) between WT and XPC⁻/⁻ mice in LN and spleen. f–g Heatmaps of Z-score–normalized gene-expression profiles illustrating similar lineage-specific transcriptional signatures across the two genotypes. Z-scores were calculated per gene across samples. Hierarchical clustering was performed using Euclidean distance and complete linkage. h–m Representative flow cytometry plots and quantification of intracellular cytokine and transcription factor staining in CD4⁺ T cells, showing Th1 (IFN-γ), Th2 (IL-4), Th17 (IL-17A, RORγt), Treg (Foxp3), and IL-10⁺CD4⁺ populations in WT and XPC⁻/⁻ mice. Quantitative data are presented as mean ± SEM, with individual points representing independent biological replicates (WT, n = 6; XPC⁻/⁻, n = 5). Statistical significance was determined using a two-sided unpaired Student’s t-test. Exact P values are shown in the graphs; (*p < 0.05, **p < 0.01, ***p < 0.001) indicate statistically significant differences. LN, lymph node; SP, spleen. WT samples are shown in black and XPC⁻/⁻ samples in purple. Data are representative of at least three independent experiments.
We next examined the differentiation of specific T cell subsets, including Th1, Th2, Th17, Treg, and Tc1 cells. UMAP plots confirmed that the overall distribution of these subsets was similar in both WT and XPC−/− mice in the draining lymph nodes and spleen (Fig. 1e). Heatmaps comparing Z-scores of gene expression also confirmed no significant differences in the differentiation of these subsets (Fig. 1f,g).
To further investigate how XPC deficiency affects CD4⁺ T-cell subset differentiation, we analyzed intracellular cytokine expression and transcription factor profiles in CD3⁺CD4⁺ cells isolated from draining lymph nodes of WT and XPC−/− mice. We observed that IFN-γ–producing Th1 and IL-4–producing Th2 cells were comparable between genotypes, whereas IL-17A⁺ Th17 cells were reduced in XPC−/− mice while in IL-10–producing CD4⁺ T cells were increased (Fig. 1h–k). At the transcription-factor level, RORγt⁺ CD4⁺ Th17 cells resemble the cytokine defect with a reduction in XPC−/− mice, while Foxp3⁺ Treg were expanded, suggesting a shift toward a regulatory phenotype with selective impairment of the Th17 program (Fig. 1l, m).
To further investigate whether XPC deficiency affects in vitro T helper cell differentiation, we isolated CD4+CD62Lhigh T cells from the lymph nodes and spleens of both WT and XPC−/− mice and cultured them under Th1, Th2, Treg, and Th17 cell polarizing conditions for five days. Flow cytometry analysis showed that the deficiency of XPC did not affect the differentiation of Th1, Th2 and Treg cells (Supplementary Fig. 1A, B, D). However, the in vitro differentiation of Th17 cells was significantly impaired in the absence of XPC, as the frequency of IL-17A-producing cells was notably lower compared to WT mice (Supplementary Fig. 1C). This reduction in Th17 differentiation was associated with diminished mRNA expression of Rorc, Stat3, and Il17a, as shown by qPCR analysis (Supplementary Figs. 1E–G).
In summary, while XPC deficiency does not impact the overall differentiation of CD4+ or CD8+ T cells, nor the development of Th1 or Th2 cells, it significantly impairs the generation of IL-17A-producing Th17 cells. Interestingly, XPC deficiency leads to an increase in FOXP3+ Treg cells. These results suggest a critical role for XPC in the balance between Treg and Th17 populations under steady-state conditions.
Th17 cells accumulate less DNA damage with enhanced XPC expression
Next, we investigated the role of XPC in the DNA damage response across different T cell subsets and explored potential regulatory mechanisms controlling its expression. We first measured the levels of γH2AX, a marker of DNA damage, across various T helper (Th) cell subsets and Treg cells using flow cytometry. As shown in Fig. 2a, the naïve T cells displayed the lowest levels of γH2AX, indicating minimal DNA damage in these resting cells. In contrast, Th0 and Th2 cells showed significantly elevated γH2AX expression, reflecting higher levels of DNA damage or an active DNA damage response in these subsets. Interestingly, Th1, Th17, and Treg cells exhibited lower γH2AX levels compared to Th0 cells, though their level was still higher than that of naïve T cells (Fig. 2a–c). Western blot analysis confirmed the presence of γH2AX across the subsets, further supporting differential activation of the DNA damage response among polarized CD4+ T cells (Fig. 2d, e).

a–c Flow cytometric analysis of γH2AX in naïve, Th0, Th1, Th2, Th17 and Treg cells showing representative histograms, mean fluorescence intensity (MFI) and quantification across subsets (n = 3 technical replicates). Data are presented as mean ± SEM and analyzed using a two-sided one-way ANOVA followed by Tukey’s multiple-comparisons post hoc test; exact P values are indicated in the graphs. d–e Immunoblot analysis of γH2AX in polarized Th subsets, showing a representative blot from a single experiment with densitometric quantification of normalized band intensities (γH2AX/β-actin) derived from the same experiment. Data are presented as mean ± SEM and analyzed using a two-sided one-way ANOVA with Tukey’s post hoc test; exact P values are indicated. f Heatmap of DNA repair gene expression in Th17 cells displayed as Z-score–normalized values calculated per gene across samples. g Flow cytometric quantification of XPC across Th subsets (n = 3 technical replicates); box plots show the median, 25th–75th percentiles, and whiskers indicating minimum and maximum values; two-sided one-way ANOVA with Tukey’s post hoc test, exact P values shown. h Immunoblot of XPC during Th17 differentiation (0–96 h), representative of a single experiment with densitometry normalized to β-actin from the same experiment; two-sided one-way ANOVA with Tukey’s post hoc test, exact P values indicated. i Confocal images of Th17 cells stained for γH2AX (green), XPC (red) and DAPI (blue). Scale bar, 5 µm. j–m qPCR of cytokine-induced Xpc (n = 3 technical replicates; two-sided one-way ANOVA with Tukey’s post hoc test, exact P values shown), regulatory potential scores, ATAC-seq/ChIP-seq tracks and predicted motifs at the Xpc promoter. n–o qPCR and immunoblot analyses of XPC in WT vs Batf⁻/⁻ Th17 cells (n = 3 technical replicates; two-sided unpaired Student’s t-test, exact P values shown). Colors indicate cell subsets or genotypes as labeled in each panel. Data are representative of at least three independent experiments unless otherwise indicated. Statistical significance is indicated as follows (*p < 0.05, **p < 0.01, ***p < 0.001).
We then examined the expression of XPC and other DNA repair genes across Th17 cells compared to non-polarized Th0 cells. Heatmap analysis of log fold changes (logFC) showed that Th17 cells had increased expression of several DNA repair genes, including Xpc, Xpa, Ercc1, Ercc3, Ercc5, Ercc6, Xcrcc1, Polb, Parp1, Aptx and Xcc4 when compared to Th0 cells (Fig. 2f). Consistently, flow cytometry revealed higher XPC abundance in Th17 cells relative to other subsets, and a time-course Western blot corroborated a progressive induction of XPC from 24 h to 96 h of Th17 differentiation (Fig. 2g, h). Immunofluorescence imaging further revealed nuclear co-localization of XPC with γH2AX foci, confirming that XPC accumulates at sites of DNA damage in Th17 cells (Fig. 2i).
We next examined the upstream signals and transcriptional regulators that control Xpc mRNA expression in Th17 cells. We found that Xpc mRNA was induced by anti-CD3 alone or in combination with anti-CD28 and TGF-β, whereas CD28 co-stimulation or individual IL-6, IL-23, or IL-1β did not increase Xpc mRNA. Interesting, maximal induction occurred only under the full Th17-polarizing condition (anti-CD3 + CD28 + TGF-β + IL-6 + IL-23 + IL-1β) (Fig. 2j). Next, we used regulatory potential (RP) scores, which rank transcription factors based on their capacity of regulating specific genes. This analysis highlighted several key transcription factors, including BATF, RORγt, and IRF4, that exhibited high RP scores and are known to be critical for Th17 differentiation (Fig. 2k). Chromatin immunoprecipitation followed by sequencing (ChIP-seq) reanalyzed from the dataset generated by Ciofani et al., (2012) confirmed the binding of BATF, RORγt, and IRF4 to the Xpc promoter specifically in Th17 cells, with BATF showing particularly strong enrichment (Fig. 2l). This indicates that these transcription factors likely play a central role in driving Xpc expression during Th17 differentiation. Notably, the accessibility of the Xpc promoter (as indicated by ATAC-seq data derived from the dataset generated by Svensson et al., 2019) was significantly higher in Th17 cells compared to non-polarized Th0 cells (Fig. 2l). Motif analysis shows a high affinity binding site of BATF on the Xpc promoter. This was supported by the motif scores, which showed BATF as having the highest predicted binding sequence among the transcription factors analyzed, followed by RORγt and IRF4 (Fig. 2m). These results suggest that BATF, directly regulates Xpc transcription in Th17 cells. To validate the role of BATF in controlling XPC expression, we examined XPC levels in BATF-deficient (Batf−/−) Th17 cells. qPCR analysis shows a decreased expression of Xpc mRNA in Batf−/−–deficient Th17 cells (Fig. 2n), which goes in line with western blot analysis showing a reduction in XPC protein levels in Batf-/- Th17 cells compared to WT controls (Fig. 2o). This suggests that BATF is a critical transcriptional regulator of XPC expression during Th17 differentiation, ensuring that sufficient DNA repair capacity is available to support the proper development of these cells.
The deficiency of XPC impairs the effector program of Th17 cells
Next, we investigate if the impaired IL-17A production by XPC-deficient Th17 cells was related to changes in their effector function. First, we performed transcriptomic analysis by bulk RNA-seq and we found a downregulation of lineage-defining transcription factors (Rorc, Batf, Runx1, Maf, Prdm1) together with Th17-associated cytokines and receptors (Tgfbr1, Il1r1, Il21r, Il21, Il22, Il17a) and chemokine pathways (Ccr6, Ccr4, Cx3cr1, Cxcr5, Ccl22, Ccl1, Cxcl10) in XPC-deficient Th17 cells. Conversely, genes linked to regulatory and inhibitory signaling including Il10, Bcl6, Socs1, Socs3, and Stat5b were upregulated in the absence of XPC (Fig. 3a). The differentiation and function of Th17 cells rely on the activity of RORγt, a transcription factor responsible for the expression of lineage signature genes such as Il17a and Il23r1,2,3. We observed that the reduction of IL-17A production by XPC-deficient Th17 cells was associated with a significantly decreased expression of RORγt (Fig. 3a–f). In addition, these findings go along with a decreased STAT3 phosphorylation, and a decline in the expression of IL-23R but not IL1R1 in the Th17 cells that developed in the absence of XPC (Fig. 3g–o).

a Heatmap from bulk RNA-seq of WT and XPC⁻/⁻ Th17 cells showing genes related to transcriptional regulation, cytokine signaling, and chemokine responses, displayed as Z-score–normalized values calculated per gene across samples. b–c Flow cytometry contour plots and histograms showing IL-17A and RORγt expression in CD4⁺ T cells from WT and XPC⁻/⁻ mice, with percentages of IL-17A⁺RORγt⁺ and IL-17A⁻RORγt⁺ populations and mean fluorescence intensity (MFI) values indicated (n = 5 technical replicates). d–f) Quantification of CD4⁺IL-17A⁺RORγt⁺ cells, CD4⁺RORγt⁺ cells, and RORγt expression (MFI) in WT and XPC⁻/⁻ mice (n = 5 technical replicates). Data are presented as mean ± SEM and analyzed using a two-sided unpaired Student’s t-test, with exact P values indicated. g–i Flow cytometric analysis and quantification of phosphorylated STAT3 (pSTAT3) expression in CD4⁺ T cells from WT and XPC⁻/⁻ mice, shown as percentage of pSTAT3⁺ cells and MFI (n = 5 technical replicates). Data are presented as mean ± SEM and analyzed using a two-sided unpaired Student’s t-test, with exact P values shown. j–l Flow cytometry histograms and quantification of IL-23R expression in CD4⁺ T cells from WT and XPC⁻/⁻ mice, shown as percentage of IL-23R⁺ cells and MFI (n = 5 technical replicates). Data are presented as mean ± SEM and analyzed using a two-sided unpaired Student’s t-test, with exact P values indicated. (M–O) Flow cytometry histograms and quantification of IL-1R1 expression in CD4⁺ T cells from WT and XPC⁻/⁻ mice, shown as percentage of IL-1R1⁺ cells and MFI (n = 5 technical replicates). Data are presented as mean ± SEM and analyzed using a two-sided unpaired Student’s t-test, with exact P values shown. p–q) Flow cytometry contour plots and quantification of CD4⁺IL-17A⁺FoxP3⁺ T cells in WT and XPC⁻/⁻ mice (n = 5 technical replicates), presented as mean ± SEM and analyzed using a two-sided unpaired Student’s t-test with exact P values indicated. WT samples are shown in black and XPC⁻/⁻ samples in purple. Data are representative of at least three independent experiments. Statistical significance is indicated as follows (*p < 0.05, **p < 0.01, ***p < 0.001).
The differentiation of Th17 cell and Tregs share a common signaling pathway involving TGF-β. In this context, low concentrations of TGF-β, in conjunction with IL-6 and IL-21, promote the differentiation of Th17 cells, whereas high concentrations inhibit Th17 cells differentiation and instead promote the expression of FOXP3, leading to Treg differentiation. We investigated if the decreased expression of RORγt in XPC-deficient Th17 cells could be related to an increase in FoxP3 expression. Surprisingly, we found that even the expression of FoxP3 was downregulated in XPC-/- Th17 cells (Fig. 3p, q).
CD4+ T cells lacking XPC exhibit an inability to differentiate into IL-17A+/IFN-γ+ producing cells and are incapable of inducing T cell-induced colitis in Rag1−/− mice
To investigate the impact of XPC absence on the function and differentiation of CD4+ T cells in vivo, we sorted CD4+CD45RBhigh naive T cells from both WT and XPC−/− mice and transferred them into Rag1−/− mice. Subsequently, we monitored the development of colitis. Conversely to Rag1−/− mice receiving WT CD4+ T cells, those that received XPC−/− CD4+ T cells did not exhibit weight loss or colon shortening and displayed reduced colon inflammation. Endoscopy analysis revealed fewer signs of granularity, fibrin, and diarrheic stool in Rag1−/− mice that received XPC-deficient CD4 + T cells (Fig. 4a–f).

a Body weight change, expressed as percentage of initial weight, in Rag1⁻/⁻ mice receiving CD4⁺CD45RB^high T cells from WT or XPC⁻/⁻ donors, monitored weekly for 4 weeks after transfer (n = 5 per group). Data are presented as mean ± SEM and analyzed using a two-sided two-way ANOVA with repeated measures followed by Tukey’s multiple-comparisons post hoc test. b Colon length measured at the experimental endpoint in Rag1⁻/⁻ mice receiving WT or XPC⁻/⁻ CD4⁺ T cells (n = 5 per group). Data are shown as mean ± SEM and analyzed using a two-sided unpaired Student’s t-test. c–f Representative colonoscopy images, hematoxylin and eosin–stained histological sections, and quantification of endoscopy and histology scores in Rag1⁻/⁻ mice receiving WT or XPC⁻/⁻ CD4⁺ T cells (n = 5 per group). Quantitative data are shown as individual data points with mean ± SEM and analyzed using two-sided unpaired Student’s t-tests with exact P values indicated. g–h Flow cytometry contour plots showing IFN-γ, IL-17A, and FoxP3 expression in CD4⁺ T cells isolated from mesenteric lymph nodes (mLNs) and large-intestine lamina propria (LI-LP) of Rag1⁻/⁻ mice receiving WT or XPC⁻/⁻ CD4⁺ T cells. i–j Quantification of CD4⁺CD45⁺ T cell subsets (IL-17A⁺, IFN-γ⁺, and FoxP3⁺) from mLNs and LI-LP (n = 5 per group). Data are presented as mean ± SEM and analyzed using two-sided unpaired Student’s t-tests with exact P values indicated. k–m t-SNE analysis of immune cell populations from colonic tissue of Crohn’s disease patients, heatmap showing scaled expression of DNA repair genes, transcription factors, and cytokines, and t-SNE plots displaying expression of selected genes (H2AFX, XPC, XPA, RORC, IL17A). Single-cell RNA-seq data were obtained from the Broad Institute Single Cell Portal (SCP1884) and originally published by Kong et al. (2023). WT samples are shown in yellow and XPC⁻/⁻ samples in purple. Data are representative of at least three independent experiments unless otherwise indicated. Statistical significance is indicated as follows (*p < 0.05, **p < 0.01, ***p < 0.001).
Subsequently, we assessed cytokine production by WT and XPC-deficient CD4+ T cells in the mesenteric lymph nodes (mLNs) and colonic lamina propria (cLP) of Rag1−/− mice four weeks post-T cell transfer. The frequency of TCR-β+CD4+IL17A+ and TCR-β+CD4+IL17A+IFN-γ+ producing cells were significantly diminished in mice transferred with XPC-deficient CD4 + T cells compared to those receiving WT CD4+ T cells (Fig. 4g–j). Furthermore, the frequency of TCR-β+CD4+FOXP3+ T cells was increased in mice transferred with XPC-deficient CD4+ T cells compared to Rag1−/− mice receiving WT ones (Fig. 4h–j).
Next, we analyzed single-cell data obtained from Crohn’s disease (CD) patients, accessible through the Single Cell portal at the Broad Institute (SCP1884) and obtained from the study of Kong et al.24, in order to understand if Th17 cells from CD patients express genes related to DNA damage and the NER DNA repair pathway including XPC. In this dataset, CD45+ cells were isolated from colon biopsies of both healthy controls and individuals with CD, and then subjected to single-cell sequencing. CD45+ cells derived from CD patients displayed heightened expression levels of DNA repair genes, including XPA, XPC, ERCC4, ERCC6 and RAD23B. Th17 cells from CD patients exhibited increased expression of XPC alongside with the classical genes of its signature, RORC, STAT3, IL17A and IL17F, suggesting a potential role for XPC in the differentiation of human Th17 cells during the course of CD (Fig. 4k–m).
The deficiency of XPC alters the expression of genes associated with DNA repair pathways in Th17
To unravel the mechanism by which XPC influences Th17 cell differentiation, we next analyze our bulk RNA-seq on both WT and XPC-deficient Th17 cells. Remarkably, our analysis identified 1758 genes that were significantly downregulated and 1447 genes that were upregulated in XPC-deficient Th17 cells (Fig. 5a). Gene ontology analysis unveiled an enrichment of genes associated with various pathways, prominently including DNA repair and DNA replication, which are important for DNA processing and repair (Fig. 5b). Based on the log2FC, we rank the top different expressed genes (DEGs), and we observed that genes such as Exo1 involved in the BER DNA repair pathway was significant downregulated, and the gene Txnip that encodes the protein Thioredoxin-interacting protein (TXNIP) and is involved in the inhibition of antioxidant response25 was significant upregulated in Th17 cells lacking XPC (Fig. 5c). The gene enrichment network illustrated interconnected and enriched genes from pathways such as BER, NER, and mismatch repair, intertwined with pathways related to cell cycle, cellular senescence, and metabolic processes (Fig. 5d).

a Volcano plot showing differentially expressed genes (DEGs) between XPC⁻/⁻ and WT Th17 cells. Genes upregulated in XPC⁻/⁻ cells are highlighted in yellow, and downregulated genes in purple. Differential expression was determined using an adjusted P value threshold as described in Methods. b Gene Ontology (GO) enrichment analysis of DEGs, showing biological processes enriched in XPC⁻/⁻ Th17 cells. Dot size represents the number of genes per category, and color indicates adjusted P values. c Bar plot showing selected differentially expressed genes ranked by log₂ fold change (log₂FC) between XPC⁻/⁻ and WT Th17 cells. d Network map illustrating interactions between metabolic and DNA repair pathways enriched in XPC⁻/⁻ Th17 cells. Nodes represent pathways, and edges indicate functional associations, highlighting cell cycle, DNA repair, and metabolism. e Heatmaps displaying Z-score–normalized expression of genes involved in nucleotide excision repair, base excision repair, mismatch repair, cell cycle, cellular senescence, and metabolic pathways in WT and XPC⁻/⁻ Th17 cells. Z-scores were calculated per gene across samples. f Flow cytometry histogram and quantification of Annexin V staining in WT and XPC⁻/⁻ Th17 cells. Data are presented as mean ± SEM with individual technical replicates (n = 3) and analyzed using a two-sided unpaired Student’s t-test, with exact P values indicated. g Flow cytometry histogram and quantification of Ki-67 expression in WT and XPC⁻/⁻ Th17 cells, shown as mean ± SEM (n = 3 technical replicates) and analyzed using a two-sided unpaired Student’s t-test with exact P values indicated. h Flow cytometry analysis of CFSE dilution in WT and XPC⁻/⁻ Th17 cells showing proliferative capacity. Quantification represents the percentage of CFSE⁺ cells gated on live CD4⁺RORγt⁺ Th17 cells. WT samples are shown in yellow and XPC⁻/⁻ samples in purple. Data are presented as mean ± SEM (n = 3 technical replicates) and analyzed using a two-sided unpaired Student’s t-test with exact P values indicated. Data are representative of at least three independent experiments. Statistical significance is indicated as follows (*p < 0.05, **p < 0.01, ***p < 0.001).
Upon detailed examination of the altered genes within these pathways, a notable reduction in the expression of several genes associated with the NER pathway was observed, including Pcna, Lig1, Pole, and Ercc5 (Fig. 5e). Furthermore, downregulation extended to genes linked with cell cycle, p53 pathway, and cellular senescence. Conversely, genes associated with resistance to apoptosis, such as Bcl2a1d and Bcl2a1b, exhibited upregulation in the absence of XPC (Supplementary Fig. 2A). The absence of XPC in Th17 cells is associated with the downregulation of genes associated with various metabolic pathways, such as Dgat1 and Ldha, while showing an upregulation of genes like Mgdt2 and Pd5a, which are associated with oxidative stress (Fig. 5e) and (Supplementary Fig. 2B–G). Consistent with these findings, flow cytometry showed less Annexin V–positive cells in XPC-deficient Th17 cells. Moreover, Ki-67 expression was reduced despite comparable CFSE dilution between WT and XPC-/- cultures, indicating attenuated cell-cycle activity without detectable differences in cumulative divisions (Fig. 5f–h).
Taken together, these data suggest that XPC sustains transcriptional programs for DNA repair/replication and cell-cycle progression in Th17 cells while restraining stress- and oxidative-response pathways.
XPC-deficient Th17 accumulated DNA damage
Given the crucial role of XPC in DNA repair, we hypothesized that its absence might lead to increased DNA damage in Th17 cells, resulting in genomic instability and compromising their differentiation.
In order to understand if Th17 cells accumulates DNA damage in the absence of XPC, we cultured WT and naïve XPC-deficient CD4+ T cells under Th17 cells polarizing conditions and measured DNA damage by the expression of the phosphorylated H2AX (γH2AX) and comet assay. Our findings indicated elevated levels of γH2AX and increased DNA damage in XPC-deficient Th17 cells when compared to WT cells (Fig. 6a–c). In addition, alkaline comet assay indicates increased DNA strand breaks as well as increased levels of formamidopyrimidine DNA glycosylase (FPG) sites, which suggest accumulation of oxidized bases in XPC-deficient Th17 cells (Fig. 6d, e).

a Flow cytometry histogram showing γH2AX expression in CD4⁺IL-17A⁺ Th17 cells from WT and XPC⁻/⁻ conditions, with mean fluorescence intensity (MFI) values indicated. b–c Quantification of CD4⁺IL-17A⁺γH2AX⁺ cells and γH2AX expression (MFI) in WT and XPC⁻/⁻ Th17 cells (n = 3 technical replicates). Data are presented as mean ± SEM and analyzed using two-sided unpaired Student’s t-tests with exact P values indicated. d Representative comet assay images showing DNA damage in CD4⁺ T cells from WT and XPC⁻/⁻ conditions. e Quantification of tail moment in the comet assay for CD4⁺ T cells treated with or without formamidopyrimidine DNA glycosylase (FPG) to assess oxidative DNA damage (n = 5 technical replicates). Data are shown as mean ± SEM and analyzed using a two-sided unpaired Student’s t-test with exact P values indicated. f Heatmap showing Z-score–normalized expression of genes involved in DNA damage sensing and checkpoint signaling in WT and XPC⁻/⁻ Th17 cells, calculated per gene across samples. g Flow cytometry histograms showing γH2AX expression in WT and XPC⁻/⁻ Th17 cells following ATR (VE-821) or ATM (KU-55933) inhibition. h–k Quantification of γH2AX and RORγt expression (MFI) and frequency of CD4⁺IL-17A⁺ Th17 cells following ATR or ATM inhibition in WT and XPC⁻/⁻ conditions (n = 3 technical replicates). Data are presented as mean ± SEM and analyzed using two-sided unpaired Student’s t-tests with exact P values indicated. l Quantification of viable and dead cells following checkpoint inhibition in WT and XPC⁻/⁻ Th17 cells treated with KU-55933 (n = 3 technical replicates). Data are shown as mean ± SEM and analyzed using a two-sided unpaired Student’s t-test with exact P values indicated. WT samples are shown in black and XPC⁻/⁻ samples in purple. Data are representative of at least three independent experiments unless otherwise indicated. Statistical significance is indicated as follows (*p < 0.05, **p < 0.01, ***p < 0.001).
Following the observation of increased γH2AX in XPC-deficient Th17 cells (Fig. 6a–e), we next investigated how the DNA damage response (DDR) network is transcriptionally modulated in the absence of XPC. Bulk RNA-seq analysis revealed a broad downregulation of genes involved in DNA-damage sensing and checkpoint activation, including Atr, Atm, Topbp1, Etaa1, Mre11a, Rad50, and Nbn, as well as transducers and cell-cycle regulators such as Chek1, Chek2, Cdc25a, Clspn, Hus1, Rad9a, and Rad1. Downstream effector genes associated with p53 signaling and DNA repair, including Trp53, Cdkn1a, Gadd45a, and Gadd45b, were also significantly reduced (Fig. 6f).
To determine whether ATR and ATM signaling contribute to the elevated levels of γH2AX observed in XPC-deficient cells, we pharmacologically inhibited each kinase using VE-821 and KU-55933, respectively. Both treatments led to a further increase in γH2AX intensity in XPC-deficient Th17 cells, suggesting that in the absence of XPC, ATM/ATR inhibition exacerbates unresolved DNA lesions rather than alleviating them (Fig. 6g, h). Despite this, blockage of ATR or ATM signaling resulted in increased IL-17A and RORγt expression in XPC-deficient Th17 cells, partially restoring the Th17 effector phenotype (Fig. 6i,–k). This indicates that while ATR and ATM activation restrain Th17 differentiation under conditions of DNA damage, their transient inhibition can relieve this checkpoint-mediated suppression and permit partial reactivation of the lineage program. Cell viability was unaffected by these treatments, with comparable frequencies of live cells across all conditions, although a modest reduction in cell death was observed following KU-55933 exposure in XPC-deficient cultures (Fig. 6l).
Collectively, these findings demonstrate that loss of XPC leads to the accumulation of oxidative DNA lesions and the downregulation of key DDR components. Under these conditions, ATR/ATM inhibition further enhances DNA-damage accumulation but simultaneously alleviates checkpoint-driven suppression of Th17 differentiation.
XPC deficiency impairs mitochondrial function, increases oxidative stress, and disrupts DNA repair in Th17 cells
Given the marked increase in DNA damage observed in XPC-deficient Th17 cells, we next investigated whether the absence of XPC affects the transcriptional and metabolic programs controlling redox homeostasis. Transcriptomic profiling revealed extensive reprogramming of genes associated with antioxidant defense, energy metabolism, and oxidative stress response. Glycolytic enzymes such as Hk1, Hk2, Pfkl and Ldha were downregulated, whereas genes involved in oxidative phosphorylation, including Nudfa9, Ndufv1, Sdhd and Cox5b were upregulated. In parallel, genes encoding antioxidant response, such as Gpx1, Prdx1, Txn1, Txn2, were decreased, while there was an increase in genes involved in oxidative stress response such as Nfe2l2, Hspa1b, Hspa5, Hsp90aa1, Atf6, Sesn1, Sesn3, suggesting activation of compensatory oxidative-stress defenses in the absence of XPC (Fig. 7a).

a Heatmap showing differentially expressed genes involved in antioxidant defense, glycolysis, oxidative phosphorylation, and oxidative stress responses in WT and XPC⁻/⁻ Th17 cells, displayed as Z-score–normalized values calculated per gene across samples. b–c Seahorse analysis of extracellular acidification rate (ECAR) and oxygen consumption rate (OCR) in WT and XPC⁻/⁻ Th17 cells, including glycolytic rate, glycolytic reserve, basal respiration, maximal respiration, and proton leak (n = 10 technical replicates). Data are presented as mean ± SEM and analyzed using two-sided unpaired Student’s t-tests with exact P values indicated. d–e Flow cytometric analysis and quantification of mitochondrial membrane potential (MitoTracker Deep Red), mitochondrial mass (MitoTracker Green), and mitochondrial reactive oxygen species (MitoSOX) in WT and XPC⁻/⁻ Th17 cells (n = 3 technical replicates). Data are shown as mean ± SEM and analyzed using two-sided unpaired Student’s t-tests with exact P values indicated. f Representative confocal microscopy images of WT and XPC⁻/⁻ Th17 cells stained with MitoSOX and DAPI. Scale bar as indicated. g Flow cytometric quantification of IL-17A⁺ CD4⁺ T cells and γH2AX expression (MFI) following N-acetylcysteine (NAC) treatment in WT and XPC⁻/⁻ Th17 cultures (n = 5 technical replicates). Data are presented as mean ± SEM and analyzed using a two-sided one-way ANOVA followed by Tukey’s multiple-comparisons post hoc test, with exact P values indicated. h Co-immunoprecipitation analysis showing interaction between XPC and OGG1 proteins in Th17 cell lysates, with representative immunoblots shown. i–k Protein–protein interaction network generated by STRING analysis and molecular docking simulations illustrating predicted functional associations and the interaction interface between XPC and OGG1. l Representative OGG1 incision assay using nuclear extracts from WT and XPC⁻/⁻ Th17 cells, with quantification of cleavage activity expressed as percentage of incision (n = 3 technical replicates). Colors indicate cell subsets or genotypes as labeled in each panel. Data are shown as mean ± SEM and analyzed using a two-sided unpaired Student’s t-test with exact P values indicated. Data are representative of at least three independent experiments unless otherwise indicated. Statistical significance is indicated as follows (*p < 0.05, **p < 0.01, ***p < 0.001).
Given the transcriptional enrichment of mitochondrial and redox pathways, we next examined the metabolic profile of Th17 cells using Seahorse extracellular flux analysis. XPC-deficient Th17 cells exhibited markedly reduced glycolytic capacity, glycolytic reserve, and non-glycolytic acidification compared to WT cells (Fig. 7b), indicating impaired glycolytic flux. Oxygen consumption rate (OCR) analysis showed comparable basal respiration between groups, but a significant decrease in maximal respiratory capacity and a marked increase in proton leak in XPC-deficient cells (Fig. 7c). Together, these findings demonstrate that loss of XPC leads to mitochondrial dysfunction and reduced bioenergetic efficiency, rather than a metabolic shift toward oxidative phosphorylation.
Flow-cytometry analysis revealed increased MitoSOX fluorescence, confirming higher mitochondrial superoxide levels in XPC-deficient cells. In parallel, staining with MitoTracker Deep Red and MitoTracker Green showed preserved mitochondrial mass but increased mitochondrial membrane potential, indicative of hyperpolarized and metabolically active mitochondria (Fig. 7d, e). Confocal microscopy corroborated these findings, revealing an accumulation of MitoSOX signal in XPC-deficient Th17 cells (Fig. 7f). Moreover, BATF-deficient Th17 cells exhibited a phenotype resembling that of XPC-deficient Th17 cells, characterized by elevated levels of mitochondrial ROS and increased DNA damage (Supplementary Fig. 3A–D).
To determine whether oxidative stress contributes causally to the Th17 defect in the absence of XPC, we treated the cultures with the antioxidant N-acetylcysteine (NAC). NAC treatment markedly restored IL-17A production (Fig. 7g) and pSTAT3 activation, and RORγt expression in XPC-deficient Th17 cells (Supplementary Fig. 4A, B). In addition, NAC decreased γH2AX levels in both WT and XPC-deficient cells (Fig. 7g), linking oxidative damage to the accumulation of DNA breaks and impaired Th17 differentiation. These results demonstrate that redox imbalance represents a major driver of the differentiation defect observed in the absence of XPC.
Because the comet assay incorporating FPG in Fig. 6d, e indicated an accumulation of oxidized bases in XPC-deficient Th17 cells, we next investigated whether XPC interacts with base-excision repair (BER) enzymes, which are responsible for repairing such lesions. Prior studies have shown a functional association between XPC and OGG118, the DNA glycosylase that removes 8-oxo-7,8-dihydroguanine (8-oxoG) and initiates BER of oxidative DNA damage. Co-immunoprecipitation experiments confirmed a physical interaction between XPC and OGG1 in Th17 cells (Fig. 7h). Protein–protein network analysis using STRING further positioned XPC and OGG1 within a BER-associated cluster that includes PARP1, APEX1, AND POLΒ (Fig. 7i). To elucidate the structural basis of this interaction, protein–protein docking simulations were performed using the ClusPro and HADDOCK 2.4 servers, guided by the interaction partners identified in the network analysis. Two interaction configurations were explored: a scaffolded OGG1–XPA–XPC complex and a direct OGG1–XPC complex. Docking simulations yielded Z-scores of 1.68 and 2.03 for OGG1–XPA and OGG1–XPC, respectively, consistent with moderate-to-high confidence interaction scores predicted by STRING (0.53 for OGG1–XPC). Energetic decomposition analysis using PPCheck indicated that the direct OGG1–XPC complex displays a large buried surface area (>1400 Ų) and a favorable solvation free energy (ΔiG = −19.7 kcal/mol), corresponding to a total stabilizing energy of approximately −54 kJ/mol, primarily driven by van der Waals and electrostatic forces (Fig. 7j). Structural mapping revealed that the OGG1–XPC interface is distinct from the canonical β-hairpin DNA-binding domains (BHD1–3) of XPC that mediate lesion recognition. Instead, OGG1 interacts with α-helical regions located in the central domain of XPC through a network of salt bridges and hydrophobic contacts. Salt bridges were observed between Asp81 and Asp82 of OGG1 and Arg851 of XPC, while hydrophobic interactions were formed between Leu2, Ala21, and Val85 of OGG1 and aliphatic residues within XPC’s α-helical surface. Additional stabilizing contacts included interactions between Lys126 and Lys284 of OGG1 and Glu196 and Glu271 of XPC, as well as aromatic stacking between Tyr279 of OGG1 and Phe193 of XPC (Fig. 7k).
Finally, OGG1 activity was quantified using a duplex oligonucleotide incision assay in which nuclear extracts from in-vitro–polarized Th17 cells (WT or XPC-deficient) were incubated with a 5′-FITC–labeled 30-mer double-stranded oligonucleotide bearing a single 8-oxoG lesion at position 11. Representative gels show a stronger cleaved-product band in extracts from XPC-deficient Th17 cells compared with WT, and quantification across biological replicates confirms a significant increase in incision activity in XPC-deficient Th17 cells (Fig. 7l). These data indicate that BER is functionally upregulated at the OGG1 step in the absence of XPC.
Together, these results demonstrate that XPC integrates redox control and DNA repair during Th17 differentiation. In the absence of XPC, Th17 cells display reduced glycolytic activity and a compensatory dependence on mitochondrial respiration, which is characterized by elevated ROS generation and oxidative DNA lesions. This heightened oxidative burden, together with the loss of XPC–OGG1 coordination in base excision repair, uncouples oxidative stress signaling from effective DNA repair, thereby constraining Th17 differentiation.