
Ethics statement
All animal experiments were approved by the Institutional Animal Care and Use Committee of the Weizmann Institute of Science and were performed in accordance with institutional guidelines and relevant regulations (nos. 03240524-2 and 02480226-2). Human ileal organoid lines used in this study were derived from distal ileal biopsies obtained with written informed consent under protocols approved by the Committee on Research Involving Human Subjects application 0921-20-HMO (The Israeli Organoid Bank – A Means for Personalized Medicine) and the Weizmann Institute of Science Institutional Review Board. All experiments were performed in accordance with relevant ethical regulations.
Mice
Mice were housed under specific-pathogen-free conditions at the animal facilities at the Weizmann Institute of Science, Rehovot, Israel. Mice were fed a normal chow diet and, maintained under a strict 12-h light–dark cycle, with lights on at 6:00 and off at 18:00. C57BL/6J WT mice were purchased from Envigo. The following strains were obtained from The Jackson Laboratory: Lgr5-eGFP-IRES-CreERT2 (strain B6.129P2-Lgr5tm1(cre/ERT2)Cle/J; stock no. 008875), Vil1-CreERT2 (strain B6.Cg-Tg(Vil1-cre/ERT2)23Syr/J; stock no. 020282), Rosa26LSL-tdTomato (strain B6.Cg-Gt(ROSA)26Sortm14(CAG-tdTomato)Hze/J; stock no, 007914), and TKO (strain B6.129S-Rag2tm1Fwa Cd47tm1Fpl Il2rgtm1Wjl/J; stock no. 025730). Lgr5-2A-eGFP reporter mice and Lgr5-2A-CreERT2 mice were gifts from Nick Barker and were described previously97. For lineage-tracing experiments, Lgr5-2A-CreERT2 mice were crossed to the Rosa26LSL-tdTomato strain. PycardΔISC+dTom mice were generated by crossing Pycardloxp (Pycardflox/flox) mice98 with Lgr5-2A-CreERT2; Rosa26LSL-tdTomato mice. Lgr5-eGFP-IRES-CreERT2; Pycardflox/flox mice were generated by crossing Pycardloxp with Lgr5-eGFP-IRES-CreERT2 and Vil1-CreERT2; Pycardflox/flox mice were generated by crossing Vil1-CreERT2 with Pycardloxp, to investigate the role of the inflammasome in epthelial cells. Male and female age-matched mice aged 7–14 weeks were used for all experiments in this study. Littermates of the same genotype and age were randomly assigned to experimental groups.
Mice infection
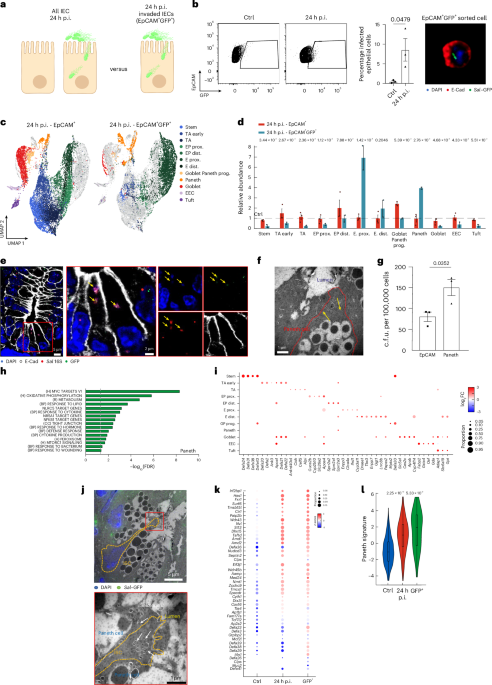
S. Tm (SL1344 strain) expressing GFP (or RFP, as indicated) was grown overnight at 37 °C in Luria-Bertani (LB) medium with shaking (200 rpm). The following morning, cultures were diluted 1:20 in fresh LB and subcultured for 4 h under the same shaking conditions to reach log-phase growth. Bacteria were pelleted, washed once with phosphate-buffered saline (PBS), and resuspended at the desired concentration for gavage or in vitro infections. Mice were deprived of food and water 4 h before infection. Gavage was performed in a volume of 100 μl containing either 5 × 10⁸ c.f.u. of Salmonella strain SL1344 or PBS (as control). Mice were killed by CO2, 12, 24, 72 or 144 h post-infection.
L. monocytogenes (10403S WT strain) was grown overnight at 37 °C in brain–heart infusion (BHI) medium with shaking (200 rpm). The following morning, cultures were diluted 1:20 in fresh BHI and subcultured for 4 h under the same shaking conditions to reach log-phase growth. Bacteria were pelleted, washed once with PBS and resuspended at the desired concentration for gavage infections. Mice were deprived of food and water 4 h before infection. Gavage was performed in a volume of 100 μl containing either 5 × 10⁹ c.f.u. of Listeria strain 10403S or PBS (as control). Mice were killed by CO2, 24 h p.i.
For all mice, ileal crypts were isolated from the small intestine as described below and used for subsequent experiments. The c.f.u. number was evaluated by plating serial tenfold dilutions of homogenized crypts or IECs on selective streptomycin (50 μg ml−1) or ampicillin (100 µg ml−1) agar plates.
Lineage tracing and scPulse sequencing
To label Lgr5+ ISCs and their following progeny for in vivo lineage tracing, we administered one intraperitoneal injection of tamoxifen (2 mg per 20 g body weight) to induce Cre-mediated excision of a stop codon and subsequent expression of tdTomato from the Rosa26 locus. This injection occurred as soon as the mice received oral S. Tm or PBS control.
Pycard deletion in intestinal epithelial cells
To study the role of the inflammasome in epithelial stem cells, we used multiple mouse models for conditional deletion of Pycard (encoding ASC). In Lgr5-eGFP-IRES-CreERT2; Pycardflox/flox mice, Cre recombination was induced by intraperitoneal injection of tamoxifen (2 mg per injection, five times every other day) in 7–10-week-old animals. Due to mosaic Cre activity in this model, Pycard deletion occurred in approximately 20–30% of crypts.
For broader epithelial deletion, Vil1-CreERT2; Pycardflox/flox mice were treated identically.
In experiments combining lineage tracing and inflammasome deletion, Lgr5-2A-CreERT2; Rosa26LSL-tdTomato; Pycardflox/flox mice were used and injected with tamoxifen at the time of infection or control gavage.
Bacterial strains
All S. Tm (SL1344) strains used in this study were derived from the WT SL1344 background. Fluorescent strains were generated using pFPV25.1 (Addgene) expressing constitutive GFP or a pFPV-derived plasmid expressing constitutive mCherry. Both plasmids carry an ampicillin resistance cassette and were maintained under selective pressure. Salmonella–GFP and Salmonella–RFP strains were generously provided by R. Avraham (Weizmann Institute of Science). ΔorgA/ΔssaV SL1344 mutant strain (ΔSPI-1/SPI-2) was a generous gift from D. Monack (Stanford)99,100.
Epithelial cell dissociation and crypt isolation
For all mice, crypts were isolated from the distal part of the small intestine. The small intestine was extracted and rinsed in cold PBS. The tissue was opened longitudinally and sliced into small fragments roughly 2-mm long followed by incubation with 20 mM EDTA-PBS on ice for 75 min. Then, the tissue was shaken vigorously, and the supernatant was collected as fraction 1 in a new conical tube. The tissue was incubated in fresh PBS, and a new fraction was collected every 5 min. Fractions were collected until the supernatant consisted almost entirely of crypts. The fractions 3–4 (enriched for crypts) were filtered through a 70-µm filter, centrifuged at 400g for 5 min, and dissociated with TrypLE Express (Gibco) for 1 min and 30 s at 37 °C. The single-cell suspension was then passed through a 40-μm filter and stained with fluorescence-activated cell sorting (FACS) antibodies and sorted with SH800 Sony sorter for subsequent analysis. To ensure that only intracellular Salmonella were analyzed and to exclude surface-attached bacteria, all buffers used from the point of trypsin digestion through to cell sorting, including washing, staining, and FACS buffers, contained 50 µg ml−1 gentamicin. This antibiotic treatment eliminates extracellular bacteria without affecting internalized GFP-labeled Salmonella, allowing for specific enrichment of truly invaded epithelial cells (EpCAM+GFP+).
Organoid regeneration assay
To evaluate the regenerative capacity of stem and Paneth-lineage cells following infection, we sorted 1,000 cells per condition into 96-well plates and monitored organoid formation. Lgr5–GFP mice or Lgr5–CreERT2 × Rosa26LSL-tdTomato mice were infected with Salmonella or given PBS (see above, ‘Mice infection’). In lineage-tracing experiments, tamoxifen (2 mg per 20 g) was administered at the time of infection. Crypts were isolated 24 h post-infection (see above, ‘Crypt isolation’), dissociated into single cells, and sorted for either Lgr5+ ISCs (GFP+) or Paneth-lineage cells (tdTomato+CD24+SSChigh). Sorted cells were embedded in 5 µl Matrigel containing Jagged-1 peptide (1 µM) and overlaid with 600 µl of culture medium (Advanced DMEM/F12 with streptomycin–penicillin, GlutaMAX, EGF (100 ng ml−1), R-spondin-1 (600 ng ml−1), Noggin (100 ng ml−1), Wnt3A (100 ng ml−1), Y-27632 (10 µM), NAC (1 mM), N2 (1×) and B27 (1×)). Organoids were counted at 96 h using bright-field microscopy. Experiments were performed in two biological replicates.
Flow cytometry analysis
Single-cell suspensions were prepared as described above. Epithelial cells were stained with EpCAM (BioLegend cat. no. 118218, RRID:AB_2098648 and BioLegend cat. no. 324246, RRID:AB_2783194), CD45 (BioLegend cat. no. 103177, RRID:AB_2876405), CD24 (BioLegend cat. no. 101814, RRID:AB_439716 or BioLegend cat. no. 311117, RRID:AB_1877150), I-A/I-E (BioLegend cat. no. 107607, RRID:AB_313322), Lyz1 (Agilent cat. no. EC 3.2.1.17, RRID:AB_2341231) and DAPI-NucBlue (Thermo Fisher, cat. no. R37605) for 30 min on ice. Analysis was conducted on a Cytoflex analyzer or Sony sorter. Further analysis of the data was conducted using FlowJo v.10.1.
Cell sorting
For the bulk population, FACS (SH800 Sony) was used to sort 1,000–5,000 cells into an Eppendorf tube containing 50 μl TCL buffer (QIAGEN) solution with 1% 2-β-mercaptoethanol (Sigma-Aldrich). To enrich for the Lgr5+ ISC population, cells were isolated from Lgr5–EGFP–CreERT2 mice, stained with the DAPI-NucBlue, anti-CD45, anti-EpCAM and anti-CD24 and gated for EpCAM+CD45− (IECs), EpCAM+CD45−GFPhigh (Lgr5+ ISCs) or EpCAM+CD45−CD24+SSChigh (Paneth cells). Lineage-traced cells were identified based on endogenous tdTomato fluorescence. Cells were gated for EpCAM+CD45−tdTomato+. For cDNA production, the tubes were centrifuged and immediately frozen on dry ice and kept at −80 °C until ready for the RNA isolation. For scRNA-seq, the cells were treated as described below.
Hash-tagged scRNA-seq
The scRNA-seq libraries were prepared using the chromium single-cell RNA-seq platform (10x genomics). Isolated IECs were sorted into a cooled 15-ml tube with 0.04% BSA in PBS using a Sony SH800 cell sorter. Cells for each condition or mouse were stained using biotin anti-mouse CD326 (EpCAM) antibody (BioLegend cat. no. 118204, RRID:AB_1134178) followed by staining using TotalSeq PE streptavidin (B0951–B0955). Then, 20,000 cells were sorted for each mouse or condition and pooled following the manufacturer’s instructions. A 30,000 single-cell suspension was loaded onto Next GEM Chip G, targeting 15,000 cells and then ran on a Chromium Controller instrument to generate GEM emulsion. Single-cell 3′ RNA-seq libraries and cell-surface protein libraries were generated according to the manufacturer’s protocol (Chromium Single Cell 3′ Reagent kits User Guide (v.3.1 Chemistry Dual Index). Final libraries were quantified using NEBNext Library Quant kit for Illumina (NEB) and high sensitivity D5000/D1000 TapeStation (Agilent). Libraries were pooled according to targeted cell number, aiming for ~20,000 reads per cell for gene expression libraries and ~5,000 reads per cell for cell surface protein libraries. Pooled libraries were sequenced on a NovaSeq 6000 instrument using an S1 100 cycles reagent kit (Illumina).
Bulk population RNA purification and cDNA preparation
Libraries were prepared using a modified SMART-seq2 protocol101. RNA lysate cleanup was performed using RNAClean XP beads (Agencourt), followed by reverse transcription with Maxima Reverse Transcriptase (Life Technologies) and whole transcription amplification (WTA) with KAPA HotStart HIFI 2 3 ReadyMix (Kapa Biosystems) for 18 cycles. WTA products were purified with Ampure XP beads (Beckman Coulter), quantified with Qubit dsDNA HS Assay kit (Thermo Fisher). The products were diluted into a concentration of 1 ng μl−1 in ultrapure water.
Quantitative PCR
For qPCR, complementary DNA from bulk population libraries were diluted to a final concentration of 0.05 ng μl−1. Fast SYBR green master mix (Thermo Fisher Scientific) was used to perform quantitative PCR with reverse transcription (qRT–PCR) as per the manufacturer’s instructions.
The primer sequences used were: mLgr5 forward: 5′–GACAATGCTCTCACAGAC–3′; mLgr5 reverse: 5′–GGAGTGGATTCTATTATTATGG–3′; mSmoc2 forward: 5′–GGAGCAGGGAAAGCAGATGAT–3′; mSmoc2 reverse: 5′–GGTCTTGTTCTGCCGACTCT–3′; mOlfm4 forward: 5′–CACAGCTCACATCCTTTCTCAG–3′; mOlfm4 reverse: 5′–ACTCGGACCGTCAGGTTCAG–3′; mLyz1 forward: 5′–CAAAGAGGGTGGTGAGAGATC–3′; mLyz1 reverse: 5′–TGAGAAAGAGACAGAATGGGC–3′; mMptx2 forward: 5′–CTCTCTGTTCTTTCAGGAAGTGTAGC–3′; mMptx2 reverse: 5′–ACACATAGGCAGTGGATGATTCTT–3′; mPycard forward: 5′–TGCTTAGAGACATGGGCTTAC–3′; mPycard reverse: 5′–CAATGAGTGCTTGCCTGTG–3′; mUbc forward: 5′–AACATCCAGAAAGAGTCCACC–3′; mUbc reverse: 5′–CATTCTCTATGGTGTCACTGGG–3′; hPycard forward: 5′–TCACCGCTAACGTGCTG–3′; hPycard reverse: 5′–TGGTCTATAAAGTGCAGGCC–3′; hHRPT forward: 5′–TGACACTGGCAAAACAATGCA–3′; hHRPT reverse: 5′–GGTCCTTTTCACCAGCAAGCT–3′.
Data analysis was performed with QuantStudio 12K flex software (Thermo Fisher Scientific) based on the ΔΔCT method. All target genes were standardized to endogenous reference gene Ubiquitin C (UBC) or HPRT.
Histochemistry
Tissues were fixed for 16–24 h in formalin, embedded in paraffin and cut into 5-μm thick sections. Sections were deparaffinized with standard techniques. For hematoxylin and eosin (H&E) staining, slides were stained with hematoxylin for 1 min, washed, stained with Eosin for 45 s. For PAS and Alcian blue staining, tissue was stained with an Alcian blue and PAS reagents kit (ScyTek Laboratories, cat no. APS-1) on deparaffinized slides with standard techniques, using 3% acetic acid for 3 min, then Alcian blue solution (Alcian blue, pH 2.5) for 30 min, rinsed in tap water for 5 min, and oxidized in periodic acid (0.5%) for 10 min, followed by rinsed in running tap water for 5 min, and stained in Schiff reagent as a counterstain (cancer diagnostics) for 10 min. Nuclei were stained with PureView Mayers hematoxylin for 50 s. All slides were washed, dehydrated and mounted with Sub-x mounting medium (Leica).
Immunofluorescence
Sections were deparaffinized with standard techniques and incubated with primary antibodies overnight at 4 °C, followed by secondary antibodies incubation at room temperature for 45 min. All slides were mounted with Slowfade Mountant + DAPI (Life Technologies, S36964) and sealed. Antibodies used for immunofluorescence were mouse anti-E-cadherin (1:100 dilution, BD Biosciences cat. no. 610182, RRID:AB_397581), rabbit anti-Olfm4 (1:200 dilution, Cell Signaling Technology cat. no. 39141, RRID:AB_2650511), rat anti-Ki67 (1:100 dilution, Thermo Fisher Scientific cat. no. 14-5698-82, RRID:AB_10854564), rat anti-lysozyme (1:200 dilution, Agilent cat. no. EC 3.2.1.17, RRID:AB_2341231), rabbit anti-cleaved-caspase 3 (1:100 dilution, Cell Signaling Technology cat. no. 9661, RRID:AB_2341188), rabbit anti-GFP (1:100 dilution, Cell Signaling Technology cat. no. 2956, RRID:AB_1196615), rabbit anti-RFP (1:100 dilution, Rockland cat. no. 600-401-379, RRID:AB_2209751) and Alexa Fluor 488-, 568- and 647-conjugated secondary antibodies (1:400 dilution, Abcam).
TUNEL assay
Small intestine tissue was analyzed for TUNEL staining by the TUNEL Assay kit (Abcam cat no. ab66110) according to the manufacturer’s recommendations. In brief, sections were deparaffinized followed by antigen retrieval, labeled with 5-bromo-2′-deoxyuridine (BrdU) for 1 h at 37 °C, and incubated with anti-BrdU-Red for 30 min at room temperature. After TUNEL labeling, the sections were stained with E-cadherin antibody then washed and mounted with Slowfade Mountant + DAPI. Measurement and analysis of the staining area was performed using Zen software (Zeiss).
Single-molecule fluorescence in situ hybridization
A RNAScope Multiplex Fluorescent kit (Advanced Cell Diagnostics) was used as per the manufacturer’s recommendations with the following alterations. The target retrieval boiling time was adjusted to 14 min and incubation with Protease IV at 40 °C was adjusted to 8 min. Slides were mounted with Slowfade Mountant + DAPI and sealed. Probes used for single-molecule RNAscope (Advanced Cell Diagnostics): S. Tm-16S rRNA-O1 (C1) and Lgr5 (C2).
Combined immunofluorescence and smFISH
Following the Amp 4 step of the smFISH protocol as described above, tissue sections were washed and incubated overnight at 4 °C with primary antibodies, washed three times in 1× TBST, and then incubated with secondary antibodies for 45 min at room temperature. Slides were then mounted with Slowfade Mountant + DAPI and sealed.
Image analysis
Images of tissue sections were taken with a confocal microscope LSM900 confocal microscope (Zeiss). Scale bars were added to each image using the confocal Zen analysis software (Zeiss). Images were overlaid and visualized using Zen analysis software (Zeiss). Organoids and single-cell suspension were imaged using bright-field optical microscopy (EVOS M5000 Imaging System) and analyzed with Fiji software.
Image quantification
Quantification of IFA images of all tissues were assessed by staining for E-cadherin to mark cell borders and DAPI staining for nucleus visualization. Cells were manually counted based on immunofluorescence staining specific to each cell type. Stem cells were quantified using the ISC marker Olfm4 within the ‘stem cell zone’ at the bottom of the crypt, delineated by a dashed line, with quantification restricted to this area. Paneth cells were similarly quantified using Lyz1 as the marker. Proliferative cells (Ki67+) were counted along the villus–crypt axis. For each quantification, at least 15 intact and longitudinally oriented crypts per tissue section were analyzed.
Transmission electron microscopy
Samples were fixed in 4% paraformaldehyde with 0.1% glutaraldehyde in 0.1 M cacodylate buffer (pH 7.4) for 1 h at room temperature and kept overnight at 4 °C. The samples were soaked overnight in 2.3 M sucrose and rapidly frozen in liquid nitrogen. Frozen ultrathin (70–90 nm) sections were cut with a diamond knife at −120 °C on a Leica EM UC7 ultramicrotome. The sections were collected on 200-mesh Formvar coated nickel grids. Sections were blocked with a solution containing 1% BSA, 0.1% glycine, 0.1% gelatin and 1% Tween 20. Contrast staining and embedding were performed as previously described (Tokuyasu, 1986). The embedded sections were viewed and photographed with a Tecnai SPIRIT transmission electron microscope (Thermo Fisher Scientific). Digital electron micrographs were acquired with a bottom-mounted Gatan OneView camera.
Correlative light and electron microscopy
Wide-field fluorescence images of the thin sections on fresh sliced TEM grids (before contrast staining) were taken using VUTARA SR352 system (Bruker) with 1.3 NA ×60 silicon oil immersion objective (Olympus). Z-slices of 150 nm were collected using 405 nm and 488 nm excitation lasers in the presence of a buffer containing 7 μM glucose oxidase (Sigma), 56 nM catalase (Sigma), 2 mM cysteamine (Sigma), 50 mM Tris, 10 mM NaCl and 10% glucose, pH 8.
Contrast staining and embedding were performed as previously described (Tokuyasu, 1986). The embedded sections were viewed and photographed with a FEI Tecnai SPIRIT transmission electron microscope (Thermo Fisher Scientific). Digital electron micrographs were acquired with a bottom-mounted Gatan OneView camera. Overlay TEM and fluorescence images was done using nuclei marked with DAPI as fiducial markers using Photoshop.
In vitro infection of mouse small intestine crypts
Small intestine crypts were isolated from 7–14-week-old WT C57BL/6J, Lgr5-CreERT2-EGFP or PycardΔISC mice. After two PBS washes (300g for 5 min at 4 °C), crypts were resuspended at 500 crypts in 500 µl of L-WRN73 conditioned medium (CM) supplemented with 10 µM Y-27632 (Biogems, 1293823). Crypt number was estimated by bright-field microscopy (EVOS M5000 Imaging System).
Salmonella was washed once in PBS and diluted to 108 c.f.u. ml−1 (plate-verified). Then, 5 μl of this suspension was added to the crypt suspension (MOI = 10; 5.105 c.f.u. per 500 crypts). Tubes were incubated for 2 h at 37 °C in 5% CO2 incubator in static condition, providing direct apical exposure.
Infected crypts were pelleted (300g for 5 min at 4 °C), resuspended in 500 µl of the L-WRN CM containing 100 µg ml−1 gentamicin and incubated 30 min at 37 °C to eliminate remaining extracellular bacteria. Crypts were pelleted and washed three times with pre-warmed L-WNR containing 100 µg ml−1 gentamicin. The final pellet was mixed with 20 µl ice-cold Matrigel containing 1 µM Jagged-1 peptide (Ana-Spec, AS-65155) and plated as a dome in a prewarmed 24-well plate. After polymerization (20 min, 37 °C), each dome was overlaid with 500 µl organoid differentiation medium (Advanced DMEM/F12 with streptomycin–penicillin, 1× GlutaMAX, EGF (100 ng ml−1), R-spondin-1 (600 ng ml−1), Noggin (100 ng ml−1), Wnt3A (100 ng ml−1), Y-27632 (10 µM), NAC (1 mM), N2 (1×) and B27 (1×)). Where indicated, 20 µM Z-VAD-FMK (10 μg ml−1, Selleck, S7023) was included.
Supernatants were collected at 2, 12 and 24 h post-embedding for IL-1R and IL-18 activity (HEK-Blue IL-1R and HEK-Blue IL-18, InvivoGen). Matrigel domes were collected and processed for RNA extraction, flow cytometry or intracellular c.f.u. enumeration.
Heat-killed
The same concentration of HK bacteria was prepared by centrifuging bacteria and wash in PBS, followed by incubation at 95 °C for 30 min in the desired concentration in PBS. A sample of HK Salmonella was seeded onto LB agar plates with streptomycin to confirm bacterial killing.
c.f.u. evaluation
Cells or organoids were collected and incubated in 100 μl DDW with 0.2% Triton X-100 (Sigma-Aldrich) to release intracellular bacteria. After 2 min of incubation, tubes were spun down, resuspended in 100 μl of PBS and each tube was plated on selective streptomycin (50 μg ml−1) or ampicillin (100 µg ml−1) agar plates. The plates were incubated overnight and the c.f.u. per condition were counted manually.
HEK-Blue IL-1R and IL-18 assays
IL-1R and IL-18 signaling activity was assessed using HEK-Blue IL-1R and HEK-Blue IL-18 cells (Invivogen, cat. no. hkb-il1r and cat. no. hkb-hmil18) according to the manufacturer’s protocol. HEK-Blue cells were cultured in DMEM supplemented with 10% heat-inactivated FBS and 100 µg ml−1 Normocin. Cell lines were cultured at 37 °C and 5% CO2 and routinely tested for Mycoplasma contamination using a MycoBlue Mycoplasma Detector kit (Vazyme Biotech, cat. no. D101-01). For the assay, the supernatant from organoids, Lgr5+ ISCs or Paneth cells was centrifuged at 1,000g for 5 min to eliminate cell debris. A 20 μl aliquot of the supernatant was added to 5 × 10⁴ HEK-Blue cells seeded in a 96-well plate. Complete medium, with or without recombinant interleukins (0.1–1,000 pg ml−1) (Peprotech, cat. no. 211-11B and Gibco cat. no. PMC0184), served as positive and negative controls, respectively. The following day, 20 μl of the HEK cell supernatant was transferred to a flat-bottom 96-well plate containing 180 μl of QuantiBlue (Invivogen, cat. no. rep-qbs) detection reagent and incubated at 37 °C for 2 h. IL-1R and IL-18 activity was measured using a spectrophotometer (Tecan) at 630 nm. Standard curves were performed using dilutions of murine interleukins (0.1–1,000 pg ml−1).
Infection of flow-sorted intestinal epithelial cell subsets
Intestinal epithelial single-cell suspensions were prepared from small intestine as described before. Cells were sorted on a Sony SH800 into ISCs (Lgr5–eGFPhigh) and Paneth cells (CD24+SSChi). Immediately after sorting, cells of each subset were pelleted (300g, 5 min at 4 °C) and resuspended in 250 µl L-WRN CM supplemented with 10 µM Y-27632. S. Tm SL1344 was added at MOI 10 and incubated for 2 h at 37 °C, 5 % CO2, static. Cells were pelleted (300g for 5 min at 4 °C), resuspended in 500 µl of the L-WRN CM containing 100 µg ml−1 of gentamicin and incubated 30 min at 37 °C to eliminate remaining extracellular bacteria. Cells were pelleted and washed three times with pre-warmed L-WRN containing 100 µg ml−1 gentamicin and finally resuspended in 200 µl L-WRN + Y-27632, and transferred to U-bottom 96-well plates for 12 or 24 h. Supernatants and cell pellets were collected as described for crypt infections.
Organoid imaging
TdTomato-expressing intestinal organoids were cultured in four-well ibidi µ-Slide glass-bottom chambers (ibidi). Infection was performed as described above, and organoids were imaged 24 h p.i. Before imaging, organoids were stained with Hoechst Blue (1 µg ml−1) for 5 min at room temperature, followed by a PBS wash. Imaging was performed using a Zeiss LSM900 confocal microscope with a ×20 objective. Z-stacks were acquired to capture the three-dimensional (3D) structure of the organoids. Videos were generated using Zen Blue analysis software (Zeiss), using the z-stack projection functions.
Human ileal organoid donors
Human ileal organoids used in this study were obtained from the Israeli Hadassah Organoid Center and were generated from distal ileal biopsies collected from two independent donors. Written informed consent was obtained from all donors or their legal guardians before biopsy collection and organoid derivation. Both donors were female, aged 1 year and 1 month and 11 years and 8 months, respectively. Donors were not compensated for participation. The collection and use of these samples were approved under protocol 0921-20-HMO (‘The Israeli Organoid Bank – A Means for Personalized Medicine’).
Human organoid assay
In brief, organoids were cultured in IntestiCult Organoid Growth Medium (Human, Stemcell, cat no. 06010) in 3D Matrigel in 24-well plates. In experiments requiring differentiation, IntestiCult Differentiation Medium was used (Human, Stemcell, cat no. 100-0214). Organoids were dissociated and infected with S. Tm for 2 h at 37 °C. After three washes with DMEM/F12 containing 100 µg ml−1 gentamicin, epithelial aggregates were embedded in 20 μl Matrigel (Corning) with 1 µM Jagged-1 peptide (Ana-Spec). After 20 min at 37 °C, the differentiation medium was added and incubated at 37 °C with 5% CO2 for the experiment.
Cells were treated at the time of infection with the indicated concentrations with the following inhibitors: 20 μM pan-caspase inhibitor Z-VAD(OMe)-FMK (SM Biochemicals; SMFMK001) and 30 μM VX-765 (Sigma).
For progenitor infection, after 2 days of growth in IntestiCult Orgnaoids Growth Media, organoids were dissociated using TrypLE Express (Gibco) for 1 min and 30 s at 37 °C. The single-cell suspension was then passed through a 40-μm filter and infected with S. Tm for 2 h at 37 °C in suspension. After three washes with DMEM/F12 containing 100 µg ml−1 gentamicin, cells were left in suspension in differentiation medium at 37 °C for 24 h.
Generation of human PYCARD knockout organoids
Human ileal organoids were engineered to delete PYCARD using CRISPR-Cas9, following the electroporation-based gene-editing workflow described by Martinez-Silgado et al.102 with minor adaptations. In brief, organoids were dissociated into single cells and transfected with the CRISPR-Cas9 plasmid pSpCas9(BB)-2A-GFP (PX458) encoding one of two guide RNAs targeting PYCARD: gRNA#1: GGTGAGGTCCAAGGCGTCCA gRNA#2: CATGTCGCGCAGCACGTTAG. Cells expressing GFP were enriched by flow cytometry 48 h post-transfection and replated at clonal density in Matrigel. Individual organoid clones were expanded and screened for PYCARD disruption by qPCR and genomic sequencing. Verified PYCARD−/− clones were maintained under standard culture conditions and used for downstream infection assays as described.
Proteomic sample preparation, LC–MS/MS acquisition and data processing
Paneth cells (EpCAM+CD24+SSChigh) were FACS sorted and infected as described above. At different time points, Paneth cells were FACS sorted directly into 0.2% N-dodecyl β-D-maltoside (DDM) 150 mM NaCl. The lysates were reduced with 6.25 mM dithiothreitol for 30 min followed by alkylation with 12.5 mM iodoacetamide in the dark for additional 30 min. Samples were then digested with 30 ng of trypsin for 4 h at 37 °C. The digested peptides were acidified with 0.1% TFA. Samples were then vacuum-dried, resuspended in 0.1% TFA and kept at −80 °C until analysis.
Liquid chromatography
Each sample was loaded using split-less nano-ultra performance liquid chromatography (nanoElute2, Bruker). The mobile phase was A) H2O + 0.1% formic acid and B) acetonitrile + 0.1% formic acid. The peptides were separated using a trap Pepmap Neo C18 column (300 μm internal diameter × 5 mm, Thermo scientific) and an Aurora column (75 μm internal diameter × 25 cm, IonOpticks) at 0.3 µl min−1. Peptides were eluted from the column into the mass spectrometer using the following gradient: 2% to 35%B in 30 min, 35% to 95%B in 30 s, maintained at 95% for 3 min and then back to the initial conditions.
Mass spectrometry
The nanoUPLC was coupled online through a 10-μm ZDV emitter to a timsTOF Ultra mass spectrometer (Bruker Daltonics). Data were acquired in parallel accumulation–serial fragmentation combined with data-independent acquisition (DIA-PASEF) mode103. For ion mobility, the 1/K0 range was set to 0.70–1.30 V cm−2, ramp time of 166 ms and estimated cycle time of 1.20 s. A total of 27 windows of 25 Da with 1-Da overlap were set over a range of 335.3–1,011.3 Da.
Data analysis
Raw data were processed with DIA-NN (v.2.2.0)104. The data were searched in library-free mode against the Mus musculus and S. Tm Uniprot proteome databases appended with common laboratory protein contaminants and the following modifications: Carbamidomethylation of C as a fixed modification and oxidation of M and protein N-terminal acetylation as variable ones. Quantification was performed using the QuantUMS (high precision) algorithm. The label-free quantification intensities were extracted and used for further calculations using Perseus (v.1.6.2.3)105. Those intensities were log transformed and only proteins that had at least three valid values in at least one experimental group were kept. The remaining missing values were imputed (width 0.3 and down shift 1.8). A Student’s t-test was performed to identify the proteins that are differentially expressed.
Statistical analysis
Statistical analysis was performed with the GraphPad Prism 11, R v.4.4.1, R v.4.3.1 and MATLAB R2020a/R2025b. The specific tests applied are detailed in the corresponding figure legends and ‘Computational methods’ section. Unless otherwise indicated, all statistical tests were two-sided. Data are presented as mean ± s.e.m. unless otherwise indicated. For pairwise comparisons, unpaired two-sided Student’s t-tests were used for normally distributed data; Welch’s correction was applied when variances were unequal as stated in figure legends. For comparisons of more than two independent groups, a one-way ANOVA was performed followed by Tukey’s multiple-comparisons test. For experiments involving two independent variables, two-way ANOVA was used with Tukey’s or Bonferroni’s multiple-comparisons correction as appropriate. Exact P-values are provided in the figures, figure legends and/or Source Data where applicable. For high-dimensional transcriptomic analyses, multiple-testing correction was performed using the Benjamini–Hochberg FDR method unless otherwise specified. For all quantified experiments, the exact n value and the unit of analysis are indicated in the corresponding figure legends. Biological replicates refer to independent animals, independently derived organoid cultures, or independently performed infection experiments, as specified for each assay. Technical replicates were not treated as independent observations for statistical testing. No statistical methods were used to predetermine sample size. Sample sizes were chosen on the basis of previous experience with the corresponding in vivo, ex vivo, organoid and single-cell profiling assays, and were consistent with sample sizes commonly used in the field for these experimental systems. Investigators were not blinded during data collection and analysis, and no randomization was used.
Computational methods
scRNA-seq pre-processing and demultiplexing
For droplet-based scRNA-seq, Cell Ranger v.7 was used to align reads to the GRCm39 (m32) mouse genome reference. In a subset of batches multiple (3 or 4) experimental conditions were overloaded onto a 10x flow channel106 and demuxing was performed by Pegasus demuxEM (v.1.3.1) using default settings at https://github.com/lilab-bcb/demuxEM/ (ref. 107).
scRNA-seq processing and quality filtering
scRNA-seq reads were re-aligned with STARsolo to GRCm39 (m32) using multimapping mode, quantifying both full-length and exonic-only transcripts (v.2.7.10)108. The output was processed using the dropletUtils R package (v.1.7.1), to exclude any chimeric reads that had less than 80% assignment to a cell barcode, and identify and exclude empty cell droplets109,110, by testing against a background generated from barcodes with 1,000 to 10 unique molecular identifiers (UMIs), with cutoffs determined dynamically based on channel-specific characteristics. Next, we used CellBender (v.3.0)111, to exclude ambient transcripts and quantify the ambient proportion in each cell barcode. Cell barcodes were excluded if they satisfied any one of the following criteria: (1) fewer than 300 genes; (2) fewer than 500 UMIs (after excluding MT and intron UMIs); (3) empty droplet with FDR < 0.1; or (4) over 30% of reads estimated as coming from ambient reads according to CellBender.
Using outlier exclusion separately for each 10x channel, cells that deviated by >2 × IQR from the median were then flagged based on the following criteria: (1) log10(total transcript UMI); (2) fraction of barcode swaps; (3) gene saturation estimate; (4) UMI saturation estimate; and (5) fraction of UMI supported by >1 read112. Cells were further flagged if they substantially deviated from the fit based on the following relationships: (1) total reads versus total UMI; (2) total UMI versus log likelihood of being empty110; and (3) total UMI versus total number of genes. A cell was excluded if it was flagged by at least two of these criteria.
The scRNA-seq data from p.i. with Listeria were processed in the same manner as outlined above. Due to increased variability of cell quality in this experiment, we applied an additional filtering step and excluded cells in clusters showing low expression of the gene Malat1 (ref. 113).
Re-analysis of published scRNA-seq
Raw sequencing data from GSE92332 (SRA accession code PRJNA357261) were obtained and reprocessed using the same analysis steps and filtering criteria.
Selection of variable genes, dimensionality reduction, clustering and cell-type assignment
After quality filtering and exclusion (see ‘scRNA-seq processing, quality control filtering’), transcriptionally overdispersed genes were identified within each experimental batch (10x channel) by the difference of the coefficient of variation (CV) from the median CV for other genes with a similar mean expression114. A robust set of 1,000–6,000 genes was retained based on an elbow-based criterion, applied to the median of overdispersed difference statistics based on 200 samples of 75% of cells.
Subsequent analysis of single-cell data was performed after UMI sequencing depth normalization to log2(TP10K + 1) values and was limited to analysis of exonic reads. Next, 80% of genes and samples were subsampled between 100 and 200 times, and non-negative matrix factorization (NMF) was used to reduce the dimensionality of the full dataset to between 15 and 40 dimensions as the product of two non-negative matrices115. The loading matrices (activations) of these NMF components were used to calculate a k-nearest neighbors (k-NN) graph (k = 21) based on a cosine similarity distance. This graph was clustered using stability optimizing graph clustering (http://michaelschaub.github.io/PartitionStability/; refs. 116,117), to identify cell type clusters. Cell types were manually annotated based on known cell-type markers4.
To minimize differences across samples due to technical reasons, gene expression measurements of individual genes were quantile normalized such that the expression cumulative distribution functions for each gene matched across batches for clustering and UMAP visualization, and classification tasks.
Gradient boosting (R v.3.6.1, XGBoost v.0.90.0.2; ref. 118) was first applied to build a cell to cluster classifier for each cluster type based on uninfected control. For each of the 12 cell types, a separate classifier was trained to predict each cell type separately (one-versusall), in a fivefold cross-validation scheme. Next, using the probability scores of the held-out test-set we identified an optimal cutoff for each class based on a receiver operating characteristic analysis comparing the true positive rate (TPR; true positives divided by all positive predictions) to the false positive rate (FPR; false positives divided by all negatives) and selecting the point at which the receiver operating characteristic curve intersects with the diagonal. In cases where a cell was assigned to more than one subtype, we used the assignment with the higher predictive score. Cells that could not be assigned confidently by any classifier were excluded from further analysis.
Visualization of single-cell profiles
We generated UMAP, per set of experiments from consensus NMF loading matrices, with n_neighbors value of 30, and min_dist value of 0.3 and cosine distance.
Identification of differentially expressed genes
DEGs were identified using a negative binomial mixed model (NEBULA (v.1.5.2)119, https://github.com/lhe17/nebula), with experimental batch as a random effect, an offset of total exonic-UMI counts per cell, and using an NBGMM model. DEG testing was performed in several ways and included in the supplementary tables:
-
(1)
Global tissue test, Sal24 h p.i. versus uninfected controls (Supplementary Table 2).
-
(2)
Global ‘matched-tissue’, Sal24 h p.i. versus uninfected controls (Supplementary Table 2). Here, tissue was matched by subsampling cells such that the conditions are comprised of similar cell-type proportions. We report the trimean statistics over 30 random subsamples.
-
(3)
Sal24 h p.i. versus uninfected controls (Supplementary Table 3). Performed separately per cell type.
-
(4)
Sal24 h GFP+ p.i. versus Sal24 h p.i. (Supplementary Table 5). Performed separately per cell type.
-
(5)
Tomato+Sal+ p.i. versus Tomato+Sal− (Supplementary Table 7). Performed separately per cell type.
-
(6)
Global tissue test, Listeria p.i. versus matched uninfected controls (Supplementary Table 9).
-
(7)
Global tissue test, Sal48 h p.i. versus uninfected controls (Supplementary Table 13). Re-analysis of previously published scRNA-seq (GSE92332, 10x 3’ v.1 kits). Sal48 h expression profiles were compared against control data from the same experiment to minimize experimental technical differences.
-
(8)
Uninfected controls cell type versus all (Supplementary Table 1). Performed separately comparing expression within cell-type against all other.
-
(9)
Tomato+Sal− cell type versus all (Supplementary Table 10). Performed separately comparing expression within cell type against all other.
Genes were considered as DEGs if they passed the following criteria:
-
1.
NEBULA test successfully converged.
-
2.
NEBULA P-values after Benjamini–Hochberg correction had FDR < 0.1
-
3.
NEBULA log2FC was > log2(1.25)
When examining cell-type-specific expression differences (points 3–5 above) the following additional criteria were used to determine if a gene is differentially expressed:
-
4.
Gene showed nonzero expression in >5%
-
5.
log2FC of the mean of expressing cells between conditions >log2(1.5)
-
1.
Gene set enrichment of differentially expressed genes
To explore associations between DEGs and known gene sets, we tested gene-set enrichment using a hypergeometric test. We selected the top 400 DEGs for comparison against a comprehensive set of 13,239 gene sets derived from the MSigDB compendium, which includes databases such as Biocarta, Reactome, WikiPathways, GTRD, GO and Hallmarks120. This analysis was further extended by incorporating bioPlanet genesets121 and additional gene sets identified in the current study based on the top DEGs. A gene set was considered significantly enriched if it contained at least four overlapping genes with our DEGs, and the hypergeometric test revealed enrichment with FDR < 0.1, adjusted using the Benjamini–Hochberg method.
Calculating gene signature scores
Single-cell gene set signature enrichment was performed as previously described122. Genes were categorized into 20 bins based on their mean expression across all cells, with bin boundaries determined by the overall gene expression distribution. Gene expression values were centered, scaled and transformed to the [0,1] range using a logistic function. For a gene set signature comprising k genes, a raw signature score was calculated for each cell as the mean of the normalized expression values. This raw score was then compared to a null distribution generated from 1,000 randomly selected gene sets, each containing k genes. The random gene sets were constructed to match the global mean expression bins of the original signature genes.
The final per-cell activity score was derived by centering the raw score against the mean of the null distribution scores. For visualization, these activity scores were further standardized by median-centering and scaling by the mean absolute deviation. Significance between conditions was tested using a generalized linear mixed model with batch as a random effect and condition as the fixed effect. We report the P-values of a likelihood-ratio test or ANOVA F-test comparing a baseline model with the model including the tested condition (fixed effect).
When testing gene signatures in human bulk and single-cell RNA-seq data, mouse gene signatures were translated to human genes symbols using ortholog mapping using the OMA database (downloaded 28 March 2024)123. All gene signatures used in this study are provided in Supplementary Table 16.
Comparing cell-type proportions in single-cell experiments
Significance of cell type abundance changes were tested using approach previously described in. Haber et al.4. In brief, each cell type across analyzed mice was modeled as a Poisson-distributed random variable. We employed a generalized linear model with the following specifications, the distribution family was ‘Poisson’, response variable was the count of a tested cell type, offset variable as the total number of post-qc filtering profiled cells per mouse/batch, and predictor variable as the tested condition (for example Sal 24 h p.i. versus uninfected control). The statistical significance of the treatment effect was evaluated using a Wald test on the corresponding regression coefficient.
Consensus invasion signature
We further validated our identified consensus signature of top DEGs from our experiments in a contemporary study on human patients with IBD53. We selected genes consistently recognized as DEGs across three or more cell types, forming distinct positive and negative gene signatures, comprising 81 and 85 genes, respectively. These gene signatures were translated to human gene symbols through ortholog mapping124 and evaluated in human scRNA-seq datasets, as detailed in our gene signature scoring methodology (see ‘Calculating gene signature scores’). Signature scores were normalized using z-scores based on median and MAD, after which the negative signature scores were subtracted from the positive scores. Statistical significance was assessed using a likelihood-ratio test to compare a baseline model without the condition (fixed effect) against a model that includes it, with both models accounting for batch and chemistry as random effects.
Single-cell clustering and differential expression analysis of lineage tracing experiments
Sequencing data from the 10x Genomics libraries was demultiplexed, aligned to the mm10 genome and UMI-collapsed using the count function of the Cell Ranger toolkit (v.7.0) provided by 10x Genomics. Further demultiplexing of the hashtag oligos was performed using the Seurat R package (v.4.3.0) according to the instructions in the vignette https://satijalab.org/seurat/articles/hashing_vignette.html (ref. 125). Doublets (cells with two antibody tags) and negatives (no antibody tag) were removed and the singlets assigned to the relevant samples.
scRNA-seq data of lineage tracing experiments were processed and analyzed primarily using the Seurat R package (v.5.0.0). In brief, raw count matrices were normalized and variance-stabilized using the SCTransform method126, selecting 3,000 highly variable (overdispersed) genes as input features for downstream analysis. PCA was performed using the top 15 principal components (PCs) to capture major sources of variation in the dataset.
Neighborhood graphs were constructed using these PCs, and cell clustering was performed using the Louvain algorithm with a resolution parameter set to 0.8. Dimensionality reduction for visualization utilized UMAP on the top 15 PCs. Cell clusters were further annotated based on canonical marker genes and subclustered as needed (for example, subclustering of cluster 11 using symmetric-nearest-neighbors modularity optimization with resolutions between 0.05 and 0.5, yielding 2–6 subclusters).
Differential gene expression analysis was performed between conditions with Nebula as described above.
Pseudotime and trajectory analysis of lineage tracing single-cell expression
Single-cell expression matrices (SCTransform normalized; top 3,000 highly overdispersed genes) were exported from lineage-specific Seurat objects (v.4.4) to Monocle 3 (v.1.3.1) and destiny (v.3.9). Dimensionality reduction in both tools relied on the same 15 PCs used for clustering. For diffusion-map analysis, 50 diffusion components (DCs) were calculated with DiffusionMap (default settings)127. DC1–DC2 were merged into the Seurat metadata and visualized, coloring cells by treatment (control or Salmonella-infected) or annotated cluster. In addition, a pseudotime trajectory analysis was conducted, resulting in a diffusion pseudotime (DPT) metric, starting from the first cell of DC1 of ISC-I. DPT is a measure based on the transition probability of a diffusion process, allowing us to order individual cells according to their progression through a biological process.
Graph-based pseudotime trajectories were reconstructed with Monocle 3 (ref. 128). A principal graph was inferred with learn_graph (with and without partitioning); the UMAP node containing the highest proportion of ISC-I cells was set as the trajectory root. Cells were ordered with order_cells, and pseudotime distributions were displayed as violin plots. Secretory-lineage analysis included ISC-I–III, Paneth progenitor, proximal/distal Paneth, Paneth–goblet progenitor, goblet, secretory progenitor and tuft clusters; the absorptive lineage comprised ISC-I–III, TA, enterocyte progenitor (EP1–2) and enterocyte clusters.
Branch-specific gene dynamics were identified using graph_test on the principal graph (four to eight CPU cores); genes with FDR-adjusted q < 0.05 were retained. Concordance between Monocle pseudotime and DPT confirmed the robustness of the inferred differentiation trajectories under control and infected conditions.
Analysis of previously published human datasets
Single-cell and bulk transcriptomic datasets from CD cohorts used for secondary analyses in this study were obtained from previously published studies and analyzed in accordance with the data-access terms of the original publications. No new human participants were recruited for these analyses. Single-cell expression data were downloaded from the Broad Single-cell Portal (SCP259).
Integrated host transcriptomic and microbiome analysis from human ileal tissue
Matched RNA-seq and 16S rRNA sequencing data from ileal tissue of patients with CD and controls were obtained from the published SOURCE83 and RISK84 cohorts.
Raw RNA-seq FATSQ reads were quantified using kallisto129 (v.42.5) using Gencode (v.24) as the reference genome. Kallisto output files were summarized to the gene level using R package tximport (v.1.22.0). Gene expression values for SalSumDeg genes were subjected to PCA and the resulting PC1 and PC2 values were used to represent the summarized gene signal.
The 16S rRNA sequencing reads were processed using a data curation pipeline implemented in QIIME 2 (v.2023.7)130. Reads were demultiplexed according to sample-specific barcodes. Quality control was performed by truncating reads after three consecutive Phred scores lower than 20. Reads with ambiguous base calls or shorter than 150 bp after quality truncation were discarded. Amplicon sequence variant detection was performed using Deblur131.
Multivariable association analysis was performed using MaAsLin2 (ref. 132) to identify ASVs associated with SalSumDeg PC1 and PC2 values from the SOURCE cohort, separately, while controlling for age and sex. An FDR cutoff of 0.25 was used.
Reporting summary
Further information on research design is available in the Nature Portfolio Reporting Summary linked to this article.