
In vitro characterization of high- and low-affinity CAR-T cells
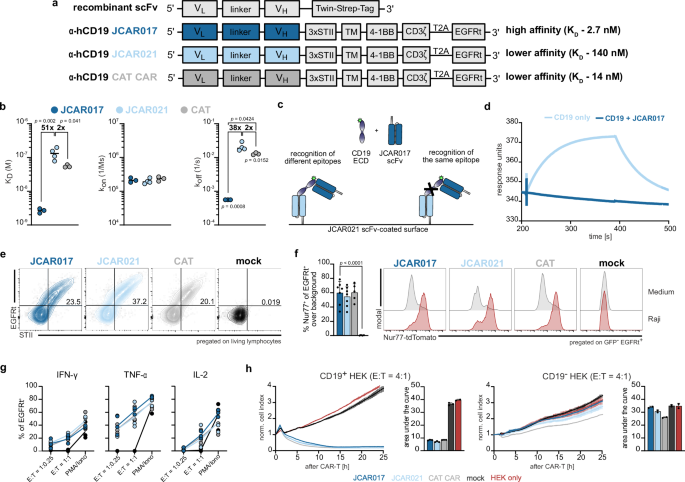
In order to systematically explore the effect of receptor affinity on CAR-T-cell characteristics, we selected two anti-human CD19 scFvs: JCAR017, which is derived from the high-affinity murine FMC63 antibody and is the central component of most commercially approved anti-CD19 CAR-T-cell products, and JCAR021, which is a fully humanized anti-CD19 CAR. We also employed the anti-CD19 scFv of the recently published CAT CAR as a reference for an affinity-reduced receptor with enhanced functionality25. To determine affinity, all scFvs were expressed as recombinant proteins conjugated to a Twin-Strep-tag (Fig. 1a), enabling their immobilization on a StrepTactin-coated surface for surface plasmon resonance (SPR) measurements. Using an engineered stable version of the extracellular domain (ECD) of the recombinant CD19 protein44, we confirmed the high affinity of JCAR017 (KD = 2.7 × 10⁻⁹ M). In comparison, JCAR021 showed a reduced affinity (KD = 1.4 × 10⁻⁷ M) closer to, but still slightly lower than the published CAT scFv (KD = 5.5 × 10⁻⁸ M) (Figs. 1b and S1a)25. Moreover, we observed that the differences in KD values were primarily driven by the dissociation kinetics (koff), rather than the association rate (kon) (Fig. 1b), consistent with other reports25. The epitope position within the three-dimensional structure of an antigen can affect CAR accessibility and, consequently, the functions of engineered T cells. Notably, our chosen scFvs recognize the same conformational epitope of CD19. This is evidenced by the lack of ECD CD19 binding to immobilized low-affinity JCAR021 in the presence of the high-affinity JCAR017 scFv (Fig. 1c, d).

a Schematic of the scFv design for periplasmic expression in E. coli and CAR construct structures for retroviral gene delivery. b Surface plasmon resonance (SPR) analysis of scFv binding kinetics, including dissociation constant (KD), association rate (kon) and dissociation rate (koff). Each dot represents an individual replicate (n = 3; JCAR021 n = 4, dash indicates the mean measured with the capture of 50 nM scFv for 60 s with a 10 µL/min flow rate). c Schematic representation of epitope mapping to determine similarities in the recognition sites of JCAR017 and JCAR021 scFvs. d SPR sensorgram showing soluble CD19 binding to JCAR021 scFv in the presence or absence of JCAR017 scFv. e Representative flow cytometry plots of transduction efficiency (EGFRt+) and surface expression level (STII+) of JCAR017, JCAR021 and reference CAT CAR in primary human T cells. f Quantification of Nur77-tdTomato expression in CAR-transduced Jurkat cells stimulated with CD19+ GFP+ Raji tumor cells at an effector-to-target (E:T) ratio of 1:1 or cultured in medium, background-subtracted. Each dot represents the mean of technical triplicates. Bars indicate the mean + SD across biological replicates (n = 7; CAT n = 5). Additionally, representative histograms displaying Nur77-tdTomato signal are shown. g Intracellular cytokine production quantified after 5 h co-culture with CD19+GFP+ Raji cells at the indicated E:T ratios. Each dot represents the mean of technical triplicates of one independent biological replicate (n = 3). PMA/ionomycin was used as a positive control. h Representative xCelligence impedance-based killing curves with CD19+ (left) or wildtype (WT) (right) HEK cells, including quantification by the area under the curve (AUC), are shown. Each dot represents a technical replicate of one out of three independent biological experiments. Data is presented as mean + SD (n = 3). Statistical analyses were performed for (b, f) using one-way ANOVA for multiple comparisons between the individual scFvs (b) or with JCAR017 as reference (f). *p < 0.05, **p < 0.01, ***p ≤ 0.001, ****p ≤ 0.0001.
To assess the impact of receptor affinity on T-cell functionality, we introduced the scFvs into a second-generation CAR backbone. The scFvs were linked via a CD28 transmembrane domain to the intracellular signaling domains CD3ζ and 4-1BB. An inert truncated epidermal growth factor receptor (EGFRt) was incorporated into the construct and utilized to track the efficiency of T-cell engineering45,46,47, while a triple repeat sequence of Strep-tag II (STII)46,48 was attached to the extracellular hinge domain to verify surface expression of the CAR construct (Fig. 1a). The vectors could be efficiently delivered with stable CAR surface expression (Fig. 1e). To examine how CAR affinity affects T-cell activation, we introduced the various CARs into a Nur77-tdTomato-Jurkat reporter cell line49. Within this reporter system, the fluorescent protein tdTomato is co-expressed with the early gene of TCR signaling Nur77, thus enabling a fast determination of CAR-T-cell sensitivity after antigen encounter50. Receptor affinity did not impact the activation strength (functional avidity) in this in vitro assay (Fig. 1f). We then introduced the described CARs into primary human T cells and observed that both high- and low-affinity CAR-T cells showed similar functionality in terms of cytokine production and cytotoxicity when co-cultured with CD19-expressing tumor cells (Figs. 1g, h and S1b, c), even at low effector-to target ratios and with CD19-low-expressing target cells (Fig. S1d, e).
Overall, we did not observe any significant impact on the in vitro functionality of CAR-T cells even when we reduced the CAR affinity by 50-fold.
Ligand binding affinity has only scarce impact on in vitro functionality of CAR-T cells
As the above investigated affinity range left in vitro functionality apparently unaffected but was still an order of magnitude higher than physiological TCR binding strengths, we explored the possibility of reducing the range of CAR affinities even down to physiological TCR:pMHC interactions. We used educated exchanges of 32 individual residues into the low-affinity binder JCAR021, which harbored a high probability to reduce the scFv affinity without compromising epitope specificity (Fig. 2a and Tab. S1). As the scFv dissociation kinetics (koff-rates) were the main determinant of the overall KD in our previous measurements (Fig. 1b), we adapted our flow cytometry-based TCR:ligand koff-rate technique51,52,53 to screen the library of mutated scFvs for potential changes in dissociation kinetics. Besides increased throughput compared to SPR, this method enables the monitoring of monomeric ligand dissociations under most physiological conditions (e.g., cell surface distribution and/or endogenous expression of the respective target antigen). For this purpose, mutated scFvs were double tagged in frame with a Strep-tag and a Tub-tag sequence (scFv Flexamer) (Fig. 2a). The tags enable the multimerization of monomeric scFvs on a StrepTactin backbone (scFv StrepTamer) and the site-specific conjugation of a fluorescent dye54 (Fig. 2b). scFv StrepTamers were used to stain PBMC-derived target CD19+ B cells. The administration of D-biotin leads to the displacement of the StrepTactin backbone due to its higher affinity compared to the Strep-tag, leaving monomeric scFvs attached to the target cells. The monomeric scFvs dissociate from cognate epitopes according to their intrinsic affinity, and the decay of the fluorescent signal can be translated into the koff-rate (Figs. 2b and S2a). The individual labeling of B cells with distinct fluorescence-conjugated anti-CD45 antibodies enabled multiplexed koff-rate measurements of up to 16 different scFvs simultaneously (Fig. S2b). In line with the SPR measurements, we observed a much slower dissociation kinetics for the JCAR017 scFv in comparison to the JCAR021 scFv. Quantitatively, JCAR017 and JCAR021 scFvs possessed koff-rates in a similar range as measured via SPR (JCAR017: SPR koff = 5.6 × 10⁻⁴ s−1 vs flow cytometry koff = 2.3 × 10⁻⁴ s−1; JCAR021: SPR koff = 2.1 × 10⁻² s−1 vs flow cytometry koff = 4.1 × 10⁻² s−1), thus validating the reliability of the flow cytometry-based measurement of scFv dissociation kinetics. For 26 JCAR021 scFv mutants, we were able to determine robust and highly reproducible koff-rate values and these demonstrated coverage of a broad range of distinct dissociation kinetics for individual amino acid exchanges (Figs. 2c and S2c). The remaining six mutants showed either an overall loss (H36P, F113P, W116E, Y174G) or largely reduced and variable (W116P, L184D) CD19 ligand binding (Figs. 2c and S2d), which precluded robust koff-rate measurements. By comparing the binding strength landscape of virus-specific TCRs55 with the JCAR021 mutants (these experiments had to be performed at lower temperatures (4 °C) to allow measurements of fast TCR:pMHC dissociation kinetics), we could demonstrate that some JCAR021 mutants with the fastest koff-rates fell indeed within the range of TCR affinities (Fig. 2d). Notably, the temperature did not qualitatively alter the dissociation kinetics of either interaction (Fig. S2e).

a Schematic of the scFv sequence used to generate fluorescently labeled scFv FLEXamers along with the CAR sequence for retroviral transduction to construct the affinity library derived from the JCAR021 framework. Mutagenesis regions are indicated by stars. b Principle of the flow cytometry-based assay to assess monomeric scFv:epitope dissociations. c Quantification of scFv dissociation kinetics (koff-rate) by one-phase exponential decay curve fitting, expressed as dissociation half-life (t1/2) (n = 3, 30 min 20 °C). d Comparative analysis of TCR and scFv koff-rates (n ≥ 3, 30 min 4 °C). e Transduction efficiency (EGFRt+) (upper left), CAR-expression (STII+) (upper right) and representative flow cytometry plots (below) in primary human T cells (n = 3). f Fold change in Nur77-tdTomato expression of CAR-transduced Jurkat cells upon stimulation with CD19+GFP+ Raji cells (E:T 1:1) or incubation in medium for 3 h (n ≥ 5). Representative flow cytometry plots are shown on the right. g Intracellular cytokine production in CAR-engineered primary human T cells following 5 h co-culture with CD19+GFP+ Raji cells at an E:T of 4:1 (n ≥ 3) with representative flow cytometry histograms. h Impedance-based xCelligence killing curves (below) and quantification of CAR-T-cell killing (upper) as area under the curve (AUC) (n ≥ 2). i Heatmap summarizing the functional properties of JCAR021, CARmfunct and CARmlowfunct in vitro. f–i Data are normalized to the average value of JCAR017. Data are expressed as mean ± SD. Each dot represents the mean of technical replicates for JCAR017 and JCAR021 and the mean of an independent experiment for the JCAR021 mutants. Statistical analyses were performed in (e–h) using a one-way ANOVA test for multiple comparisons with JCAR017 as reference. *p < 0.05, **p < 0.01, ***p ≤ 0.001, ****p ≤ 0.0001.
We introduced the JCAR021 mutant scFvs into the same second-generation backbone as before (Fig. 2a). As stable receptor surface expression is one determining parameter for target recognition and CAR-T-cell functionality, we evaluated the efficacy of vector delivery and CAR surface expression via the transduction marker EGFRt and the CAR expression marker STII. Most of the mutants preserved an optimal CAR surface expression, as indicated by the correlation between STII and EGFRt, highly comparable to JCAR017 and JCAR021 (21/32, 66%, referred to as CARmfunct indicated in green). In contrast, the transgenic receptor was barely detectable at the cell surface of the remaining CAR-T cells (11/32, 34%, referred to as CARmlowfunct indicated in yellow), for which we observed either weak co-expression of the CAR and EGFRt markers, or transduction rates below 20% (Figs. 2e and S3a). Of note, the two CAR variants with EGFRt/STII co-expression levels apparently comparable to those of the CARmfunct group—namely F113L and W116E—exhibited little CAR surface expression.
Next, we re-expressed the JCAR021 mutant library into the Nur77-tdTomato-Jurkat reporter cell line49. The functional activation pattern among T cells engineered with JCAR017, JCAR021, and CARmfunct mutants was very similar despite the strong variations in antigen-binding affinity. In contrast, CARmlowfunct-T cells showed a drastically reduced activation pattern (Figs. 2f and S3b). Furthermore, when re-expressed in primary human T cells, CARmfunct-engineered T cells closely resembled cytokine production (IFN-γ, TNF-α and IL-2) and cytotoxicity as compared to the high-affinity binder JCAR017 or the original JCAR021. CARmlowfunct-engineered T cells, instead, showed a reduction in cytokine production or did not respond to the CD19 stimulus at all. Moreover, these T cells were predominantly unable to control target cell growth at low effector to target ratios (Figs. 2g, h and S3c, d). More challenging effector-to-target ratios and the use of CD19-high- and low-expressing target tumor cell lines did not improve resolution with respect to the dependence of in vitro target cell killing on CAR affinity, except for the ultra-low, TCR-like-affinity CAR mutants (Fig. S4). Furthermore, we investigated the extent of interaction with the target cell membrane (trogocytosis) of selected mutants in comparison to JCAR017 and JCAR021 (Fig. S5a). As expected, the extent of trogocytosis decreased along with CAR ligand binding affinity (Fig. S5b, c), in line with recently published studies28,29.
In summary, surface expression of the CAR appears to have a greater impact on measurable in vitro functionality than the binding affinity of the scFv (Fig. 2i). Among the stable CAR constructs within the CARmfunct group, functional differences were observed only at ultra-low affinity levels—within the physiological range of functional TCRs (e.g. V236W and V236F). These variants showed slight reductions in cytokine production, notable differences in trogocytosis and reduced target cell killing at low effector-to-target ratios and low antigen density. Overall, these findings demonstrate that the threshold of CAR binding strength that still translates into effective in vitro functionality is remarkably low, even reaching down to low-affinity interactions with extremely fast koff-rates (t1/2 = 50 s at 20 °C).
CAR ligand binding affinity influences recruitment, activation and anti-tumor efficacy in vivo
Within CARs with preserved and very similar surface expression, we observed comparable in vitro functionality irrespective of antigen-binding affinities, except when we analyzed CAR-ligand interactions as low as TCR-like binding affinities. Next, we assessed whether these similarities in functionality were also preserved in vivo. For this purpose, we selected the JCAR017 and JCAR021 CARs alongside three additional mutants that cover a broad affinity spectrum. The mutant L237W (t1/2 = 96 s) exhibited lower affinity than JCAR021 (t1/2 = 167 s) despite preserved in vitro functionality. We detected mutant M35A to be positioned at the threshold of in vitro functional CARs (t1/2 = 64 s) with further reduced affinity. Finally, mutant V236W harbored one of the fastest koff-rates (t1/2 = 44 s) and displayed reduced functionality compared to other CARmfunct even in vitro. Notably, the three selected mutants belonged to the CARmfunct group with stable surface expression, therefore attributing potential differences in CAR performance primarily to the scFv affinity.
We initially assessed in vivo functionality using an immunocompromised mouse model with implanted CD19+ Raji lymphoma cells. (Fig. 3a). These cells were additionally modified to express firefly luciferase for bioluminescence imaging and green fluorescent protein (GFP) for peripheral detection. The T-cell products of the five CAR constructs demonstrated comparable levels of CAR expression with a strong correlation between EGFRt and STII (Figs. 3b and S6a), an equal distribution of CD8+ and CD8− T cells (Fig. 3c) and a similar ex vivo phenotype (Fig. 3d) prior to infusion. Eleven days after T-cell transfer, the majority of mice treated with non-transduced T cells (mock) had to be sacrificed due to rapid tumor progression, while the ultra-low-affinity mutant V236W provided minor survival benefits. Mice treated with the low-affinity CARs JCAR021, L237W and M35A demonstrated improved survival. However, in contrast to our results observed in vitro, lower-affinity CARs were less effective in controlling tumor progression as the high-affinity JCAR017-T cells (Figs. 3e, f and S6b).

a Schematic overview of the experimental setup in a xenograft tumor model (Raji ffluc) employing bulk CAR-T cells. b Quantification of the transduction efficiency (EGFRt+) (left) and flow cytometry plots depicting co-expression of transduction marker (EGFRt+) and CAR surface expression (STII+) of CAR-transduced primary human T cells pre-infusion. c T-cell subset distribution and d phenotypic analysis of the infused CAR-T-cell products (Tscm CD62L+CD45RA+; Tcm CD62L+CD45RA−; Tem CD62L−CD45RA−; Teff CD62L−CD45RA+). e Kaplan–Meier survival curve for mice treated with respective CAR-T-cell products. f Residual tumor burden quantified as the maximum photon per second per cm2 per steradian depicted as median + SD. g Quantification of CAR-T-cell expansion in the circulation (EGFRt+ cells) assessed in blood at the indicated time points post transfer. Each dot represents an individual mouse. h CAR-T-cell distribution at sacrifice displayed as absolute cell numbers in bone marrow (BM) and spleen. Each dot represents an individual mouse. i Representative flow cytometry plots and quantification of PD-1 and HLA-DR co-expression in EGFRt+ CAR-T cells in blood, BM and spleen at sacrifice. Each dot represents an individual mouse. j Phenotypic distribution of EGFRt+ CAR-T cells in BM and spleen. Each dot represents an individual mouse. Data are representative of two independent experiments derived from two different donors. Data are expressed as mean + SD (JCAR017 n = 8; JCAR021 and M35A n = 7; L237W and V236W n = 6). Statistical testing by Log-rank test (e) one-way ANOVA (g–j), or two-way ANOVA (f) using JCAR017 as reference, *p < 0.05, **p < 0.01, ***p ≤ 0.001, ****p ≤ 0.0001.
To gain a clearer understanding of the factors contributing to the reduced in vivo efficacy of lower-affinity CARs, we examined the proliferative capacity and activation of transferred cells. JCAR017-T cells were significantly stronger expanded in peripheral blood as early as seven days post-transfer and continued to expand throughout the observation period. In contrast, the lower-affinity CARs reached higher numbers compared to JCAR017 in peripheral blood at day 14 post CAR-T-cell transfer. The only exception was the ultra-low mutant V236W-treated cohort, in which CAR-T cells were detectable at an early time point, similar to the JCAR017 cohort (Fig. 3g). Nevertheless, the quantity of circulating T cells does not necessarily reflect their impact on combating the disease, so we further investigated the CAR-T presence at the tumor site. Recent studies have shown that low-functional T cells can be enriched in the peripheral circulation rather than at the tumor site in cancer patients39. Therefore, we assessed T-cell infiltration into the bone marrow, the primary site of Raji cell localization, and the spleen, which is only minimally invaded by tumor cells unless there is an extremely high burden (Fig. S6c). Although CAR-T cells from all groups successfully engrafted, we observed significantly higher numbers of EGFRt+ cells in the bone marrow of mice treated with high-affinity JCAR017-T cells (Fig. 3h). T-cell infiltration was generally similar for the low-affinity CAR-T cells, except for the ultra-low-affinity clone V236W, which showed lower abundance. Conversely, the CAR-T-cell quantity in the spleen was equivalent in all treated mice (Fig. 3h), suggesting a preferential spatial distribution of T cells within the tumor based on receptor affinity.
Additionally, we observed a correlation between the activation status of CAR-T cells and their receptor affinity in both blood and tissues. Specifically, the frequency of activated PD-1+HLA-DR+ cells was significantly reduced in both compartments of M35A and V236W-treated mice compared to the high-affinity JCAR017 (Fig. 3i). Furthermore, JCAR017-T cells maintained a higher frequency of memory cells (CD45RA−), whereas lower-affinity CARs displayed a more differentiated phenotype (CD45RA+ CD62L−), likely due to the increasing tumor burden. Notably, the ultra-low-affinity V236W CAR-T cells retained a more naïve/stem-like phenotype, indicating less activation or recruitment into the tumor response. We did not observe these variabilities within the spleen, where we identified predominantly central or effector memory differentiated populations among the EGFRt+ CAR-T cells (Fig. 3j).
Finally, we investigated whether escalating CAR-T-cell doses could rescue the in vivo anti-tumor efficacy of low-affinity CAR-T cells (Fig. S7a, b). Low doses of JCAR017-CAR-T cells were sufficient to ensure survival of all treated mice, even though residual tumor burden correlated with CAR-T-cell doses and expansion (Fig. S7c–g). Increasing doses of low-affinity CARs increased survival rates but resulted only in a dose-dependent delay of tumor progression despite the high levels of circulating CAR-T cells (Fig. S7c–g).
Overall, we revealed that scFv affinity plays a pivotal role in determining effective in vivo anti-tumor activity by driving proper CAR-T-cell activation and recruitment to the tumor site. Large numbers of low-affinity CAR-T cells only delayed tumor progression in a dose-dependent manner.
CAR-T-cell-associated toxicities are influenced by T-cell dose and receptor affinity
In order to investigate whether binding affinity also affects CAR-T-cell-related toxicities, we reconstituted a human-like immune compartment in immunocompromised triple transgenic NSG-SGM3 (NSG-S) mice with cord blood-derived CD34+ hematopoietic stem cells (HSCs) as described by Norelli et al.18. The transgenic expression of human stem cell factor, granulocyte/macrophage colony-stimulating factor (GM-CSF), and IL-3 supports the maintenance and differentiation of HSCs, especially within the myeloid cell lineages, which are key mediators for CRS18. We recently improved this model by reducing CD34+ HSC doses to produce cohorts of humanized mice derived from a single cord blood donor, thereby improving reproducibility and reliability of humanization56.
To recapitulate the clinical situation, we established a system that allows the use of CD19+ tumor cell lines (Raji or Nalm-6) and healthy donor-derived PBMCs as CAR-T-cell source (Fig. 4a). We observed successful humanization within eight weeks after CD34+ HSC engraftment, indicated by the CD45+ chimerism in the blood of treated NSG-S mice. During the humanization process all model relevant human immune compartments were reconstituted—including hCD19+ B cells, hCD33+ macrophages and hCD14+ monocytes (Figs. 4b, c and S8a, b). Firstly, we assessed the feasibility of the model in inducing CRS by infusing escalating doses of JCAR017-T cells into humanized tumor-bearing NSG-S mice (hNSG-S). As expected, the anti-tumor activity and peripheral CAR-T-cell expansion correlated with CAR-T-cell doses (Fig. S8c–i). Importantly, CAR-T-cell-treated mice exhibited clinical symptoms of CRS, including weight loss and elevated serum cytokine levels (Fig. S8j, k), which were proportional to the administered T-cell dose. Symptoms were reversible in most cases, except in a certain proportion of mice (33%) treated with the highest T-cell dose (Fig. S8l).

a Schematic representation of the experimental design for the humanized CRS mouse model employing sorted CAR-T cells. The overall design is consistent across all CRS experiments, while the specific CAR-T-cell transfer conditions illustrate comparisons between varying doses of high- and low-affinity CAR-T cells. b Frequencies of huCD45+ chimerism and immune subpopulations in peripheral blood. c Absolute cell counts of huCD45+ cells and immune subpopulations in 100 µL of blood. d Transduction efficiencies of JCAR017 and JCAR021 constructs, shown as frequencies of EGFRt+/STII+ cells (left), STII mean fluorescent intensity (MFI) within EGFRt+ T cells (middle) and representative flow cytometry plots (right) of the infusion products. e Distribution of CD8+ to CD8− population within CAR-transduced cells in the infusion product. f Weight reduction following a high- and low-dose of high-affinity JCAR017 and low-affinity JCAR021-T cells. g Serum cytokine levels (IFN-γ, IL-10 and IL-6) three and five days after CAR-T-cell transfer. h–i Quantification (h) and imaging (i) of residual tumor burden of Raji cells determined via bioluminescence imaging. k CAR-T-cell expansion in blood (EGFRt+ cells per 100 µl) on day 5, 7, and 10 post-transfer. Each dot depicts an individual mouse. Data represent mean + SD (n = 5). Statistical analysis was performed by two-way ANOVA (f, h) or by one-way ANOVA (g, j), using the JCAR017 group with the highest dose as a reference control. *p < 0.05, **p < 0.01, ***p ≤ 0.001, ****p ≤ 0.0001.
Next, we evaluated the side effects induced by the low-affinity JCAR021. Therefore, JCAR017 and JCAR021 CAR-T cells with comparable characteristics in terms of receptor expression as well as CD8+/CD8− distribution were transferred into tumor-bearing hNSG-S mice (Fig. S9a–c). All CAR-T-cell-treated mice developed clinical symptoms of CRS (Fig. S9d–e). Nevertheless, mice treated with JCAR021-T cells experienced a significantly milder extent of weight loss, which also peaked at earlier time points compared to JCAR017-T-cell-treated mice, thereby allowing a faster recovery (Fig. S9d). Additionally, elevated levels of circulating INF-γ, IL-10, and IL-6 cytokines were observed in both treated groups, but at lower levels in JCAR021-T-cell-treated mice (Fig. S9e). The observed pattern of CRS development was in line with the differences in in vivo functionality for the two CAR-T-cell products. Indeed, consistent with the non-humanized NSG-S model, JCAR017-T cells exhibited superior antitumor activity, greater expansion potential and faster systemic depletion of CD19+ B cells than JCAR021-T cells in the acute phase 7 days post injection (Fig. S9f–l). This more robust expansion may account for, and potentially drive, the severity of the observed toxicity.
Next, we wanted to assess the dose effect of JCAR021-T cells when compared with JCAR017. To this end, we administered high- and low-doses of the two CAR-T cells into hNSG-S mice applying the same experimental procedure as previously described (Fig. 4d, e). All CAR-T-cell-treated mice developed clinical signs of CRS, with variability depending on both the receptor affinity and T-cell dose (Fig. 4f, g). JCAR017-T cells displayed a dose-dependent increase in CRS severity. In contrast, low-affinity JCAR021-T cells treated mice displayed only intermediate CRS severity irrespective of the applied dose levels (Fig. 4f). Similarly, when we analyzed serum cytokine levels, we observed a clear dose-dependent effect for the high-affinity CAR but not for the lower-affinity CAR-T treated mice (Fig. 4g). Regarding anti-tumor effects, both doses of JCAR017-T cells successfully eradicated the tumor, with faster response rates at the highest dose, while low-affinity CAR-T cells were less effective. Nevertheless, a high dose did provide a noticeable benefit compared to untreated mice, as observed before (Fig. 4h, i). We identified that CRS development and cytokine production aligned with the degree of T-cell expansion at early time points (day five). JCAR017-T cells displayed the strongest expansion in a dose-dependent manner, followed by the high- and low-doses of JCAR021-T cells (Fig. 4j).
In summary, lowering the binding strength of the CAR can reduce the severity of CRS, although at the cost of functionality. Remarkably, CAR-T-cell dose seems to correlate with the toxicity profile of high-affinity but not low-affinity receptors.
High-affinity CAR-T cells show fewer signs of toxicities and exhaustion when combined with low-affinity CARs in vitro
Next, we explored the possibility of creating a CAR-T-cell product with improved characteristics by combining the potency of high-affinity receptors with the safety profile and longevity of lower-affinity receptors. For this purpose, we evaluated the cytokine release of affinity-combined CAR-T-cell products composed of an equal amount of the high-affinity JCAR017-T cells and lower-affinity CAR-T cells (JCAR021, S168C or S227K) after co-culture with CD19+ target cells and donor-matched monocytes. These mixed products were compared with two JCAR017-T-cell controls: one matched for the total CAR-T-cell dose and one matched for the number of JCAR017-T cells present in the affinity-combined product. (Fig. 5a). To distinguish between CAR constructs, an Ametrine fluorescent protein was co-expressed with the JCAR017-CAR. After 24 h of co-culture, absolute cell numbers of CAR-T cells were comparable among the different groups (Fig. 5b), with a balanced composition of the high- and low-affinity CAR-T cells in the combined products (Fig. 5c). While all CAR groups showed similar CD19-specific target lysis, the mixed products induced significantly lower levels of CRS-associated cytokines than the same total dose of JCAR017-CAR T cells alone and exhibited cytokine release comparable to the half-dose JCAR017 control (Fig. 5d, e). These observations indicate that adding lower-affinity CAR-T cells does not increase toxicity beyond what is expected from reducing high-affinity CAR T-cell numbers.

a–e CAR-T cells were co-cultured with CD19+ K562 and donor-matched monocytes using a ratio of 2:1:1 for 24 h prior analysis. a Schematic of the in vitro experimental setup for evaluating CRS. b Absolute CAR-T-cell counts and c frequencies of Ametrine+/− across treatment groups. d CD19+ K562 target cell lysis. e Supernatant cytokine concentrations (IFN-γ, IL-10 and IL-6). Data are background-subtracted normalized to JCAR017. f–k CAR-T cells were cultured with CD19+ Nalm-6 cells for 13 days, with repetitive supplementation of fresh target cells every second day. f Schematic of the experimental setup for chronic antigen exposure. g Expansion kinetics of differently composed CAR-T-cell products. h Expansion of high-affinity (JCAR017) and lower-affinity (JCAR021, S168C, S227K) CAR-T cells cultured individually or in combination based on the expression of Ametrine. i Temporal composition of the affinity-combined CAR-T-cell products. Data in (g–i) are depicted as mean + SD of one representative experiment with technical triplicates (n = 4–5). j Expression of exhaustion markers (PD1, Lag3, TIM3 and TIGIT) following chronic antigen exposure at 13 days post-exposure, following five antigen addition cycles. k Co-expression of TIGIT/PD1 and TIGIT/TIM3 on JCAR017 and JCAR021 CAR-T cells alone or in combination. Data in (b–e) are represented as mean + SD of (JCAR017 and JCAR021, combination n = 4, S168C, S227K, combination and 0.5 JCAR017 n = 3) biological replicates. Data in (e) and (j, k) are normalized to JCAR017 and shown as mean + SD. Each individual dot represents the mean of three technical replicates (n = 5; S168C n = 4). Statistical analyses were performed by one-way ANOVA (b, d, e, j, k), or two-way ANOVA (g–i) with multiple comparison using JCAR017 as reference. *p < 0.05, **p ≤ 0.01, ***p ≤ 0.001, ****p ≤ 0.0001 using the JCAR017 group as a reference control.
We then aimed to investigate the potential benefits of an affinity-combined CAR-T-cell product after prolonged antigen exposure. To do this, we performed chronic antigen stimulation assays and assessed expansion and longevity potential of the individual CARs compared to the affinity-combined T-cell products (Fig. 5f). The combined-affinity products expanded similarly to high- and lower-affinity CAR-T cells alone (Fig. 5g). Notably, lower-affinity CAR-T cells showed higher expansion kinetics under chronic stimulation regardless of the supplementation of high-affinity CAR-T cells, thus reaching the majority in the combined cell product (Fig. 5h, i). We then examined the expression of PD-1, Lag3, TIM3, and TIGIT to assess the level of exhaustion. All four markers showed significantly higher levels in the high-affinity JCAR017-T cells compared to both the lower-affinity and combined T-cell products (Fig. 5j). Remarkably, the proportion of TIGIT+ TIM3+ and TIGIT+ PD-1+ cells was reduced in JCAR017-T cells when used in combination with lower-affinity T cells, as opposed to when JCAR017-T cells were used individually (Fig. 5k). Finally, we assessed whether the affinity-combined product can retain similar anti-tumor activity to high-affinity CAR-T cells alone. We therefore focused on the two ultra-low-affinity variants (V236W and V236F) that exhibited impaired in vitro cytotoxicity under conditions of low E:T ratios and low antigen density (Fig. S4). Notably, the combined products rescued the suboptimal cytotoxic capacity observed with low-affinity CAR-T cells alone, achieving levels of target cell killing comparable to the same dose of high-affinity CAR-T cells but exceeding those of the 0.5× dose JCAR017 control, particularly under stringent conditions of low E:T ratios and low antigen density (Fig. S10). To extend our findings, we evaluated an additional pair of high- and low-affinity CARs recognizing the same epitope on the human ROR1 antigen—CAR R12 (high-affinity, KD = 0.11 nM) and CAR R12v20 (lower-affinity, KD = 0.98 nM)57 (Fig. S11a). Similar to the CD19 model, a 50:50 combination of high- and low-affinity CAR-T cells achieved cytotoxicity comparable to full-dose high-affinity R12 CAR-T cells while outperforming lower-affinity R12v20 CAR-T cells (Fig. S11b, c), and exhibited significantly lower exhaustion levels than high-affinity CAR-T cells after chronic stimulation (Fig. S11d).
Overall, the affinity-combined cell product mitigated CRS severity, limited exhaustion in high-affinity CAR-T cells, and preserved functionality, with particular resilience against functionality loss when targeting cells with low antigen expression.
High-affinity CAR-T cells show superior functionality and fewer signs of exhaustion when administered with low-affinity CARs in vivo
We next explored the potential of an affinity-combined CAR-T-cell product in vivo. We first evaluated whether the suboptimal tumor control observed with low-dose high-affinity CAR-T cells could be rescued by higher doses of low-affinity CAR-T cells (Fig. S12a). This strategy was designed to minimize CRS, as CRS severity correlated with the dose of high-affinity—but not low-affinity—CAR-T cells (Fig. 4). While JCAR017-T cells alone delayed tumor growth, the combination with JCAR021-T cells produced a dose-dependent reduction in tumor burden. Nevertheless, a significant effect emerged only at particularly high doses of JCAR021-T cells (16-fold higher than JCAR017) (Fig. S12b, c), indicating the importance of maintaining adequate levels of high-affinity CAR-T cells for achieving effective anti-tumor responses.
Furthermore, we conducted experiments applying constant cell doses, consisting of either equal amounts or varying ratios of high- and low-affinity CARs (Figs. 6a and S13a). As observed in our previous experiments, survival did depend on the transfer of even low doses of JCAR017-T cells (Fig. 6b). Residual tumor burden further decreased based on the quantity of transferred JCAR017-T cells (Figs. 6c and S13b). Remarkably, a 1:1 ratio of JCAR017 to JCAR021 exhibited a more rapid anti-tumor response compared to JCAR017 alone (Figs. 6c and S13b), which we validated in an independent experiment (Fig. S12d, e). While JCAR017-T cells exhibited dose-dependent expansion kinetics, the same dose (0.8 × 10⁶ cells) expanded differently depending on whether it was administered alone or in combination with low-affinity CAR-T cells, with JCAR017-T cells expanding and infiltrating the bone marrow less when combined with JCAR021-T cells (Figs. 6d and S13c). These findings indicate that the observed faster tumor clearance mediated by the affinity-combined product is likely attributable to a synergistic interaction between the high- and low-affinity CAR-T cells, rather than the overall higher T-cell dose. Our data also demonstrate that the behavior of high-affinity CAR-T cells can be modulated by addition of lower-affinity CAR-T cells, even when the high-affinity CAR T-cell dose remains at high numbers.

. a Experimental design for in vivo evaluation of affinity-combined CAR-T-cell products employing bulk CAR-T cells (n = 4). b Kaplan-Meier survival curve of mice treated with varying JCAR017 and JCAR021 combinations. c Residual tumor burden assessed by bioluminescence imaging (photons/second/cm²/steradian), shown as mean + SD. d Absolute CAR-T-cell numbers, including JCAR017 and JCAR021 isolated from the bone marrow (BM) at sacrifice. e Leiden clustering of EGFRt+ CAR-T cells isolated from BM of mice treated with JCAR017 alone or affinity combinations (50:50 and 90:10). f Volcano plot depicting upregulated genes in JCAR017 (blue) and JCAR017 form combined products (red). g Heatmap of exhaustion-related genes (n = 110) in JCAR017, as well as JCAR021 and JCAR017 from combined products. h Differential expression of exhaustion-related and i functionality-related genes in JCAR017 alone and JCAR017 of combined products. j Gene set enrichment analysis depicting exhaustion (top) and dysfunction (bottom) scores based on literature-defined gene sets. Each dot depicts an individual mouse. Data represent mean + SD (n = 4). Statistical significance was determined by two-way ANOVA (c) with JCAR017 as reference and Mann-Whitney U test (h-i). *p < 0.05, **p ≤ 0.01, ****p ≤ 0.0001.
To explore this further, we isolated the transferred CAR-T cells 30 days after infusion to ensure sufficient antigen exposure to capture relevant differences in the transcriptomic profile of JCAR017-T cells. Remarkably, the transcriptomic profiles of JCAR017-T cells strongly differed depending on whether the cells were administered individually or in combination with low-affinity CARs. CAR-T cells isolated from mice treated with JCAR017 alone were predominantly represented in cluster 1, whereas high-affinity JCAR017-T cells of the combined cell products were in cluster 0 and 6 (Figs. 6e and S13d, e). Genes over-expressed in JCAR017-T cells within the affinity-combined products collectively suggested active migration toward inflammatory sites and tissue residency (CXCR6 and ITGA1)58, together with sustained pro-inflammatory/cytotoxic responses (ALOX5AP, KLRD1, STAT, and JAK3). Along these lines, we further observed upregulation of genes related to increased energy demand and activation (MT-CO3 and FKBP1)59,60. In contrast, JCAR017-T cells alone exhibited traits of impaired memory T-cell formation and survival (downregulation of CD27, KLF2, and TNFSF4), metabolic shifts towards glycolysis (lower CMC1)61 and an enhanced effector phenotype (reduced IL10RA, and SIRPG)62,63,64. Altogether, this profile indicated highly activated effector T cells prone to an immediate response rather than sustaining long-lived memory cells (Fig. 6f). Notably, when considering a set of 262 genes linked to T-cell exhaustion and dysfunction65,66, JCAR017-T cells administered alone showed higher levels of several exhaustion-related genes compared with the affinity-combined cohorts, which displayed upregulation of only a few exhaustion-associated genes and showed a profile more similar to the lower-affinity CAR-T cells (Fig. 6g). Interestingly, the shift toward a less exhausted phenotype in high-affinity JCAR017-T cells became progressively more pronounced from the 10:90 to the 50:50 combination ratios. This trend is likely attributable to increased antigen pressure on JCAR017-T cells when delivered at lower doses, as further supported by the higher residual tumor burden observed under these conditions (Fig. 6c). Accordingly, key exhaustion-associated genes, such as CCL5 and TOX, were expressed at significantly lower levels in JCAR017-T cells from the 50:50 combination (Fig. 6h). Conversely, the expression of genes implying greater cytotoxic potential (KLRD1, SCML4 and GZMB) was increased in affinity-combined JCAR017-T cells (Fig. 6i), resulting in reduced exhaustion and dysfunctional scores, most notably in the 50:50 dosing condition (Fig. 6j). These data were in line with in vitro observations (Fig. 5j, k).
Overall, our findings suggest that the enhanced tumor clearance observed with the affinity-combined product could be driven by a synergistic interaction between high- and low-affinity CAR-T cells, rather than by the overall higher T-cell dose. Our data also demonstrate that the behavior of high-affinity CAR-T cells can be modulated by the addition of lower-affinity CAR-T cells, even when the high-affinity CAR-T-cell dose remains at high numbers. Collectively, our data demonstrate that low-affinity CAR-T cells augment the anti-tumor efficacy of high-affinity CAR-T cells by preserving their functional state and mitigating terminal differentiation and exhaustion.