
BLIMP1 deficient B cells undergo more robust GC response
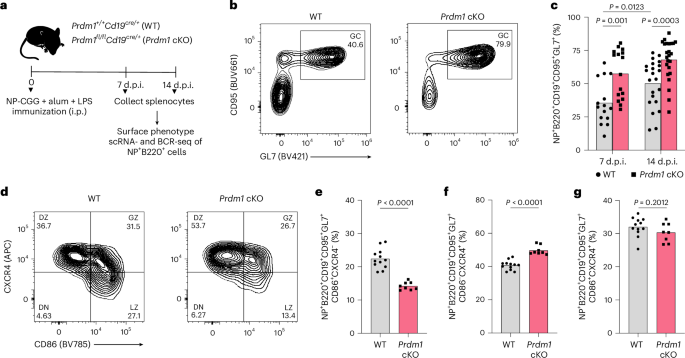
To test the hypothesized function of Blimp-1 in GC B cells, we used Prdm1fl/flCd19cre/+ (Prdm1 cKO) and Prdm1+/+Cd19cre/+ (wild type (WT)) mice and analyzed their GC responses under steady-state conditions and after immunization with (4-hydroxy-3-nitrophenyl)acetyl–chicken gamma globulin (NP–CGG), alum and lipopolysaccharide (LPS) (Fig. 1a). Loss of BLIMP1 resulted in increased numbers of GC B cells at steady state and at 7- and 14-days postimmunization (d.p.i.) with NP–CGG (Extended Data Fig. 1a). BLIMP1 deficiency also led to increased numbers and frequencies of CD80+ and PD-L2+ memory B cells23 at both 7 and 14 d.p.i. (Extended Data Fig. 1b,c), consistent with the expanded GC response and indicating that BLIMP1 deficiency also enhances post-GC differentiation toward the memory fate. As anticipated, frequencies and numbers of NP+ GC B cells were increased in Prdm1 cKO mice at 7 and 14 d.p.i. (Fig. 1b,c and Extended Data Fig. 1d,e).

a, Experimental design for analyzing frequencies, single-cell transcriptional states and BCR sequences of NP-specific B cells elicited by immunization of WT and Prdm1 cKO mice. b, Representative flow plots showing the frequency of NP+ GC B cells in WT (left) and Prdm1 cKO (right) mice (14 d.p.i.). c, Frequencies of NP+ GC B cells in WT (n = 15) and Prdm1 cKO (n = 16) mice at 7 d.p.i. and WT (n = 22) and Prdm1 cKO (n = 24) mice at 14 d.p.i. d, Representative flow cytometry plots showing the frequencies of DN (double negative), LZ, GZ and DZ GC B cells in WT and Prdm1 cKO mice. e–g, Frequencies of NP-specific LZ, DZ and GZ GC B cells in WT (n = 12) and Prdm1 cKO (n = 8) mice (14 d.p.i.), respectively. e, CD86+CXCR4−. f, CD86−CXCR4+. g, CD86+CXCR4+. Each symbol in c, and e–g represents an individual mouse. Data in b and c are from three different experiments and d–g are from two independent experiments. Statistical significance was tested by two-tailed Mann–Whitney test (c and e–g).
Source data
To determine whether this overall expansion was accompanied by changes in the cellular composition of GC compartments, we examined the distribution of LZ, DZ and gray zone (GZ)24 GCBCs. Although absolute numbers of LZ, DZ and GZ GC B cells were increased in the Prdm1 conditional knockout (cKO) mice; this was accompanied by a decreased relative frequency of LZ GC B cells and increased frequency of DZ GC B cells. The frequency of the GZ population remained unchanged (Fig. 1d–g and Extended Data Fig. 1f–h). To confirm B cell-intrinsic functions of BLIMP1, we generated bone marrow chimeras by reconstituting irradiated recipients with WT and Prdm1 cKO bone marrow. The GC expansion phenotype was reproduced, demonstrating that BLIMP1 constrains the GC response in a B cell-intrinsic manner (Extended Data Fig. 1i,j). These results were consistent with the hypothesis that BLIMP1 constrains the GC response during the LZ to DZ transition.
scRNA-seq reveals BLIMP1 constrains LZ to DZ transition
To analyze the impact of BLIMP1 perturbation on transcriptional programming during the LZ to DZ transition, we performed single-cell RNA sequencing (scRNA-seq) on NP-specific B cells7 at 14 d.p.i. Analyses of the WT scRNA-seq datasets using the ICGS2 computational pipeline25 identified five distinct cell clusters that could be distinguished based on biologically informative marker genes (Fig. 2a, Extended Data Fig. 2a and Supplementary Table 1). Within the two LZ clusters, LZ-1 manifested the highest expression of B cell activation markers, including Gpr183, Cd55 and Cd38. In contrast, LZ-2 showed elevated expression of genes involved in antigen presentation and BCR signaling, including Cd83, H2-DMa, H2-Oa and Nfkbia. The two DZ clusters, DZ-1 and DZ-2, resolved cells within the G1–S and G2–M phases of the cell cycle, respectively. DZ-1 was characterized by high expression of DNA replication genes (Mcm5, Mcm7 and Pcna), whereas DZ-2 manifested higher expression of mitotic components and their regulators, including Cenpf, Ccnb1 and Cdk1 (Fig. 2a and Supplementary Table 2). Notably, the analysis identified a distinctive GCBC cluster, herein termed transition zone (TZ), which exhibited elevated expression of ribosomal biogenesis and translation genes, including Npm1, Nop58, Fbl and Eif5a (Fig. 2a,b and Supplementary Table 2). Consistent with this transcriptional module, TZ cells showed the highest expression of Myc target genes, highlighting their importance as key intermediates that integrate activation and proliferation cues during the transitioning of LZ cells into the DZ26,27 (Fig. 2c). Gene signature analyses using curated GC B cell genesets7 substantiated the conclusion that the TZ cluster represents an intermediate state, as the cells displayed the highest Myc score and also an increase in G1–S associated genes compared with LZ cells (Extended Data Fig. 2b–d). We note that a subset of TZ cells also expressed increased levels of transcripts that have been associated previously with cells transitioning from the LZ to the DZ, termed GZ GCBC24 (Fig. 2d, Extended Data Fig. 2e,f and Supplementary Table 3). To substantiate the developmental trajectory inferred by the annotations of the ICGS2 clusters based on their marker genes, we performed RNA velocity using scVelo28, which leveraged the dynamics of spliced and unspliced transcripts. This analysis supported the inference that TZ cells arise from LZ-2 and give rise to DZ-1 cells (Fig. 2e). We also performed analyses of the scRNA-seq dataset using Monocle 229, which reinforced the inference that TZ cells reflect an intermediate state between LZ and DZ compartments (Extended Data Fig. 2g).

a, scRNA-seq analysis of splenic NP+B220+ cells isolated at 14 d.p.i. from WT mice (n = 3). Heatmap was generated using cluster-specific marker genes delineated by the MarkerFinder algorithm in AltAnalyze (Methods). Columns in heatmap represent cells (n = 28,809); rows represent MarkerFinder genes (n = 300). Select MarkerFinder genes for each cell cluster are displayed on right of Heatmap. Cell clusters were generated using ICGS2 within AltAnalyze and annotated with their inferred genomic states. b,c, Barplots displaying key GO pathways (b) and TF target genes from the ChEA datasets (c) associated with the top 60 genes in the TZ state. d, Violin plots displaying the GZ signature scores for the cell clusters indicated. e, Developmental trajectory of GC B cells constructed by scVelo on two-dimensional UMAP space (Methods). f–i, Barplots displaying key Reactome pathways and TF target genes from the ChEA datasets associated with the upregulated DEGs (Prdm1 cKO versus WT) in LZ-2 (reactome (f); ChEA (h)) and TZ (reactome (g); ChEA (i)) states. j, Plot displaying the G1–S signature scores across indicated cell clusters in WT and Prdm1 cKO mice (14 d.p.i., n = 3) (Methods). k,l, Violin plots displaying log1P(cp10k)-normalized expression of Nr4a1 (k) and Prdm1 (l) in nonzero expressing cells across the indicated cell clusters. m, Scatter plot displaying Prdm1 versus Nr4a1 expression in nonzero expressing cells. Spearman’s correlation and two-tailed P values are indicated. Each dot (e) represents an individual cell. Selected genes within pathways are displayed in b, c and f–i. Data in a–m are from three different experiments. Statistical significance was tested by one-tailed Fisher’s Exact test and Benjamini–Hochberg method for correction of multiple-hypotheses testing (b, c, f–i), two-tailed Mann–Whitney test (j) and two-tailed Kruskal–Wallis with Dunn’s multiple comparison test (d, k, l).
Next, cellHarmony was used to align the Prdm1 cKO GC B cells with their WT counterparts30 (Extended Data Fig. 2h). Consistent with the phenotypic analysis, the relative frequency of Prdm1 cKO DZ GC B cells was increased in relation to their LZ counterparts (Extended Data Fig. 2i). Furthermore, scRNA-seq analysis suggested that the inversion of LZ and DZ frequencies may occur within TZ cells. To explore the molecular mechanisms by which BLIMP1 impacts GC state transitions, we performed differential gene expression analyses. In keeping with the dominant molecular actions of Blimp-1 as a transcriptional repressor we observed a larger number of upregulated compared with downregulated differentially expressed genes (DEGs), that is, 749 and 260, respectively (Supplementary Table 4). The largest number of upregulated DEGs were observed in the LZ-2 and TZ clusters (Extended Data Fig. 2j). In the LZ-2 cluster, Prdm1 cKO GC B cells exhibited enrichment of genes involved in BCR signaling and translation (Fig. 2f and Supplementary Table 5). In contrast, genes associated with the G1–S transition, DNA replication and cell-cycle progression were upregulated in the TZ cluster (Fig. 2g and Supplementary Table 5). Notably, both clusters showed increased expression of genes known to be regulated by the TFs MYC, SPI1 (PU.1) and IRF8 (Fig. 2h,i and Supplementary Table 5). Consistent with the above analyses, the G1–S signature scores were increased in TZ and DZ-1 clusters (Fig. 2j). Taken together these transcriptional alterations agreed with the hypothesized function of Blimp-1 as a negative feedback regulator, the absence of which in the LZ results in enhanced BCR signaling and precocious programming of Myc-mediated protein translation and the G1–S transition.
Expression of BLIMP1 in GC B cells was reported previously as low and sparse31,32. To determine whether Prdm1 expression is in accord with its proposed function in constraining the LZ to DZ transition, we quantified the expression of Prdm1 across various WT GC clusters in comparison with Nr4a1. In keeping with its induction during B cell activation as a consequence of BCR signaling18, Nr4a1 transcripts were detected with the highest frequency (~30%) and median values in the LZ-1 cluster (Fig. 2k and Extended Data Fig. 2k). We note that Nr4a1 expression was not impacted in Prdm1 cKO GC B cells (Supplementary Table 4). Although Prdm1 transcripts were detected in only a small fraction of WT GC B cells (~1%), like Nr4a1, they manifested highest median values in the LZ-1 cells (Fig. 2l and Extended Data Fig. 2l). Prdm1 and Nr4a1 transcripts were correlated strongly in cells that displayed their coincident expression (Fig. 2m). Thus, despite sparse detection of Prdm1 transcripts in LZ cells, its expression pattern was consistent with its induction in BCR-activated LZ cells and in restraining the LZ to DZ transition not dependent on controlling Nr4a1 expression.
BLIMP1 attenuates affinity maturation and clonal dominance
The above results indicated that affinity maturation and clonal dominance in the GC may be accelerated with the loss of BLIMP1. To directly test this possibility, we leveraged single-cell BCR sequencing (scBCR-seq) data generated in parallel with the scRNA-seq. To analyze NP-specific GC B cell clones, we focused on those harboring the VH186.2 heavy chain gene segment (IGHV1-72*01) rearrangements that dominate the NP-specific GC B cell response at its peak7,32 (Supplementary Table 6). The W33L amino acid substitution has been shown to increase NP-binding affinity of the BCR containing the IGHV1-72*01 gene segment by tenfold and represents the dominant mutation after positive selection during a peak GC response7. In keeping with the increased numbers and relative frequencies of NP-specific DZ GC B cells, we noted larger clone sizes and increased SHM within Prdm1 cKO GC B cells during the initiation of the GC B cell response (7 d.p.i.). However, enhanced affinity maturation was not observable at this early stage (Fig. 3a–c). As was the case at 7 d.p.i., the clonal sizes of the Prdm1 cKO GC B cells were significantly larger (14 d.p.i.) than their WT counterparts (Fig. 3d) suggesting that mutant cells in the DZ are expanded not only due to more efficient LZ to DZ transition but possibly due to faster cell-cycle times. In keeping with these observations, the mutation frequencies of the IGHV1-72*01 gene segment were also increased in Prdm1 cKO GC B cells at 14 d.p.i. (Fig. 3e). At the peak of the GC response, there was a significant increase in the frequency of W33L mutation-bearing clones in the absence of BLIMP1 (Fig. 3f).

a, scBCR-seq analysis for the numbers of cells in distinct IGHV1-72*01 clones in WT and Prdm1 cKO mice (7 d.p.i.). b, scBCR-seq analysis for the mutation frequencies within IGHV1-72*01 gene segments of GC B cells in WT and Prdm1 cKO mice (7 d.p.i.). c, Pie-charts displaying the proportion of IGHV1-72*01 gene segments harboring high affinity W33L mutations in splenic NP+B220+ cells of the genotypes indicated (7 d.p.i.). d, scBCR-seq analysis for the numbers of cells in distinct IGHV1-72*01 clones in WT and Prdm1 cKO mice (14 d.p.i.). e, scBCR-seq analysis for the mutation frequencies within IGHV1-72*01 gene segments of GC B cells in WT and Prdm1 cKO mice (14 d.p.i.). f, Pie-charts displaying the proportion of IGHV1-72*01 gene segments harboring high affinity W33L mutations in splenic NP+B220+ cells of the genotypes indicated (14 d.p.i.). g–i, Clonal diversity of BCR sequences in WT and Prdm1 cKO GC B cells (14 d.p.i.). g, Lorenz plots displaying the clonal distributions, skewed curves reflect clonal diversity. h,i, Barplots displaying the Gini index values (h) and the Shannon entropy scores (i) for the BCR repertoires, respectively. Samples were collected from WT (n = 3) and Prdm1 cKO (n = 3) mice at 14 d.p.i. and WT (n = 1) and Prdm1 cKO (n = 1) mice at 7 d.p.i. For comparison across samples in h and i, data were rarefied to a common paired-cell depth per sample, computed with 95% CIs and represented as mean values. Data in d–i are from three different experiments. Statistical significance was tested by two-tailed Mann–Whitney test (a, b, d and e) and Chi square test (c and f).
To analyze clonal dominance, we enumerated all clonotypes based on their paired IgH and IgL sequences in WT or Prdm1 cKO NP-specific B cells. We then constructed Lorenz curves that display cumulative fraction of cells versus cumulative fraction of clonotypes, after ranking clonotypes from smallest to largest. In such an analysis, a repertoire with every clonotype being equally represented would generate a perfectly uniform distribution represented by a diagonal (Fig. 3g and Supplementary Table 7). As expected for nonuniform Ig repertoires, both the WT and Prdm1 cKO distributions were displaced from the diagonal. The Prdm1 cKO distribution showed greater skewing from the diagonal, indicating that a smaller subset of clonotypes was accounting for a large fraction of cells (14 d.p.i.). Next, we used the Gini coefficient to quantify this skewing based on area defined by the observed Lorenz curve and the diagonal. Values of the Gini coefficient can range from 0 (uniform repertoire) to 1 (maximal clonal dominance with all cells being of a single clonotype). The Gini coefficient for Prdm1 cKO NP-specific Ig repertoire was substantially higher than that of WT cells (Fig. 3h), thereby providing evidence for clonal dominance. As a complementary Ig repertoire diversity metric, we computed Shannon entropy scores for the two distributions. In contrast with the Gini index, Shannon entropy increases with number of clonotypes and uniformity in their distributions. As expected, Shannon entropy values were lower for the Prdm1 cKO repertoires (Fig. 3i). Together, these data show that, in the absence of Blimp-1, affinity maturation and clonal dominance are enhanced at the peak of the GC response (14 d.p.i.).
To test the increased cell seeding model for GC expansion caused by the loss of Blimp-1, we analyzed clonal diversity at 7 d.p.i., during the initiation of the GC response. If increased seeding was accounting for the phenotype, we expected to observe a broader initial BCR repertoire diversity in Prdm1 cKO mice. Instead, we observed reduced clonal diversity at 7 d.p.i., indicating early clonal restriction (Extended Data Fig. 3a–c and Supplementary Table 7). This finding argues against increased GC seeding as a principal mechanism underlying the Prdm1 cKO phenotype.
BLIMP1 constrains accessibility at interferon-stimulated response element and EICE motifs
To analyze the molecular consequences of BLIMP1 action on chromatin accessibility and to infer its target genes in GC states, we performed single-cell Multiome sequencing (scMultiome-seq), jointly profiling gene expression and chromatin accessibility using NP+B220+ splenocytes isolated from WT and Prdm1 cKO mice (14 d.p.i.). Probabilistic multimodal models for integrated regulatory analysis (MIRA)-based joint topic modeling33, which involves representation of each cell according to weighted mixtures of gene expression and chromatin accessibility, revealed six discrete clusters, C1–C6 (Fig. 4a). Gene expression and chromatin accessibility topics that were specific for clusters C1–C6 are displayed in Fig. 4b,c and their associated genes and chromatin coordinates are provided (Supplementary Table 8). Notably, a subset of C4 cells displayed the highest Myc gene signature score (Fig. 4d). To compare the scMultiome-defined clusters with those delineated by scRNA-seq analysis, we calculated their ICGS2 gene signature scores derived from the top 60 marker genes. Multiome clusters C1 and C2 exhibited the highest LZ-1 signature scores, C3 showed the highest LZ-2 scores, C4 showed the highest TZ scores, C5 exhibited the highest DZ-1 scores and C6 exhibited the highest DZ-2 scores (Extended Data Fig. 4a–e). The corresponding violin plots demonstrate that scMultiome-derived clusters recapitulate faithfully the transcriptional signatures of the scRNA-seq-defined clusters in the WT cells. The scRNA-seq-defined clusters will be designated as ‘states’ hereafter. Consistent with the cellHarmony analysis, which showed an increased relative representation of DZ over LZ GC B cells in Prdm1 cKO mice, we observed altered proportions of scMultiome clusters based on ICGS2 signature scoring, further confirming that Blimp-1 deficiency skews GC composition toward the DZ fate (Extended Data Fig. 4f). Support vector machine (SVM) classification34 was used to analyze the correspondence between the six WT multiome clusters with the five reference scRNA-seq states more comprehensively (Fig. 4e–g and Extended Data Fig. 4g,h). Multiome clusters C1 and C2 were enriched for the LZ-1 state, C3 for LZ-2, C4 for TZ, C5 for DZ-1 and C6 for DZ-2. As was the case for scRNA-seq, multiome clusters derived from Prdm1 cKO cells showed an overall correspondence with their WT counterparts, suggesting preservation of global GC state identities despite the perturbation. SVM classification was next used to infer alterations in relative frequencies of GC states because of the perturbation. The Prdm1 cKO C3 cells manifested a reduction in relative frequency of LZ-2 classified cells with an increase in DZ-1 classified cells (Fig. 4h). Similarly, Prdm1 cKO C4 cells displayed a reduction in relative frequency of TZ classified cells with an increase in DZ-1 cells (Fig. 4i). Thus, Prdm1 cKO LZ-2 and TZ cells exhibited DZ-like features. Overall, these results were consistent with the scRNA-seq analysis, collectively demonstrating that Blimp-1 loss enhances LZ to TZ and TZ to DZ state transitions. Consistent with this interpretation, analysis of alterations in chromatin accessibility revealed a substantial increase in upregulated differentially accessible regions (DARs) (upDARs) in the C3 and C4 Prdm1 cKO clusters compared with C1 and C2 (Fig. 4j). Many of these upDARs were associated with G1–S genes whose expression was increased in C3 and C4 Prdm1 cKO cells.

a, NP+B220+ cells isolated at 14 d.p.i. from WT and Prdm1 cKO mice were profiled by scMultiome-seq (n = 15,155). A UMAP plot displaying six clusters (C1–6) was generated using MIRA and joint topic modeling of both RNA and ATAC features (WT = 4,764 and Prdm1 cKO = 10,391). b,c Heatmaps showing relative prominence (z-score of average weight) of each gene expression (b) or accessibility (c) topic within designated cell clusters (a). d, UMAP displaying the Myc gene signature score across the multiome-seq clusters. e–g, Violin plots displaying the distribution of indicated ICGS2-delineated transcriptional states (y axis), LZ-2 (e), TZ (f) and DZ-1 (g), across the six scMultiome-seq defined clusters (x axis) in WT and Prdm1 cKO GC B cells. Probabilities were determined by SVM classification. h,i Barplots displaying the frequency of WT and Prdm1 cKO GC B cells within the C3 (h) and C4 (i) clusters that were assigned to indicated ICGS2-transcriptional states, as determined by SVM classification. j, Barplot displaying the number of upregulated DARs for the scMultiome-seq clusters in Prdm1 cKO indicated compared with their WT counterparts (14 d.p.i.). Statistical significance was tested by two-tailed Fisher’s Exact test 2 × 2 contingency table (h,i).
To analyze TF motif contributions to chromatin structure in WT GCBCs and their perturbations in the Prdm1 cKO counterparts at base-pair resolution, we utilized ChromBPNet35. The deep learning model predicts TF motif activity while accounting for Tn5 transposase cutting bias. This approach enabled the systematic identification of TF motifs underlying chromatin accessibility changes during GC B cell state transitions. The scMultiome dataset was used to train cluster-specific ChromBPNet models on pseudobulk assay for transposase-accessible chromatin using sequencing (ATAC)-seq profiles derived from a given GC B cell cluster. Each of these cluster-specific models was then used to generate corresponding base-pair resolution contribution score (CS) predictions across the union set of ATAC-seq peaks. These cluster-specific CS tracks revealed short DNA sequences, referred to as ‘seqlets,’ that were predicted to be important in determining the accessibility profiles of their corresponding ATAC-seq peaks. Strikingly, many of the ChromBPNet seqlets corresponded to known TF motifs, thereby implicating action of cognate TFs in binding to such sequences and controlling chromatin accessibility (Supplementary Table 9). Single-nucleotide CS predictions for selected motifs, aggregated across all instances of their occurrence within accessible chromatin regions, are shown for each WT GC B cell cluster (Fig. 5a). The analysis inferred dynamic action of TFs induced by several pathways in regulating chromatin accessibility across GC B cell states with an increase in NFKB, MYC and POU activity preceding that of AP-1 (BATF).

a, Aggregated ChromBPNet-derived CS signals at selected TF motifs for indicated WT GC B cell clusters within all peaks. Motif instances were identified by HOMER. Position-weight matrix logos are displayed. b,c, Barplots displaying the relative increase in indicated seqlets predicted by ChromBPNet within the upregulated DARs in the C3 (b) and C4 (c) cluster of Prdm1 cKO GC B cells. Statistical significance was tested by two-tailed Fisher’s Exact test and Benjamini–Hochberg method for correction of multiple-hypotheses testing (b,c).
Source data
We next measured the enrichment of TF motif family seqlets in the upregulated DARs of Prdm1 cKO GC B cells (Supplementary Table 10). The upregulated C3 and C4 DARs were enriched for seqlets that matched EICE and interferon-stimulated response element (ISRE) motifs known to be bound by PU.1/SPIB:IRF4/IRF8 and IRF1/IRF2, respectively as well as BLIMP1 (Fig. 5b,c). BLIMP1 has been shown to antagonize the forementioned activators binding to EICE and ISRE motifs by recognition of an overlapping DNA sequence36,37. Furthermore, we also observed enrichment for PAX, NFkB and POU motif seqlets in these regions that predicted increased activities of their cognate TFs in the absence of BLIMP1. These findings indicated a chromatin gating function of BLIMP1 in the G1–S transition during which it antagonizes the action of constitutively expressed as well as signaling-induced TFs in GC B cells.
BLIMP1 represses expression of BCR-signaling genes in GC B cells
To distinguish the primary and secondary effects of loss of BLIMP1 on chromatin accessibility and gene expression, we sought to identify its direct transcriptional targets by integrating DEGs with ChromBPNet seqlet predictions and upDARs (Fig. 6a). A shared set of DEGs from the multiome-seq and scRNA-seq (Supplementary Table 11) enabled the identification of presumptive BLIMP1-repressed target genes. These genes (n = 380) were upregulated in the absence of BLIMP1 and were associated with one or more ISRE, EICE or BLIMP1 motif seqlets within an OCR that was +200 kb upstream of their transcription start site (TSS) (Fig. 6b,c and Extended Data Fig. 5a–d). Within this target geneset we identified those that were associated with one or more upDARs (n = 154) that in turn contained a BLIMP1-related motif seqlet (n = 23) (Supplementary Table 11).

a, Schematic rationale for identification of BLIMP1 target genes within upregulated DEGs in Prdm1 cKO GC B cell clusters. Shared DEGS in scRNA-seq and multiome datasets (n = 557) were used for downstream analysis. Color codes indicate target genes based on specified criteria. BLIMP1 target genes were associated (TSS ± 200 kb) with one or more ISRE, EICE and BLIMP1 motif seqlets based on ChromBPNet models. These were annotated for association with one or more upDARs and ISRE, EICE and/or BLIMP1 motif seqlets located within them. Numbers outside parentheses denote the union of upregulated genes across the six clusters at each filtering step, whereas those in parentheses represent the genes overlaid with BLIMP1 ChIP–seq peaks from LPS-activated B cells (Methods). b, Volcano plots displaying BLIMP1 target genes for the scMultiome-seq C3 cluster. c, Volcano plots displaying BLIMP1 target genes for the scMultiome-seq C4 cluster. Selected BLIMP1 target genes are displayed in b,c. d,e, Barplots displaying key reactome pathways associated with the Blimp-1 target genes identified by ChromBPNet seqlets (d) and ChromBPNet seqlets associated with one or more DARs (e). Selected genes from the pathway enrichment analysis are highlighted. Asterisks indicate Blimp-1 target genes containing ISRE, EICE and/or Blimp-1 ChromBPNet seqlets within an associated upregulated DAR. f, Experimental design for phospho-flow analysis of pSYK (Y319), pLYN (Y507) and pBTK (Y223) in freshly isolated, unstimulated GC B cells from WT (n = 9) and Prdm1 cKO (n = 10) mice (14 d.p.i.). g, Barplots displaying the frequencies of pSYKhi (Y319) GC B cells from WT and Prdm1 cKO mice. h, Barplots displaying the frequencies of pLYNhi (Y507) GC B cells from WT and Prdm1 cKO mice. i, Barplots displaying the frequencies of pBTKhi (Y223) GC B cells from WT and Prdm1 cKO mice. Data in g–i are from two different experiments. Statistical significance was tested by one-tailed Fisher’s Exact test and Benjamini–Hochberg method for correction of multiple-hypotheses testing (d and e) and two-tailed unpaired t-test (g–i).
Source data
To assess independently whether these targets could reflect direct BLIMP1 binding, we integrated our DEG and chromatin accessibility as well as ChromBPNet analyses with BLIMP1 chromatin immunoprecipitation sequencing (ChIP–seq) dataset from LPS-activated B cells36. We recognized that the BLIMP1 binding regions were profiled in activated B cell and plasmablast contexts but reasoned that their convergence with our ChromBPNet analyses of BLIMP1 binding in accessible chromatin regions in GC B cells would nevertheless corroborate their delineation as direct targets. A substantial fraction of genes identified at each filtering step overlapped with BLIMP1 ChIP–seq peaks, including 16 of the 23 genes associated with BLIMP1-seqlet–containing upDARs (Fig. 6a and Supplementary Table 11; Methods). Notably, these ChIP-validated targets included key components of the BCR-signaling cascade for example, Syk, Lyn, Grb2, and Itpr2, and cell-cycle regulators, for example, Ccnd3, Mcm4, Rfc4 and Pold4. BLIMP1 binding was corroborated both at proximal and distal regulatory regions harboring ISRE, EICE or BLIMP1 motifs. Geneset enrichment analysis of these BLIMP1 targets revealed significant overrepresentation of pathways involved in BCR signaling and G1–S progression (Fig. 6d,e and Supplementary Table 12). The coordinated derepression of several genes within the BCR-signaling pathway, together with evidence for BLIMP1 occupancy at their regulatory elements, supports a model in which BLIMP1 constrains BCR signaling directly during GC selection.
To test whether BLIMP1-dependent repression of BCR-signaling genes was reflected at the protein activity level, we performed phospho-flow cytometry at 14 d.p.i. We measured phosphorylated SYK (Y319), LYN (Y507) and BTK (Y223) in freshly isolated, unstimulated GC B cells. Subsets of Prdm1 cKO GC B cells displayed significantly elevated baseline phosphorylation of all three kinases compared with WT cells (Fig. 6f-i and Extended Data Fig. 5e), demonstrating that the enhanced BCR-signaling potential predicted by chromatin accessibility changes was reflected by increased activities of several kinases downstream of the BCR. These results demonstrated that BLIMP1 functions to constrain BCR signaling.