
CR rewires the directionality of the human exoproteome toward longevity pathways
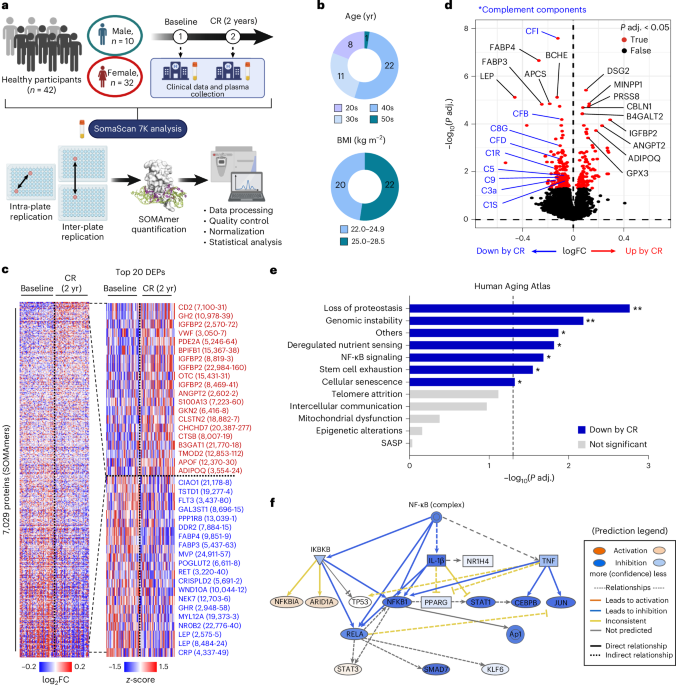
To investigate the impact of 2 years of mild CR on the exoproteome of middle-aged healthy individuals, we performed an unbiased proteomics analysis using the SomaScan 7K assay on longitudinal plasma samples from 42 CALERIE participants from the Pennington Biomedical Research Center cohort in Baton Rouge, Louisiana, collected at baseline and after 2 years of 14% CR (Fig. 1a). Most participants in this cohort were in their 30s and 40s and were not obese (BMI < 30 kg m−2), and they lost approximately 10% of their body weight after 2 years of CR (Fig. 1b and Extended Data Table 1). We detected a total of 7,029 proteins (SOMAmers) that passed quality control, and 262 proteins failed quality control (Fig. 1c and Supplementary Tables 1 and 2). Principal component analysis (PCA) showed that CR led to considerable changes in the plasma proteome of the participants (Extended Data Fig. 1a).

a−f, SomaScan 7K proteomics was performed in the plasma of healthy individuals at baseline and at 2 years after 14% CR (n = 42 per group, biological replicates). a, Schematic diagram of the overall study design. b, Age (top) and BMI (bottom) of participants. c, Heatmaps for all detected proteins (n = 7,029; left) and the top 20 increased or decreased differentially expressed proteins (DEPs) (right). d, Volcano plot for the plasma proteomics analysis. limma was used for differential expression analysis. e, CR-associated changes in 12 hallmarks of aging pathways were analyzed, and a scoring analysis of each pathway was performed. Adjusted P values are as follows: 0.002, 0.007, 0.013, 0.015, 0.021, 0.028, 0.048, 0.076, 0.107, 0.420, 0.691 and 0.923, from top to bottom. A two-tailed paired t-test was performed. f, Prediction of upstream regulator analysis for NF-κB in IPA. Most of the NF-κB signaling-related molecules were reduced by CR. Panel a created in BioRender; Dixit, V. https://biorender.com/uzr0jjv (2026). FC, fold change; P adj., adjusted P value; yr, years.
To explore the CR-induced proteomic shifts in detail, we performed differential expression analysis. We found that insulin-like growth factor-binding protein 2 (IGFBP2) was one of the top increased proteins after CR, whereas other IGFBPs remained unchanged except for IGFBP5, which was reduced (Fig. 1c,d and Extended Data Fig. 1b−h). IGFBP2 and IGFBP5 may impact mechanisms of aging by lowering the insulin growth factor 1 (IGF-1) bioavailability and are related to reduced mortality29 and cellular senescence30, respectively. Although the circulating IGF-1 concentration upon CR in our cohort was not different, these findings confirm the importance of reduced IGF-1 bioavailability, a mechanism identified from long-lived mice31, for some beneficial effects of CR on aging in humans. In addition, CR significantly induced adiponectin levels but reduced leptin, fatty acid binding protein (FABP) 3 and 4 and growth hormone receptor levels, all of which are indicative of healthy aging (Fig. 1c,d and Extended Data Fig. 1i−m)32,33,34,35,36. Of note, even though the participants were healthy and did not have overt underlying inflammatory conditions, CR significantly decreased protein levels of complement components as well as other proinflammatory markers, such as C-reactive protein, tumor necrosis factor (TNF) and C-C motif ligand 1 (CCL1), but did not affect interleukin (IL)-1β and IL-6 levels in the plasma (Fig. 1d and Extended Data Fig. 1n−r).
A recent study established the Aging Atlas database, encompassing most of the hallmark pathways of aging based on previously published omics datasets37. We queried this database to examine the effects of CR on each aging hallmark pathway at the protein level. Interestingly, we found that none of the 12 aging hallmark pathways was increased, but more than half, including loss of proteostasis, genomic instability, deregulated nutrient sensing, nuclear factor-kappa B (NF-κB) signaling, stem cell exhaustion, cellular senescence and other aging-associated features, were significantly reduced by CR (Fig. 1e and Extended Data Fig. 1s). In particular, the prediction of upstream regulator analysis by Ingenuity Pathway Analysis (IPA) revealed that most of the NF-κB-regulated molecules were suppressed by CR (Fig. 1f), suggesting that plasma proteomics can reflect intracellular signaling hubs. These longitudinal analyses over 2 years of CR intervention in healthy individuals suggest reversal of some key aging hallmark signatures, particularly targeting both immune and metabolic pathways.
CR in humans slows adipose tissue proteomic aging clock
We next investigated the target organ(s) that may contribute to exoproteomic rewiring of aging hallmark pathways in humans after CR. To examine this, we used a recently developed algorithm, ‘organage’, which enables the estimation of organ-specific age using human plasma proteomics data38. This model first maps plasma proteins to putative organ sources based on organ-enriched expression features, defined as being more than four times higher in the organ of interest than in any other organ, in the Genotype-Tissue Expression project. It then uses these organ-enriched proteins to model organ-specific age and measures the gap between the chronological age and predicted age (Fig. 2a). Interestingly, based on these analyses, we found that CR significantly reduced the age gap only in adipose tissue but did not affect lung, kidney, artery, muscle and heart, and CR increased the age gap in the pancreas and intestine (Fig. 2b−i and Extended Data Fig. 2a−h).

a−n, Organ-specific aging signatures were analyzed based on the plasma proteome. a, Schematic diagram for the analysis pipeline. b−e, Linear regression analysis was performed to compare the predicted proteomic age before and after CR in adipose tissue (b), lung (c), pancreas (d) and intestine (e). f−i, Organ age gap was analyzed in adipose tissue (f), lung (g), pancreas (h) and intestine (i) (n = 42 per group, biological replicates). j, Summary of the changes in the delta z-scored organ age gap by CR. *P < 0.05. k−n, Volcano plots for the organ-specific proteins in adipose tissue (k), lung (l), pancreas (m) and intestine (n). Paired two-tailed t-tests were performed, and exact adjusted P values are presented. Panels created in BioRender: a, Dixit, V. https://biorender.com/arhxxj3 (2026); j, Dixit, V. https://biorender.com/8qqlssz (2026).
Because this algorithm predicts organ age based on the association of protein expression with age rather than a causal relationship, we plotted all the organ-enriched proteins to examine the actual effects of CR on organ aging. For adipose tissue, we confirmed that CR beneficially modulated the adipose proteome, as shown in the differential expression analysis, with increased adiponectin and decreased leptin and FABP4 levels (Fig. 2k). Similarly, in the lung, CR significantly reduced CCL18 (Fig. 2l), which was implicated in pulmonary fibrosis39. Notably, although the estimation of proteomic age showed that the age gaps in the pancreas and intestine increased after CR, it also does not rule out reverse causality, as the significantly increased pancreas-enriched or intestine-enriched proteins after CR are implicated in tissue-protective roles, such as lipid digestion (PLA2G1B), protection from pancreatitis (CTRB1)40, regulation of inflammatory bowel disease (REG1A)41 and supporting intestinal barrier function (CDH17)42 (Fig. 2m,n). In addition, the kidney, artery and muscle did not show any significantly regulated proteins, and BMP10, important in cardiac development and function43, was increased in the heart after CR (Extended Data Fig. 2i−l). However, the absence of change based on these in silico analyses may not fully capture the biology due to the lower sensitivities of detected protein features. Collectively, these data may suggest that CR is beneficial across various organs, with the most notable effects observed in the adipose tissue.
CR downregulates C3a level independently of BMI
To explore the specific mechanisms driving the benefits of CR, we performed pathway enrichment analysis with the plasma proteomics data using the Gene Ontology and Kyoto Encyclopedia of Genes and Genomes (KEGG) databases44,45. We found that CR upregulated pathways related to neuronal development, cardiac function and tissue remodeling (Fig. 3a). In addition, CR suppressed pathways involved in the regulation of lipid storage, positive regulation of IL-6 production and positive regulation of immune response (Fig. 3a). These results confirmed the previously reported immunometabolic advantages of CR46,47,48,49. Notably, the top downregulated pathways after CR were the ‘complement and coagulation cascades’ (Fig. 3a,b). Given that the expression levels of complement components increase with age and are implicated in various age-associated dysfunction22,50,51, we delved deeper into CR-induced changes of each complement component.

a, Gene set enrichment analysis for databases GO BP and KEGG. Only significant pathways (adjusted P < 0.05) are shown with the exact adjusted P value. limma was used for statistics. b, Enrichment plots for complement and coagulation cascades from the KEGG database and regulation of lipid storage from GO BP. limma was applied for statistics. c−q, ANML normalized expression values for the C1s (c), C1r (d), C2 (e), C4 (f), C4b (g), CFB (h), CFD (i), C3 (j), C3a (k), C3adesArg (l), C3b (m), C5 (n), C6 (o), C7 (p), and C9 (q) (n = 42 per group, biological replicates). r−y, Linear regression analysis was conducted to examine the correlation between BMI and C1r (r), CFB (s), CFD (t), C5 (u), C1s (v), C3a (w), C3adesArg (x), or C9 (y). z, Plasma C3 and C3a levels were measured by ELISA, and the C3a/C3 ratio was calculated (n = 20 per group, biological replicates). For c−q and z, paired two-tailed t-tests were performed, and adjusted P values (c−q) or P values (z) are presented. GO BP, Gene Ontology Biological Process; NES, normalized enrichment score.
We found that CR significantly reduced plasma levels of some early classical pathway-related components, such as C1s and C1r, but not C2, C4 and C4b (Fig. 3c−g). In addition, CR also suppressed the expression levels of alternative pathway-related components, specifically CFB and CFD (Fig. 3h,i). A central event during complement activation is the cleavage of C3 into C3a and C3b, which further promotes inflammation and the formation of the membrane attack complex (MAC), respectively. Although C3 and C3b levels were not affected, both C3a and C3adesArg, a more stable form of C3a with the C-terminal arginine cleaved, were significantly reduced by CR (Fig. 3j−m). Furthermore, among the MAC components, C5 and C9 showed significant reductions after CR, whereas C6 and C7 levels remained unchanged, and C8 was not detected (Fig. 3n−q). Among these components, C1r, CFD and C3a were significantly reduced by CR in both sexes (Extended Data Fig. 3a−o). These results suggest that CR in humans suppresses the overall complement cascade rather than a specific pathway (Extended Data Fig. 4).
Because BMI has been reported to be associated with widespread changes in the circulating proteome in humans52, we examined the association between BMI and the eight complement components (C1s, C1r, CFB, CFD, C3a, C3adesArg, C5 and C9) that were significantly reduced after CR. Of note, although the degrees of association were not strong, C1r, CFB, CFD and C5 showed significant positive correlations with BMI, indicating that the reduced expression levels of these molecules could be derived from weight loss after CR (Fig. 3r−u). By contrast, C1s, C3a, C3adesArg and C9 exhibited BMI-independent expression patterns (Fig. 3v−y). In sex-specific analysis, all eight complement components (C1s, C1r, CFB, CFD, C3a, C3adesArg, C5 and C9) in male participants were regulated by CR, independent of BMI, which could also be inferred from the low sample number (Extended Data Fig. 5a−h). However, in female participants, only C1s, C3a and C3adesArg were suppressed by CR in a BMI-independent manner (Extended Data Fig. 5a−h). Therefore, among C1r, CFD and C3a, whose expression levels were significantly reduced by CR in both sexes, C3a is the only component regulated independently of BMI. To further confirm and orthogonally validate that CR suppresses complement activation, we performed ELISA with archived plasma samples of CALERIE participants. We found that CR significantly reduced plasma C3a levels and the C3a/C3 ratio but not C3 levels (Fig. 3z). Thus, these data indicate that the inhibition of C3a might be a unique CR mimetic that can be harnessed to extend immune and metabolic healthspan.
Age-associated increase in C3 cleavage is unique to the VAT in mice
Given the data from the proteomics analysis of the CALERIE clinical trial, which established the relevance of the complement pathway in human metabolism, we used standard mouse models to test causality, source and the mechanistic role of C3a on organismal aging. First, we measured serum C3 and C3a levels in humans and mice to investigate the conservation of aging-associated dysregulation of the complement pathway. Cross-sectional analysis of young (age 21−36 years) and older (age ≥65 years) adults demonstrated a significant increase in C3 and C3a concentrations with age, whereas the C3a/C3 ratio was similar between the groups (Fig. 4a−d and Extended Data Fig. 6a,b). Furthermore, analyses of C57BL/6N mice from the National Institute on Aging (NIA) revealed that aging was associated with a significant elevation of C3a and the C3a/C3 ratio in both sexes of mice, whereas C3 was reduced (Fig. 4e−g and Extended Data Fig. 6c,d). These results indicate that both humans and mice exhibit an age-associated increase in complement abundance.

a, Schematic diagram for C3 cleavage. b−d, Human serum samples were analyzed for C3 (b) and C3a (c) ELISA, and the C3a/C3 ratio (d) was calculated in both sexes (a; n = 14 for 21−36 years and n = 11 for >65 years, biological replicates). Box plots indicate minimum to maximum. e–g, Mouse serum samples were analyzed for C3 (e) and C3a (f) ELISA, and the C3a/C3 ratio (g) was calculated in both sexes (n = 12 per group, biological replicates). Box plots indicate minimum to maximum. h−j, C3 western blot analysis of mouse liver. h, Representative blots for C3. i, Densitometry analysis of male mice (n = 9 for 3-month-old and n = 10 for 24-month-old, biological replicates). j, Densitometry analysis of female mice (n = 4 for 3-month-old and n = 6 for 24-month-old, biological replicates). k−m, C3 western blot analysis of mouse VAT. k, Representative blots for C3. l, Densitometry analysis of male mice (n = 9 for 3-month-old and n = 11 for 24-month-old, biological replicates). m, Densitometry analysis of female mice (n = 4 for 3-month-old and n = 6 for 24-month-old, biological replicates). n, Representative blots for C3 in the indicated tissues of 24-month-old mice. Each lane indicates a different mouse. o, Representative blots for C3 in 24-month-old WT (n = 3, biological replicates) and NLRP3−/− (n = 5, biological replicates) mice. Unpaired two-tailed t-tests were performed, and exact P values are presented. Data are presented as mean ± s.e.m. mo, months; WT, wild-type; n.d., not detected.
Source data
Next, we investigated the principal source of increased serum C3a levels observed in aged mouse through biochemical assays of various organs, including the liver, VAT, subcutaneous adipose tissue (SAT), brown adipose tissue (BAT), spleen and kidney from animals housed in different facilities, at either Yale University (C57BL/6J) or the NIA rodent colony (C57BL/6N). We were able to detect either C3 (185 kDa) or its cleaved forms, such as C3 α-chain (120 kDa), iC3b α-chain (68 kDa) and C3c α′-chain fragment 2 (39 kDa), in all tissues and samples analyzed. It was previously reported that the liver is a primary organ contributing to serum C3 levels53. However, upon aging, we observed only a modest increase in C3 and C3 α-chain liver expression levels in female mice, whereas male mice did not show any changes in C3 and its cleaved effectors with age (Fig. 4h−j). This suggests that the liver may not be a major contributing source of the aging-associated elevation of serum C3a levels. Similarly, although there were alterations in the levels of C3 and/or its cleaved molecules in some tissues, we could not find an increase in C3 cleavage in the SAT, BAT, spleen and kidney in either sex during aging (Extended Data Fig. 6e−l). Of note, we found that the age-associated increase in C3 cleavage was unique to the VAT in both sexes (Fig. 4k−m). In addition, the relative expression levels of C3 α-chain were the highest in the VAT among the analyzed tissues (Fig. 4n). Moreover, by analyzing Yale colony C57BL/6J male mice (likely possessing a different microbiome than the NIA rodent colony), we consistently observed that the VAT, and not the liver, was the major source of C3 cleavage during aging (Fig. 4h,k). This suggests that aging-associated complement dysregulation in VAT is not dependent on animal facility or husbandry-associated microbiota alterations that can impact immune-metabolic crosstalk.
Given that VAT is a major source of age-associated elevation of C3 and its cleaved products and previous reports linking the NLRP3 inflammasome with complement proteins54,55, we asked whether the aged VAT-specific C3 cleavage requires NLRP3 inflammasome activation. We detected similar expressions of either C3 or its cleaved products in VAT from 24-month-old NLRP3-deficient mice and wild-type controls (Fig. 4o and Extended Data Fig. 6m), concluding that the unique C3 cleavage in aged VAT was NLRP3 independent. Together with the CALERIE proteomics data, which showed decreased proteomic age only in adipose tissue, these results demonstrate that VAT plays a unique and pivotal role in the age-associated immunometabolic dysregulation, possibly by contributing to the production of C3a.
Autocrine C3a signaling in adipose tissue macrophages regulates inflammaging
We next asked which complement pathway is involved in the elevation of C3a levels in the VAT of aged mice. By western blot analysis, we did not detect an increase in C1QA (classical pathway) or complement factor D (alternative pathway) during aging, and C2 (lectin pathway) was not detected in the VAT (Fig. 5a). Nevertheless, the ERK pathway, one of the downstream signaling pathways of the C3a receptor (C3AR1), was significantly activated with age in the VAT (Fig. 5a). Because previous studies reported C3 production by both adipocytes25,27 and macrophages26, we next sought to identify the cellular source of C3a within the VAT. To do this, we isolated mature adipocytes and the stromal-vascular-immune fraction (SVIF), which contains various cell types, including immune cells, from the VAT of 3-month-old and 24-month-old mice. In the mature adipocyte floating fraction, we could only detect C3c α′-chain fragment 2, but not C3 or C3 α-chain, and C3c α′-chain fragment was increased with age (Fig. 5b and Extended Data Fig. 7a). However, a caveat of this finding is that floating adipocyte fractions are typically contaminated with lipid-containing macrophages, potentially accounting for C3 concentrations. Notably, we observed all forms of C3 and its cleaved products in the SVIF, where C3 α-chain and C3c α′-chain fragment 2 were significantly increased with age (Fig. 5c and Extended Data Fig. 7b). Moreover, although we did not find age-associated changes in C1QA and CFD in whole VAT, there was a tendency for an increase in both proteins in the SVIF with age, along with ERK activation (Fig. 5c and Extended Data Fig. 7b). These results suggest that C3 cleavage in VAT during aging is predominantly of non-adipocyte origin.

a, Representative western blot with densitometry analysis (n = 5 per group, biological replicates). b,c, Representative western blot analysis of VAT adipocytes (b) and VAT SVIF (c) (n = 5 per group, biological replicates). d, C3 and C3ar1 expression in scRNA-seq of mouse VAT SVIF. e−g, scRNA-seq analysis of VAT-resident macrophages was performed in 2-month-old and 22-month-old mice. C3 expression by age (e) and by macrophage subtypes (f). g, Cdkn1a, Cdkn2a and Lmnb1 levels in AAMs. h, C3 and C3ar1 expression levels in bulk RNA-seq analyses of VAT ATMs (n = 3 per group, biological replicates). i,j, C3 expression in F4/80+CD11b+ VAT ATMs and F4/80−CD11b+ non-macrophage fraction of male (i; n = 6 for 4-month-old and n = 3 for 23-month-old, biological replicates) and female (j; n = 5 for 3-month-old and n = 5 for 22-month-old, biological replicates) mice. k, Representative western blot analysis of mouse BMDMs treated with recombinant C3a. l,m, BMDMs were pretreated with vehicle (DMSO), ERK inhibitor (U0126) or STAT3 inhibitor (S3I-201), followed by C3a, and subjected to western blot analysis (l) or ELISA (m; n = 3 per group, biological replicates). n, VAT explants were treated with either vehicle (VEH) or LPS and C3a, and free fatty acid levels were measured in the culture supernatant (n = 6 for young VEH, n = 6 for young LPS+C3a, n = 5 for old VEH and n = 6 for old LPS+C3a, biological replicates). Unpaired two-tailed t-tests (a,i,j) or one-way ANOVA with multiple comparisons (h,m,n) were performed, and exact P values are presented. Data are presented as mean ± s.e.m. cATM, cyclic ATM; DC, dendritic cell; FSC-A, forward scatter area; hrs, hours; IAM, interferon-associated macrophage; KO, knockout; LAM, lipid-associated macrophage; MP, macrophage; NAM, nerve-associated macrophage; NK, natural killer; tSNE, t-distributed stochastic neighbor embedding; UMAP, uniform manifold approximation and projection; VAM, vascular-associated macrophage; cDC, conventional dendritic cell; pDC, plasmacytoid dendritic cell; ILC, innate lymphoid cell.
Source data
To gain further insight into the cellular source of C3, we analyzed our previously reported single-cell RNA sequencing (scRNA-seq) data of VAT-resident immune cells56. Interestingly, we found that both C3 and C3ar1 expressions were enriched in adipose tissue macrophages (ATMs) among the 15 different resident immune cell types (Fig. 5d). A comprehensive subtyping analysis of VAT-resident ATMs via scRNA-seq57 revealed that, whereas C3ar1 expression was ubiquitously observed across various ATM subsets, AAMs, which predominantly emerge in old mice, primarily accounted for the age-related elevation in C3 expression (Fig. 5e,f and Extended Data Fig. 7c,d). Notably, the AAMs (CD45+F4/80+CD11b+CD169−CD11c−FOLR2−CD38+) did not exhibit elevated levels of Cdkn1a and Cdkn2a and did not show a significant reduction of Lmnb1 in aged mice, which are considered to be some of the canonical markers of cellular senescence57 (Fig. 5g). This suggests that AAM subtypes of VAT-resident macrophages, which are not senescent, are the predominant source of elevated C3 and associated inflammatory proteins during aging. In addition, these data underscore that the tissue-resident dysfunctional macrophages are the likely source of inflammaging instead of senescent cells that are hypothesized to cause aging through senescence-associated secretory phenotype (SASP), a set of non-specific proteins primarily produced by immune cells58,59,60.
Further analysis of age-associated changes in the expression levels of these genes in ATMs through RNA-seq61, which has greater sensitivity than scRNA-seq, showed that both C3 and C3ar1 were significantly increased during aging independent of NLRP3 inflammasome (Fig. 5h), suggesting autocrine activation of C3 in ATMs during aging. To orthogonally confirm the age-associated increase in C3 expression in ATMs at the protein level, we performed flow cytometry analysis (Extended Data Fig. 7e). We observed that higher frequency of F4/80+CD11b+ ATMs in aged mice expressed C3 compared to young mice of both sexes, whereas cells in the F4/80−CD11b+ non-macrophage fraction did not exhibit any difference with aging (Fig. 5i,j).
After confirming that ATMs are key contributors to the VAT-specific age-associated increase in C3a production, we sought to further understand the signaling mechanisms and physiological functions of observed changes. To model this, we used bone marrow-derived macrophages (BMDMs) from young male mice and exposed them to C3a. We found that recombinant C3a treatment induced early ERK activation and time-dependent signal transducer and activator of transcription 3 (STAT3) activation in BMDMs, suggesting that BMDMs possess the machinery to signal to exogenous C3a (Fig. 5k). In addition, we observed that STAT3 activation by C3a treatment was ERK dependent, as pretreatment with an ERK inhibitor also suppressed STAT3 activation in BMDMs (Fig. 5l). By contrast, pretreatment with a STAT3 inhibitor did not affect ERK activation (Fig. 5l), suggesting that ERK activation in response to complement C3a is an upstream signaling event. Consistent with these results and the previously reported proinflammatory function of the C3a signaling pathway in macrophages62, we found that C3a treatment induced IL-1β and IL-6 production by BMDMs in an ERK-dependent but STAT3-independent manner (Fig. 5m).
Our previous work found that ATMs actively control lipid metabolism of adipocytes during aging61. To determine whether C3a signaling in macrophages impacts adipocyte lipolysis, we performed ex vivo experiments with VAT explants from 3-month-old and 24-month-old mice, treating them with C3a in addition to lipopolysaccharide (LPS) to model in vivo inflamed environments. We found that C3a and LPS treatment did not affect lipolysis in VAT explants from either 3-month-old or 24-month-old mice (Fig. 5n). However, compared to 3-month-old mice, we found reduced lipolysis in complement-exposed VAT explants from 24-month-old mice (Fig. 5n). Collectively, these data demonstrate that C3a is produced by ATMs and impairs adipose function by increased age-associated inflammation in an autocrine manner.
Inhibition of complement C3a and C3 reduces inflammaging
The above findings guided us to investigate whether inhibition of C3a could mimic the immunometabolic benefits of CR in vivo. For this purpose, we used a C3a-specific neutralizing antibody (α-C3a), which was previously used in mice63,64,65. To further validate the efficacy and specificity of anti-C3a antibody, purified F4/80+ ATMs from young and aged mice were treated with anti-C3a antibody or isotype control, followed by recombinant C3a activation (Fig. 6a). In ATMs from young mice, we found that anti-C3a antibody-only treatment did not regulate the production of IL-1β at steady state (Fig. 6b). However, once activated by recombinant C3a protein, ATMs released significantly more IL-1β, which was partially but significantly suppressed by pretreatment of anti-C3a antibody (Fig. 6b). In addition, consistent with our data that AAMs in VAT of aged mice produced more C3, the baseline IL-1β production was higher in ATMs sorted from aged mice compared to young mice, which was suppressed by C3a neutralization (Fig. 6b,c). Moreover, as seen in ATMs from young mice, the anti-C3a antibody significantly reduced IL-1β production of C3a-stimulated cells from aged mice (Fig. 6c).

a, Schematic diagram of in vitro validation of anti-C3a antibody. b,c, F4/80+ ATMs were pretreated with anti-C3a antibody (4 µg ml−1) for 1 hour, followed by C3a (20 ng ml−1). IL-1β levels in culture supernatants were measured in young (b) or aged (c) mice (n = 3 per group, biological replicates). d−n, Aged (20-month-old) male mice were randomly allocated, and 4 µg of either isotype (Iso) or anti-C3a antibody (α-C3a) was directly injected into both VAT depots. Mice were euthanized after 3 days (n = 8 per group, biological replicates). d, Schematic diagram. e, Serum C3a levels. f, Representative western blot for ERK activation with densitometry analysis (n = 4 blots per group, biological replicates). g−i, Serum IL-1β (g), IL-6 (h) and MCP-1 (i) levels. j−n, Flow cytometry analysis of the frequencies of VAT ATMs (j), M2-like ATMs (k), Ly6C+ monocytes (l), Treg cells (m) and CD4 T cells (n). o,p, Representative C3 western blot analysis of the VAT of 24-month-old WT and FGF21-Tg (o) and 24-month-old WT and PLA2G7−/− (p) mice (n = 3 per group, biological replicates). Unpaired two-tailed t-tests were performed, and exact P values are presented. Data are presented as mean ± s.e.m. Panels a and d created in BioRender; Dixit, V. https://biorender.com/2jdpq2w (2026).
Source data
Based on this experimental evidence, we next performed in vivo experiments with aged (20-month-old) mice randomly allocated to isotype or anti-C3a antibody groups. To neutralize the effects of elevated C3a in VAT, where autocrine C3a-C3AR1 signaling in ATMs instigates inflammation, we administered antibodies through intra-adipose route in aged mice (Fig. 6d). Because the intra-adipose delivery of anti-C3a antibody (or isotype control) requires abdominal surgery to extrude visceral fat, the mice were injected once and euthanized after 3 days. Despite short-term VAT-specific delivery, serum C3a levels showed a reduced trend by anti-C3a treatment in comparison to the isotype controls, whereas serum C3 levels and the C3a/C3 ratio were similar between the groups (Fig. 6e and Extended Data Fig. 8a,b). In addition, we observed a significant suppression of ERK activation in the anti-C3a antibody group (Fig. 6f), confirming that the C3a-neutralizing antibody inhibited the downstream effects of C3a. Consistent with these data, anti-C3a antibody treatment of aged mice significantly lowered IL-1β and monocyte chemoattractant protein 1 (MCP-1), whereas IL-6 showed a trend of reduction and TNF remained unchanged (Fig. 6g−i and Extended Data Fig. 8c). To examine the impact of C3a neutralization on immune cell composition of aged VAT, we performed multicolor flow cytometry analysis (Extended Data Fig. 8d,e). We found that intra-adipose injection of anti-C3a antibody significantly reduced the frequencies of total ATMs, Ly6C+ monocytes, regulatory T (Treg) cells and CD4 T cells while elevating the frequencies of M2-like antiinflammatory ATMs and did not affect M1-like proinflammatory ATMs, aged adipose B cells, CD8 T cells, natural killer cells and neutrophils (Fig. 6j−n and Extended Data Fig. 8f−j). These results might indicate that a selective inhibition of C3a in VAT could be an actionable target that restrains inflammaging. Notably, AMY-101, which is a selective C3 inhibitor in humans and has recently concluded a phase 2a clinical trial for patients with periodontal inflammation66,67, has low efficacy in mice68 and might elicit off-target effects at high doses (Supplementary Fig. 1a−c and Supplementary Note).
Given that FGF21, PLA2G7 and secreted protein acidic and cysteine-rich (SPARC) are regulated by CR and control healthspan by restraining inflammaging5,6,69,70,71, we investigated the link between the C3 cleavage and healthy aging in the VAT of aged mice overexpressing FGF21 and lacking PLA2G7 and SPARC. Of note, 24-month-old FGF21 transgenic (FGF21-Tg) and PLA2G7 knockout mice exhibited significantly reduced C3 cleavage compared to age-matched controls (Fig. 6o,p). However, 16-month-old SPARC knockout mice showed similar expression of C3 and its cleaved forms to control mice (Extended Data Fig. 9a), suggesting that the prolongevity effects of FGF21 overexpression and PLA2G7 reduction may involve a reduction in C3 cleavage. By contrast, the SAT from 18-month-old adipocyte-specific FGF21-overexpressed (ADN-iFGF21-Tg) mice did not show any reduction in C3 levels (Extended Data Fig. 9b), highlighting that C3 activation is specific to the VAT. Collectively, these data suggest that the inhibition of C3 extends healthspan by regulation of immunometabolic mechanisms in aged mice.