
BACH2 overexpression locks T cells in a quiescent ineffective state
We and others have shown that BACH2 maintains the pool of stem cell-like memory cells by restricting terminal differentiation in the context of acute and chronic viral infection20,21. Given the association of stem-like T cells with effective antitumor immune responses, we initially asked whether BACH2 overexpression improves the antitumor efficacy of adoptive T cell therapy. We utilized an adoptive cell therapy model whereby syngeneic B16 melanoma cells expressing the model antigen ovalbumin (B16-OVA) are recognized by OT-I TCR-transgenic CD8+ T cells specific for the OVA257–264 epitope26. OT-I T cells retrovirally transduced with a constitutive BACH2 overexpression (BACH2OE) vector or a control empty vector (EV) were adoptively transferred into sublethally irradiated B16-OVA tumor-bearing animals (Fig. 1a). Transduced OT-I T cells were readily identifiable in tumor-bearing recipient animals through expression of the congenic marker CD45.1, and the retroviral transduction marker Thy1.1 (Extended Data Fig. 1).

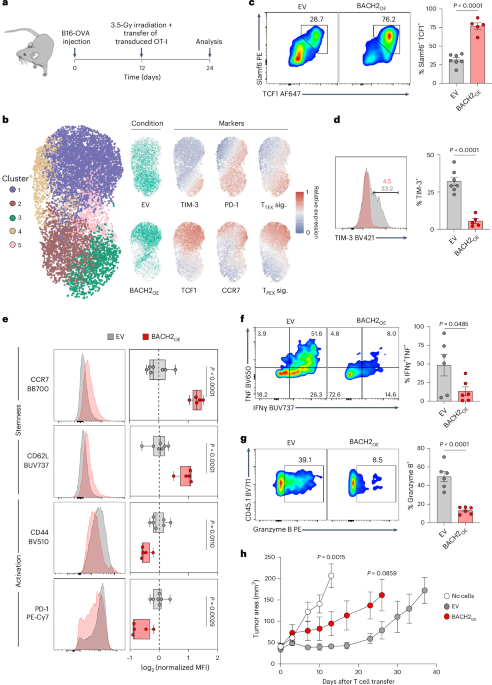
a, Experimental schema. Wild-type mice were subcutaneously injected with B16-OVA cells and tumor-bearing mice received 3.5 Gy X-ray irradiation and intravenous injection of 0.5 × 10⁶ OT-I T cells transduced with EV or BACH2OE vectors. b, Uniform manifold approximation and projection (UMAP) plot, cluster quantification and protein marker expression from flow cytometry data of EV-transduced and BACH2OE-transduced intratumoral OT-I T cells. Phenotypic signatures correspond to the average scaled expression of TIM-3, PD-1 and CD69 (TTEX) and TCF1, Slamf6, CD62L and CCR7 (TPEX). c,d, Percentage of Slamf6+ TCF1+ (c) and TIM-3+ (d) cells in transduced intratumoral OT-I T cells from EV (n = 7) or BACH2OE (n = 5) and representative flow cytometry plots. e, Median fluorescence intensity (MFI) of CCR7, CD62L, CD44 and PD-1 in transduced intratumoral OT-I T cells from EV (n = 7) or BACH2OE (n = 5), and representative flow cytometry histograms. f,g, Percentage of IFNγ+ TNF+ (f) and granzyme B+ (g) cells in transduced intratumoral OT-I T cells from EV (n = 6) or BACH2OE (n = 6) following ex vivo stimulation with PMA + ionomycin and representative flow cytometry plots. h, Tumor measurements of mice injected with B16-OVA and receiving either Hanks’ balanced salt solution (HBSS; no cells, n = 6) or OT-I T cells transduced with EV (n = 5) or BACH2OE (n = 5) as detailed in a. Data are representative of two independent experiments with five to eight mice per group in each experiment. Unpaired two-tailed Student’s t-test (b–h). Dots represent independent replicates (c–g), box plots display the minimum and maximum value (whiskers), median (vertical line) and interquartile range (box) (e), bars and errors indicate the mean ± s.e.m. (c, d, f and g), and tumor curves represent the mean of independent replicates ± s.e.m. (h).
Source data
Flow cytometry revealed a spectrum of differentiation states within tumors. Less differentiated cells were located in cluster 1, including PD-1+TCF1+TIM-3− TPEX cells, which also expressed other TPEX-associated markers such as CCR7. In contrast, cluster 3 contained more highly differentiated cells, characterized by high expression of PD-1 and TIM-3. Other T cell states were distributed among the remaining clusters, such as intermediate PD-1+TCF1−TIM-3− cells (TINT) in clusters 2 and 5, and PD-1−TCF1+ cells in cluster 4. As anticipated, while EV-transduced cells displayed a continuum of differentiation states within the tumor, BACH2OE-transduced cells clustered primarily in cluster 1, corresponding to an induction of a TPEX phenotype27 (Fig. 1b). This distribution is consistent with an observed significant increase in the proportion of TCF1+Slamf6+ cells within the BACH2OE group, as well as a near-complete absence of TIM-3 expression, higher levels of the lymphoid homing receptors CD62L and CCR7 (expressed in naive and memory T cells) and diminished expression of activation markers CD44 and PD-1 (Fig. 1c–e). In addition, BACH2OE severely curtailed production of effector molecules tumor necrosis factor (TNF), interferon gamma (IFNγ) and granzyme B upon 4-h restimulation ex vivo (Fig. 1f,g). Consequently, despite increased expression of markers associated with stemness and reduced levels of terminal differentiation, BACH2-overexpressing OT-I cells mediated impaired antitumor responses compared to EV-transduced cells upon adoptive transfer (Fig. 1h). Collectively, these data suggest that constitutive high-dose overexpression of BACH2 in tumor-targeting T cells locks cells in a memory/progenitor-exhausted state with restricted effector functions, blunting the antitumor efficacy of adoptively transferred CD8+ T cells.
CD8+ TPEX cells express intermediate levels of Bach2
BACH2 is expressed by naive and central memory/progenitor-exhausted CD8+ T cells and extinguished upon terminal differentiation20,21. However, central memory and progenitor-exhausted CD8+ T cells are capable of cytokine polyfunctionality and potent effector function, an observation at odds with the function of BACH2 as a repressor of effector functions28,29. To better understand whether a binary Bach2 expression pattern distinguishes cells in these distinct differentiation states, or whether Bach2 dosage gradually changes within cells of each state on a per-cell basis, we first analyzed single-cell transcriptional profiles of TILs across various human cancer types30. BACH2 mRNA expression was greatest among naive and memory cells, correlating with TCF7 (encoding TCF1) and IL7R expression (Fig. 2a,b), and decreased progressively with T cell differentiation. Effector cells displayed intermediate levels of BACH2, and the lowest levels were observed in CX3CR1+ and KLRG1+ terminal effector memory reexpressing CD45RA (TEMRA) cells. These findings suggested that BACH2 expression levels are not binary but rather are precisely regulated within CD8+ T cells of distinct differentiation states.

a,b, UMAP plot of tumor-infiltrating CD8+ T cells from human cancer samples (a) and representative marker expression for indicated cluster groups (b)30. c, Schema of Bach2tdRFP/+ mice for analysis of endogenous Bach2 regulation. d, Histograms of Bach2tdRFP expression and frequency of expression from intratumoral CD8+ T cell subsets in B16-F10 tumor-bearing mice (n = 3). The dashed line represents the signal from a control WT animal. e, Diagram depicting the STOP-TRM system used for dosing a payload of interest. Translation of an mRNA by a ribosome will generally be terminated upon encountering a STOP codon. If the STOP codon is flanked by a TRM, termination of translation is partially suppressed, leading to downstream translation at reduced levels of expression32. f, BACH2OE and BACH2DE vector design. All vectors contained Thy1.1 as a transduction reporter, followed by a glycine-serine-glycine (GSG) linker, a T2A ribosomal skip motif and the Bach2 ORF tagged in an N-terminal manner with a 3xFLAG tag (3xFLAGBACH2). A STOP-TRM was inserted into BACH2DE vectors before the GSG linker to achieve lower levels of Bach2 expression relative to BACH2OE. g, MFI of 3xFLAGBACH2 expression on OT-I cells transduced with EV (n = 2), BACH2DE (n = 3) or BACH2OE (n = 3) and representative flow cytometry histograms. h, Normalized MFI of 3xFLAGBACH2 expression in cells derived from either BACH2FLAG or wild-type mice and transduced with the indicated vectors (n = 5 for all groups). 3xFLAGBACH2 were normalized to forward scatter (FSC-A) to account for variation in cell size. i, Normalized copy number of BACH2 from cells transduced with EV (n = 5), BACH2DE-5% (n = 4), BACH2DE-5% (n = 5) and BACH2OE (n = 5). Copy number was normalized to total protein mass per cell. Data are representative of two independent experiments (d, g and h). Multiple unpaired two-tailed Student’s t-test with Bonferroni correction (g). One-way analysis of variance (ANOVA) with Tukey’s or multiple-comparison correction (h and i). Dots represent independent replicates (d, g, h and i), and bars or horizontal lines and error bars indicate the mean ± s.e.m. (d, g, h and i). c and e were created with BioRender.com.
Source data
To study Bach2 expression levels on a per-cell basis with greater resolution, we used Bach2tdRFP reporter mice in which a tandem red fluorescent protein (tdRFP) is expressed under the transcriptional control of endogenous Bach2 regulatory elements31 (Fig. 2c). Bach2tdRFP/+ mice were subcutaneously injected with B16-F10 melanoma cells, and T cells from the tumor, spleen and draining lymph nodes were phenotyped 16 days later. In line with human single-cell RNA-sequencing (scRNA-seq) data, we observed a reduction in the frequency of Bach2-positive CD8+ T cells as they progressed along both acute and chronic differentiation trajectories, from naive to central memory (TCM), effector memory (TEM) and effector (Teff); and naive to TPEX, TINT and TTEX, respectively (Fig. 2d and Extended Data Fig. 2a,b). Importantly, when Bach2 expression was examined on a per-cell basis, we observed graded levels of Bach2 expression, with intermediate levels in central memory and progenitor-exhausted CD8+ T cell subsets (Fig. 2e). CD8+ T cells in the spleen and draining lymph nodes displayed comparable Bach2 expression dynamics, with greatest expression in naive CD62L+CD44− cells and lowest expression in antigen-experienced CD62L−CD44+ cells (Extended Data Fig. 2c,d). Thus, Bach2 expression levels are progressively downregulated on a per-cell basis, with polyfunctional central memory and progenitor-exhausted cells expressing intermediate levels of Bach2.
Low-dose BACH2 preserves stemness without limiting effector functions
Our experiments showed that endogenous Bach2 levels are precisely regulated within T cells of distinct differentiation states. Given that constitutive high-dose BACH2 overexpression caused loss of effector functions and antitumor efficacy, we asked whether fine-tuning the level of BACH2 expression would enable programming of a stem-like phenotype without restricting effector function. To test this, we designed a system to enable low-dose expression of BACH2, using mutated translational readthrough motifs (TRMs) to partially attenuate premature translational termination of a BACH2 open reading frame (ORF) by a stop codon (STOP-TRM; Fig. 2f)32. Using two different STOP-TRM mutants, we achieved low-dose expression of BACH2 (BACH2DE) at median levels approximately 10% (BACH2DE-10%) and 5% (BACH2DE-5%) of those achieved by conventional retroviral overexpression, as determined using flow cytometric detection of a 3xFLAG tag at the N terminus of the BACH2 ORF transgene (3xFLAGBACH2; Fig. 2g).
To determine how BACH2 expression from our dosing vectors compares to physiological levels, we utilized BACH2FLAG mice, which carry a 3xFLAG tag at the N terminus of the endogenous Bach2 locus—identical to the tag present in our BACH2 expression constructs33. This enabled direct comparison between endogenous and transgenic BACH2 levels using flow cytometry. CD8+ T cells from both BACH2FLAG and wild-type mice were transduced with EV, BACH2OE or BACH2DE vectors and rested in culture under identical conditions (Fig. 2h). After 48 h, all groups displayed a central memory phenotype (CD44+CD62L+; Extended Data Fig. 2e). To account for any differences in cell size, we normalized the 3xFLAG signal to forward scatter. EV-transduced cells from BACH2FLAG mice showed detectable 3xFLAG signal representing endogenous BACH2 levels in central memory cells. Notably, 3xFLAGBACH2DE-5%-transduced wild-type cells produced 3xFLAG levels comparable to endogenous 3xFLAGBACH2 in central memory cells of BACH2FLAG mice, while BACH2DE-10% cells showed slightly higher levels and BACH2OE cells showed a substantially higher signal (Fig. 2h,i). These findings suggest that BACH2DE vectors achieve transgenic BACH2 expression levels similar to those found physiologically in central memory T cells, which express intermediate levels of endogenous BACH2.
To validate these findings using an alternate approach, we performed mass spectrometry (MS)-based quantification of BACH2 protein levels. This analysis showed that BACH2DE-transduced cells display a total BACH2 copy number (endogenous + transgenic) normalized to total protein that is comparable and slightly above that from cells in a central memory state (Fig. 2i). Minor distinctions between this result and our 3xFLAG flow cytometry measurements likely reflect that 3xFLAG detection measured only transgene-derived BACH2, whereas MS quantified both endogenous and transgene-derived BACH2, as well as differences in normalization methods.
To determine the effect of BACH2DE on the phenotype and function of CD8+ T cells, we first performed chronic stimulation assays in vitro. Splenic CD8+ T cells were stimulated, transduced with BACH2OE, BACH2DE-10%, BACH2DE-5% or empty vectors, and maintained in media supplemented with interleukin (IL)-2 alone (acute stimulation) or IL-2 and anti-CD3 antibodies (chronic stimulation) replaced every 2 days (Fig. 3a)34,35. Chronic stimulation was sufficient to induce terminal exhaustion of a proportion of cultured cells, as indicated by co-induction of PD-1 and TIM-3 expression (Fig. 3b). Using this assay, we observed that both BACH2OE and BACH2DE caused a substantial reduction in the frequency of TIM-3+PD-1+ terminally exhausted cells after chronic stimulation (Fig. 3c). Both BACH2OE and BACH2DE also caused higher levels of CD62L and TCF1 expression relative to EV (Extended Data Fig. 3a,b). However, while BACH2OE caused decreased cytokine expression relative to EV upon 4-h restimulation of acutely activated T cells, this was not observed in BACH2DE-10%-transduced or BACH2DE-5%-transduced cells (Fig. 3d). In addition, BACH2OE cells were significantly smaller in size than EV cells (consistent with compromised levels of activation20), but this was not the case with BACH2DE-10% or BACH2DE-5% (Fig. 3e).

a, Experimental schema. OT-I splenocytes were activated for 24 h with anti-CD3 and anti-CD28 before retroviral transduction. Transduced cells were maintained in IL-2-supplemented media on plates coated with (chronic stimulation) or without (acute stimulation) anti-CD3. b, Representative flow cytometry illustrating PD-1 and TIM-3 expression on EV-transduced OT-I cells following acute or chronic stimulation. c,d, Percentage of PD-1+TIM-3+ chronically stimulated (c) or IFNγ+ TNF+ acutely stimulated following 4 h of anti-CD3 restimulation in the presence of brefeldin A and monensin (d) from OT-I T cells transduced with the indicated vectors (n = 5 for all groups) at day 4 and representative flow cytometry plots. e, FSC-A of acutely stimulated OT-I T cells transduced with the indicated vectors (n = 5 for all groups) at day 4 and representative flow cytometry histograms. f, Heat map showing differentially expressed genes (DEGs, q < 0.05, log2(fold change or FC) > 1) between chronically stimulated transduced OT-I T cells (n = 4 for all groups). Color indicates row z score. Black bars indicate genes bound by BACH2 based on a prior chromatin immunoprecipitation sequencing (ChIP–seq) analysis20. g, Alignment showing representative mRNA expression at indicated loci within EV, BACH2OE, BACH2DE-10% and BACH2DE-5% of Cxcr6, Ccr2 and Havcr2; ChIP–seq analysis of BACH2 binding and ATAC-seq analysis of chromatin accessibility. Black arrowheads represent AP-1 binding motifs (TGA(G/C)TCA) colocalizing with BACH2 binding peaks. Data are representative of three independent experiments (a–e) with three to five samples per experimental group in each experiment. One-way ANOVA with Dunnett’s multiple-comparison correction (c–e). Dots represent independent replicates (c–e); horizontal lines and error bars indicate the mean ± s.e.m (c–e).
Source data
To investigate how BACH2DE influences gene expression at the transcriptional level, we sorted transduced cells after 6 days of chronic stimulation and performed bulk RNA-seq. Principal component analysis highlighted substantial differences between EV, BACH2OE and BACH2DE groups, but a high degree of similarity among BACH2DE-10% and BACH2DE-5% (Extended Data Fig. 3c). In comparison with EV-transduced cells, BACH2DE-10% and BACH2DE-5% induced a set of transcriptional changes shared with BACH2OE (clusters A, D and F), and a set of unique transcriptional changes (cluster C), whereas BACH2OE produced a large set of unique transcriptional changes not shared with BACH2DE (clusters B and E; Fig. 3f). Among shared profiles, clusters A and D contained genes upregulated upon both BACH2OE and BACH2DE, including genes associated with T cell stemness such as Tcf7 (encoding TCF1), Slamf6 and Id3; and cluster F contained genes downregulated upon both BACH2OE and BACH2DE, including the known BACH2 target-genes associated with terminal T cell differentiation Havcr2 (encoding TIM-3) and Prdm1 (encoding BLIMP-1)20. Among uniquely regulated profiles, cluster E contained genes uniquely downregulated by BACH2OE, and associated with effector differentiation, including Ccr5, Gzma, Ccr2, Cxcr6, Id2 and Gzmc; cluster B contained genes uniquely upregulated by BACH2OE, including Ccl22, Dnmt1, Kit, Socs3 and Tnf; cluster C contained genes uniquely upregulated by BACH2DE, including Ly6a, Cd266 and Il18. Notably, many of these genes, including Cxcr6, Ccr2 and Havcr2, contained known BACH2 binding sites in the vicinity of their transcriptional start sites (TSSs)20 (Fig. 3f,g). Moreover, gene-set enrichment analysis (GSEA) showed that both BACH2OE and BACH2DE cells exhibited a transcriptional signature more closely aligned with that of stem-like T cells, while EV-transduced cells bore higher resemblance to the signature of terminally differentiated T cells (Extended Data Fig. 3d). Collectively, these data suggest that low-dose expression of BACH2 yields a total BACH2 level that is comparable or slightly higher to endogenous BACH2 levels found in central memory T cells and promotes retention of stem-like characteristics without compromising effector functions.
Low-dose BACH2 partially attenuates AP-1 binding to control highly AP-1-dependent genes
To understand the mechanistic basis for differential gene regulation by BACH2OE versus BACH2DE, we analyzed DNA sequences located within ±2 kb of the TSSs of genes differentially repressed by BACH2OE and BACH2DE. We focused on genes from clusters E and F identified in our RNA-seq analysis: cluster E genes were repressed only by BACH2OE, while cluster F genes were repressed by both BACH2OE and BACH2DE (Fig. 4a,b). Motif enrichment analysis revealed that cluster F promoters were significantly more enriched for bZIP binding sites containing the AP-1 consensus TRE palindromic sequence TGA(G/C)TCA, corresponding to motifs associated with TFs such as BATF, Fra2, JunB and Atf3 (Fig. 4c). Indeed, the frequency of TRE-containing bZIP motifs was consistently higher in cluster F promoters compared with both cluster E and genome-wide promoter regions (Fig. 4d). These findings suggest that genes susceptible to low-dose BACH2 regulation are distinguished by higher frequencies of AP-1 motifs in the vicinity of their TSSs, potentially indicating higher AP-1 dependency.

a, Average normalized gene expression of genes within clusters E and F from RNA-seq experiment in Fig. 3f. b, Schema of TF motif enrichment analysis. The regions 2 kb upstream and downstream of the TSSs of all genes in clusters E and F were subjected to motif enrichment analysis. c, TF motifs enriched (–log2(P value) > 5) in the vicinity of the TSSs of clusters E and F. d, Frequency of selected TF motifs within the ±2-kb TSS region of genes in cluster E and cluster F normalized to their frequency around all known TSSs across the mouse genome. e,f, Average JunB binding as determined using CUT&RUN (e) and chromatin accessibility as determined using ATAC-seq (f) within chronically stimulated cells transduced with the indicated vectors relative to peak centers of annotated BACH2 binding sites20. g, Representative alignments showing JunB binding and chromatin accessibility at selected loci within chronically stimulated cells transduced with the indicated vectors (left). Normalized RNA-seq log2(FC) for corresponding genes from chronically stimulated cells transduced with the indicated vectors (n = 4 for all groups) are shown (right). Statistical values determined using hypergeometric distribution through HOMER (c). Samples used for RNA-seq and CUT&RUN constitute independent replicates. Box plots display the minimum and maximum values (whiskers), median (vertical line) and interquartile range (box) (g). In g, regions where BACH2 ChIP signal and JunB CUT&RUN signal align are highlighted with red shading.
Source data
Because BACH2 functions as an AP-1 repressor in CD8⁺ T cells, we asked whether AP occupancy at BACH2 binding sites is differentially regulated by BACH2OE and BACH2DE20. To test this, we performed Cleavage Under Targets & Release Using Nuclease (CUT&RUN) for the AP-1 factor JunB and assay for transposase-accessible chromatin sequencing (ATAC-seq) for chromatin accessibility in chronically stimulated CD8+ T cells transduced with BACH2OE and BACH2DE vectors. While ATAC-seq analysis showed global changes in genome-wide chromatin accessibility consistent with the distinct differentiation states of BACH2OE and BACH2DE CD8+ T cells, these changes were not enriched at BACH2 binding sites. Nonetheless, JunB occupancy showed dose-dependent attenuation (Fig. 4e,f and Extended Data Fig. 4a–c). BACH2OE caused near-complete loss of JunB binding at BACH2 sites, whereas BACH2DE resulted in partial reduction in JunB binding frequency compared to cells transduced with an EV. This graded AP-1 displacement was evident at the regulatory elements of effector and exhaustion-associated genes including Ttc39c, Havcr2 and Entpd1, with transcript levels showing corresponding dose-dependent changes (Fig. 4g).
To confirm that BACH2 mediates dose-dependent repression of AP-1-driven gene expression under conditions modeling constitutive expression, we utilized a previously developed reporter assay for BACH2-mediated repression of AP-1-driven gene expression23. In this assay, a Jurkat cell line harbors a luciferase reporter driven by three tandem copies of regions containing AP-1 consensus TRE palindromic TGA(G/C)TCA sequences derived from the Ifng + 18k enhancer, along with a tetracycline-inducible BACH2 expression system (Extended Data Fig. 5a). Using 48-h pretreatment with varying doses of tetracycline to model distinct levels of continuous BACH2 expression, we observed dose-dependent repression of phorbol myristate acetate (PMA)-induced luciferase activity, with intermediate repression at low BACH2 doses (Extended Data Fig. 5b). These findings confirm that BACH2 functions as a dose-dependent regulator of AP-1-driven transcription.
Together, these analyses support a model whereby BACH2DE achieves selective gene regulation through partial AP-1 displacement, with AP-1-dependent genes being preferentially sensitive to low-dose BACH2 regulation.
Low-dose BACH2 enhances antitumor T cell responses
The ability of BACH2 dosing to enable retention of a stem-like phenotype without compromising effector functions led us to ask whether this approach can be utilized to enhance adoptive T cell therapy responses in vivo. B16-OVA tumor-bearing mice were intravenously administered with OT-I T cells transduced with empty, BACH2OE or BACH2DE vectors. While BACH2OE was unable to enhance the antitumor efficacy of adoptively transferred OT-I T cells compared with EV-transduced cells, BACH2DE-10%-transduced and BACH2DE-5%-transduced OT-I cells mediated substantially enhanced antitumor responses (Fig. 5a,b). Similar results were obtained with an OVA-expressing MC38 colorectal carcinoma T cell therapy model (MC38-OVA; Extended Data Fig. 6a,b).

a, Tumor volume of B16-OVA-bearing mice following sublethal irradiation with 3.5 Gy and adoptive transfer of 0.5 × 10⁶ OT-I T cells transduced with EV (n = 7), BACH2DE-5% (n = 4), BACH2DE-5% (n = 8) and BACH2OE (n = 5). Mice euthanized due to reasons unrelated to tumor size were excluded. b, Tumor volumes at days 15–17 from mice alive at the time of measurement after T cell transfer and representative images of B16-OVA tumors. Ruler scale is in cm. c, Number of tumor-infiltrating transduced OT-I T cells per gram of tumor from a for indicated T cell phenotypes and sample groups. The horizontal dashed line represents the EV average. d, Quantification of TCF1 and TIM-3 frequency of expression in tumor-infiltrating transduced PD-1+ OT-I T cells and representative flow cytometry plots. Significance represents difference in frequency of TCF1+TIM-3− cells with that of the EV population. e,f, Frequency of granzyme B+ (e) and IFNγ+ (f) transduced intratumoral OT-I T cells from EV (n = 8), BACH2DE-5% (n = 5), BACH2DE-5% (n = 8) and BACH2OE (n = 8) following ex vivo 4-h restimulation and representative flow cytometry plots (f). g, Quantification of the absolute number of tumor-infiltrating transduced OT-I T cells from EV (n = 14), BACH2DE-5% (n = 15), BACH2DE-5% (n = 15) and BACH2OE (n = 13) per gram of tumor expressing the indicated effector molecule normalized to EV. Data are representative of three independent experiments. Data in g represent pulled independent replicates from two independent experiments. One-way ANOVA with Dunnett’s multiple-comparison correction (a–f); Kruskal–Wallis test with Dunn’s multiple-comparison correction (g). Tumor curves represent the mean of independent replicates ± s.e.m. (a), dots represent independent replicates (b, c and e–g), and bars and errors indicate the mean ± s.e.m. (b–g).
Source data
Notably, while BACH2OE led to an increase in the absolute number of TPEX cells but a decrease in TTEX cells relative to EV control, both BACH2DE-10% and BACH2DE-5% resulted in increased numbers of both T cell subsets (Fig. 5c). Consequently, phenotypic marker analysis revealed that BACH2OE resulted in a near-complete loss of terminally differentiated TCF1−TIM-3+ TTEX cells, while the overall frequency of stem-like and terminally differentiated cells remained minimally altered among BACH2DE-transduced cells (Fig. 5d and Extended Data Fig. 6c–e). Evaluation of effector cytokine production upon 4-h ex vivo restimulation revealed that BACH2OE-transduced cells displayed a significantly lower frequency of cells expressing effector molecules (IFNγ, TNF, granzyme B, IL-2), while this remained unchanged between BACH2DE and EV control (Fig. 5e,f and Extended Data Fig. 6f). Consistent with the observed expansion of both TPEX and TTEX subsets and preserved effector functions, mice receiving BACH2DE-transduced cells displayed a significantly increased number of cytokine-producing cells per gram of tumor (Fig. 5g). Collectively, these data suggest that BACH2DE enhances the antitumor efficacy of CD8+ T cells by promoting persistence while allowing acquisition of effector functions.
Low-dose BACH2 induces a hybrid transcriptional state among Slamf6− cells
To better understand how constitutive low-dose BACH2 expression affects CD8+ tumor-reactive T cells in distinct differentiation states, we sorted BACH2OE-transduced or BACH2DE-transduced OT-I CD8+ T cells from B16-OVA tumors based on Slamf6 expression, which marks progenitor-exhausted cells, and performed RNA-seq analysis (Fig. 6a). As previously observed, BACH2OE limited differentiation of TTEX cells, resulting in insufficient Slamf6− cells for analysis.

a, Experimental schema. Tumor-infiltrating transduced OT-I T cells were isolated from B16-OVA tumor-bearing mice 18 days after T cell transfer and sorted via fluorescence-activated cell sorting (FACS) into Slamf6+ and Slamf6− fractions for analysis by bulk RNA-seq. Insufficient cell numbers were recovered from Slamf6− cells in mice receiving BACH2OE-transduced cells. b, Heat map displaying average log2 gene expression normalized to row maxima within indicated populations. Genes displayed correspond to all DEGs (q < 0.05, log2(FC) > 1) between Slamf6+ and Slamf6− in EV and BACH2DE. c, Violin plots displaying the distribution of gene expression values of genes within each of the clusters from b within indicated populations. d, Normalized expression counts of Tcf7 and Klf3 from indicated sample groups. Significance shown represents q values from expression comparisons between Slamf6+ and Slamf6− in each condition. Samples used for RNA-seq are independent replicates (n = 5 for all groups). Dots represent independent replicates (d). NS (P > 0.05); *P < 0.05. Statistical significance determined via DESeq2 using a Wald test with Benjamini–Hochberg multiple-comparison correction (d). a was created with BioRender.com.
Source data
Hierarchical clustering revealed four distinct gene expression patterns showing how BACH2DE differentially affects Slamf6+ and Slamf6− populations (Fig. 6b,c). Cluster A genes (Cxcr5, Id3, Slamf6) were genes predominantly expressed by Slamf6+ cells in both EV and BACH2DE conditions, with minimal expression in Slamf6− cells even after BACH2DE treatment. This suggests that BACH2DE leaves key aspects of the transcriptional program among Slamf6− cells intact rather than imposing the full TPEX transcriptional program upon them. Similarly, cluster D contained genes characteristic of Slamf6− cells regardless of BACH2DE transduction. The most notable transcriptional changes occurred in clusters B and C. Cluster B contained genes including TPEX-associated transcription factors (Tcf7, Klf3) whose expression is normally restricted to Slamf6+ cells but that were induced in Slamf6− cells by BACH2DE, suggesting that BACH2DE induces a limited set of stem-like transcriptional characteristics among Slamf6− cells while maintaining their core differentiated transcriptional program (Fig. 6d). Interestingly, cluster C contained genes characteristic of Slamf6− cells (Hmox1, Cd74, Crtam), which became expressed by Slamf6+ cells upon BACH2DE expression, indicating that BACH2 dosing induces transcriptional changes in both populations, although the effects are most pronounced in Slamf6− cells. Consistent with these changes, similarity matrix analysis showed that BACH2DE Slamf6+ and Slamf6− populations cluster more closely than their EV counterparts (Extended Data Fig. 7). Together, these data reveal that BACH2 dosing drives transcriptional changes to both Slamf6+ and Slamf6− cells, with the most substantial changes to the Slamf6− subset in which it drives a hybrid transcriptional state promoting acquisition of a limited set of stem-like transcriptional characteristics while also enabling them to retain their more differentiated identity.
During physiological CD8+ T cell differentiation, stemness and effector function exist in an inverse relationship, with quiescence factors maintaining stem-like properties through active suppression of effector programs36,37,38. Our transcriptional analyses suggested that BACH2 dosing may disrupt this relationship, creating a hybrid differentiation state among Slamf6− cells combining the transcriptional characteristics of stem-like and effector cells. To test whether this corresponds to a hybrid phenotype, we performed phenotypic and functional analyses within in vitro and in vivo settings. We first subjected OT-I T cells transduced with EV or BACH2DE vectors to either acute or chronic stimulation conditions, allowing generation of Slamf6+ and Slamf6− cells, respectively. Among chronically stimulated CD8+ T cells, BACH2DE selectively increased the frequency of CD62L+ and TCF1+ cells within the Slamf6− subset while reducing TIM-3 expression relative to Slamf6− EV cells, consistent with BACH2DE driving retention of stem-like features among Slamf6− cells (Fig. 7a–c). On the other hand, acutely stimulated Slamf6+ cells transduced with BACH2DE vectors showed no significant changes in TCF1, CD62L, TIM-3 or Ki67 expression compared to Slamf6+ EV (Extended Data Fig. 8a–d), consistent with the less substantial transcriptional differences driven by BACH2DE within this subset. However, despite acquiring features associated with less differentiated stem-like CD8+ T cells, BACH2DE-transduced Slamf6− cells exhibited effector characteristics, including increased production of IFNγ and TNF upon restimulation compared to EV-transduced cells, increased Ki67, maintained cell size and similar CD44 expression (Fig. 7d,e and Extended Data Fig. 8e,f).

a–c, Frequency of CD62L+(a), TIM-3+ (b) and TCF1+ (c) cells within the Slamf6− population transduced with the indicated vectors (n = 3 for all groups) after chronic stimulation and representative flow cytometry histograms. d, Frequency of IFNγ+ TNF+ within the Slamf6− population transduced with the indicated vectors (n = 5 for all groups) upon 4 h of PMA and ionomycin restimulation in the presence of brefeldin A and monensin following chronic stimulation and representative flow cytometry plots. e, MFI of CD44 within the Slamf6− population transduced with the indicated vectors (n = 3 for all groups) upon chronic stimulation and representative flow cytometry histograms. f,g, Comparison of the MFI (normalized to EV) of indicated markers between Slamf6+ (top) and Slamf6− (bottom) in tumor-infiltrating adoptively transferred OT-I T cells transduced with from EV (n = 7), BACH2DE-5% (n = 10) and BACH2DE-10% (n = 7) (f), and representative flow cytometry histograms (g). h,i, Representative example of GSEA analysis comparing Slamf6− EV and Slamf6− BACH2DE-10%-transduced (blue) or BACH2DE-5%-transduced (red) OT-I T cells sorted from B16-OVA tumors using publicly available TPEX signatures as reference gene sets (h) and normalized enrichment scores using publicly available TPEX gene sets (i). The horizontal dashed line in i represents an adjusted P value of 0.05. Data are representative of two independent experiments (a–g). NS (P > 0.05); *P < 0.05; **P < 0.01. One-way ANOVA with Dunnett’s multiple-comparison correction (a–f). Weighted Kolmogorov–Smirnov test with false discovery rate multiple-comparison correction (h and i). Dots represent independent replicates (a–f), bars and errors indicate the mean ± s.e.m. (a–e), and box plots display the minimum and maximum value (whiskers), median (vertical line) and interquartile range (box; f).
Source data
Consistent with in vitro observations, intratumoral Slamf6− cells resulting from the adoptive transfer of BACH2DE-transduced OT-I T cells into B16-OVA-bearing mice displayed elevated CD62L, CCR7 and Ki67 expression compared to EV controls, whereas BACH2DE and BACH2OE-transduced Slamf6+ cells possessed largely similar phenotypic characteristics, except for mildly reduced TIM-3 MFI (Fig. 7f,g). This was associated with significant enrichment of multiple TPEX-associated gene sets among BACH2DE-transduced Slamf6− cells compared to EV-transduced Slamf6− cells (Fig. 7h,i)8,39,40,41.
Together, these data demonstrate that BACH2 dosing drives a nonphysiological hybrid differentiation state among Slamf6− cells, featuring retention of a set of transcriptional and phenotypic characteristics of TPEX cells, while leaving the core effector differentiation program intact. BACH2 dosing also drove a milder set of transcriptional changes among Slamf6+ cells, which like Slamf6− cells accumulated to higher frequencies within tumors upon BACH2DE but was associated with more minimal changes in the phenotype of cells.
Low-dose constitutively active FOXO1 enhances antitumor T cell responses
To extend this work beyond BACH2 and to test whether dose optimization is a generalizable requirement for effective deployment of quiescence factors, we tested the relevance of dose optimization with the quiescence factor FOXO1 (refs. 42,43,44,45). Similarly to BACH2, FOXO1 is required for maintenance of memory and progenitor-exhausted CD8+ T cells, and is more highly expressed in naive CD8+ T cells than in central memory and effector memory subsets42,43,44. We cloned vectors expressing a constitutively active triple-alanine mutant of FOXO1 (FOXO1AAA)46, using the STOP-TRM system enabling either conventional high-dose overexpression or dosed expression of FOXO1AAA (FOXO1AAAOE, FOXO1AAADE-10% and FOXO1AAADE-5%; Fig. 8a). Using an in vitro chronic stimulation assay, we found that both high-dose and low-dose constitutive expression of FOXO1AAA led to a comparable increase in the frequency of CD62L+ and TCF1+TIM-3− cells, relative to EV-transduced cells (Fig. 8b,c). However, FOXO1AAAOE caused a substantial impairment in the production of IFNγ and TNF after 4-h brief restimulation in vitro, while this was not the case for FOXO1AAADE-10% and FOXO1AAADE-5% (Fig. 8d).

a, Design of FOXO1AAAOE and FOXO1AAADE vectors. b–d Frequency of CD62L+ chronically stimulated cells (b), TCF1+TIM-3− chronically stimulated cells (c) or IFNγ+ TNF+ acutely stimulated cells following 4 h of anti-CD3 restimulation in the presence of brefeldin A and monensin (d) from OT-I T cells transduced with EV (n = 3 no restimulation, n = 5 restimulation), FOXO1AAADE-5% (n = 5), FOXO1AAADE-10% (n = 5) and BACH2OE (n = 5) vectors at day 4 and representative flow cytometry histograms/plots. e,f, Tumor volumes of B16-OVA-bearing mice following sublethal irradiation with 3.5 Gy and adoptive transfer of 0.5 × 10⁶ OT-I T cells transduced with EV (n = 7), FOXO1AAADE-5% (n = 6), FOXO1AAADE-10% (n = 6) and BACH2OE (n = 5) vectors (e) and tumor volumes at day 18 after T cell transfer (f). For mice that were euthanized, the final tumor volume was carried forward and included in the average. Tumor volumes are shown up to the time point when >20% of mice remained alive. g, Kaplan–Meier survival curve of B16-OVA-bearing mice shown in e. Significant differences represent differences between EV and either FOXO1AAADE-10% (blue) or FOXO1AAADE-5% (red). Data are representative of two independent experiments. *P < 0.05; **P < 0.01. One-way ANOVA with Dunnett’s multiple-comparison correction (b–d and f), Kaplan–Meier log-rank Mantel–Cox test (g). Dots represent independent replicates (b–d and f), and horizontal lines and errors indicate the mean ± s.e.m. Tumor curve represents the average of independent replicates ± s.e.m. (e).
Source data
We next treated B16-OVA-bearing mice with OT-I T cells transduced with empty, high-dose or low-dose FOXO1AAA vectors. As previously observed with the BACH2 dosing vectors, both FOXO1AAADE-10% and FOXO1AAADE-5% groups mediated a significant improvement in antitumor responses relative to EV, but this was not the case with the FOXO1AAAOE group (Fig. 8e,f). This also resulted in an overall improvement in survival resulting from transduction of adoptively transferred cells with FOXO1AAADE vectors (Fig. 8g). These data suggest that dose optimization is a generalizable requirement for effective deployment of quiescence factors such as BACH2 and FOXO1, with quantitative changes to payload expression resulting in qualitatively distinct changes to the phenotypic and functional output of cells.