
Study cohort
The selected cohort (N = 329) had a gender (female/male) ratio of 69.9/30.1 whereas the mean age of the participants was 30.66 years, ranging from 7 to 60 years. Most participants were Malay (81.5%), followed by Chinese (11.6%), Indian (5.8%), or from other ethnicities such as Bajau and Dusun (1.2%). Participants were categorized into five groups of age (7–12 years-old: children, 13–18-year-old adolescents, 19–30 years-old young adults, 31–50 years-old adults, and ≥ 51 years old: middle-aged and elderly subjects), with the majority being young adults (40.4%) and adults (35.3%). Overall, a higher proportion of patients from the total population suffered from AR (48%), ARC (19.8%), AD (17.1%), and AA (14%), and a detailed demographic characteristic of each cohort is given in Table 1.
Sensitization to Blomia tropicalis by SPT and ImmunoCAP
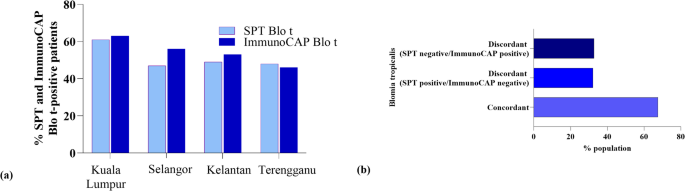
Skin prick testing revealed a Blo t sensitization rate of 51.6% in the total allergic population; sensitization levels were similar in Selangor (47.3%), Kelantan (48.8%), and Terengganu (47.8%) (p > 0.05). However, subjects from Kuala Lumpur had a significantly higher sensitization rate (61.8%) than the participants from other regions (p < 0.05) (Fig. 1a). ImmunoCAP detection of Blo t-specific IgE showed a sensitization rate of 55% in the total population. Regional sensitization rates were 63% (Kuala Lumpur), 56% (Selangor), 53% (Kelantan), and 46% (Terengganu). This indicated a higher prevalence in the Klang Valley (59%) compared to the East Coast (41%). (Fig. 1a). The distribution of ImmunoCAP grade classifications among the allergic population is presented in Supplementary Table 1. A total of 329 samples were assessed, with 45.3% (n = 149) classified as negative (< 0.35 kU/L). Among positive classifications, the highest prevalence was observed in Class 3 (> 3.5–17.5 kU/L), representing 17.9% (n = 59) of the samples, followed by Class 2 (> 0.70–3.5 kU/L) and Class 4 (> 17.5–50 kU/L), each accounting for 12.8% (n = 42). The lowest occurrences were seen in Class 1 (0.35–0.60, N = 21), Class 5 (> 50–100, N = 12), and Class 6 (> 100 kU/L, N = 4), accounting for 6.4%, 3.6%, and 1.2% respectively of the total samples.

(a) Comparative sensitization rates detected by SPT and ImmunoCAP Blot across allergic cohorts (N = 329). The bar graph illustrates the percentage of individuals testing positive for each allergen using two diagnostic methods: SPT Blot (light blue) and ImmunoCAP Blot (dark blue). Data represent only positive cases, highlighting differential detection rates and potential variability in allergen recognition between skin prick testing and in vitro IgE measurement. (b) Distribution of population response to Blomia tropicalis based on concordance and discordance between SPT and ImmunoCAP results. “Concordant” refers to individuals with matching test outcomes (both positive or both negative). “Discordant (SPT⁺/ImmunoCAP⁻)” and “Discordant (SPT⁻/ImmunoCAP⁺)” represent individuals with conflicting test results. Percentages are calculated relative to each diagnostic subgroup and are not additive across categories. This visualization highlights test agreement and discrepancy patterns rather than cumulative population proportions.
Comparison of SPT and IgE-reactivity to Blomia tropicalis
SPT and ImmunoCAP results were not fully concordant among allergic patients. Among 329 cases, 101 (67.8%) were negative in both tests (concordant negative), while 121 (67.2%) were positive in both (concordant positive). However, 48 cases (32.2%) were SPT-positive but ImmunoCAP-negative, and 59 cases (32.8%) were SPT-negative but ImmunoCAP-positive. Overall, 67.5% (222 cases) showed agreement between the two tests, while 32.5% (107 cases) were discordant. Kappa statistical analysis yielded a Kappa value of 0.348 (p = 0.001), indicating a fair level of agreement but highlighting notable discordance (Fig. 1b). Additionally, an ordinal logistic regression analysis was performed to assess the relationship between Blo t ImmunoCAP class and SPT wheal size grade, the model demonstrated a statistically significant association between ImmunoCAP class and wheal size grade with higher likelihood of positive ImmunoCAP value with a higher SPT wheal size (p < 0.05). The estimated regression coefficients and corresponding odds ratios are presented in Supplementary Table 2.
Sensitization patterns to rBlo t allergens
The prevalence of sensitization to rBlo t 2, rBlo t 5, rBlo t 7 and rBlo t 21 reached 56.9%, 74.6%, 83.4% and 57.5% respectively in the Blo t-ImmunoCAP positive subjects (n = 180) and 31.3%, 41%, 45.9, and 31.6% respectively in the total allergic population (n = 329). Of note, two patients (0.6%) were exclusively sensitized to rBlo t 2, nine (2.7%) sensitized to rBlo t 5, whereas nine and one were solely sensitized to rBlo t 7, and rBlo t 21 respectively. Many patients exhibited co-sensitizations to at least two rBlot allergens, 18.2% of the population were sensitized to all four rBlo t allergens (Fig. 2a). Spearman’s rank-order correlation was used to assess the strength and direction of associations among specific IgE levels to rBlo t allergens, and all correlations were statistically significant, indicating consistent co-sensitization patterns among the components. Moderate to strong positive correlations were observed between the allergen components; the strongest correlation was found between rBlo t 5 and rBlo t 7 (ρ (rho) = 0.603, p < 0.001), followed by rBlo t 2 and rBlo t 7 (ρ (rho) = 0.598, p < 0.001). The weakest, though still significant, correlation was between rBlo t 2 and rBlo t 21 (ρ (rho) = 0.415, p < 0.001). These findings suggest that sensitization to one Blo t component is often accompanied by sensitization to others, particularly among rBlo t 2, t 5, and t 7. The heatmap visualizing the Spearman correlation coefficients among rBlo t allergens are presented in Fig. 2b. Sensitization to rBlo t allergens varied across age groups (Fig. 2c), in children (7–12 years), rBlo t 5 is the most prevalent sensitizer (36%), while rBlo t 2 is the least (12%). Among adolescents (13–18 years), sensitization rates increased, with rBlo t 5 (57.1%) and rBlo t 7 (52.4%) being the most immunodominant allergens. High levels of sensitization to rBlo t 7 (51.1%) and rBlo t 5 (45.1%) were maintained in young adults (19–30 years), together with notable IgE binding frequency to rBlo t 2 (40.6%) and rBlo t 21 (31.6%). In adults (31–50 years), rBlo t 7 (45.7%) remained the dominant sensitizer, followed by rBlo t 5 (41.4%) and rBlo t 21 (37.1%). Among those ≥ 50 years, sensitizations to rBlo t 7 (44.1%) and rBlo t 21 (32.4%) are the most prevalent ones followed by rBlo t 5 and rBlo t 2 (29.4% each).

(a) Venn diagram showing the distribution of rBlo t 2, rBlo t 5, rBlo t 7 and rBlo t 21 sensitizations among the study population (N = 329), (b) Spearman correlation matrix of IgE reactivity among rBlo t allergens, (c) Age distribution of sensitization rates to rBlo t allergens in the allergic population, (d) rBlo t sensitization rates among the allergic populations across different cohorts in Malaysia (n = 329), % sensitization in brackets represents Blo t-ImmunoCAP positive cohort (n = 180).
Conversely, sensitization rate to these rBlo t allergens in each study cohort is shown in Fig. 2d. Allergic population for Kuala Lumpur, Selangor, Kelantan, and Terengganu had sensitization rate of 48.3%/45.2%/12.7%/12.9% for rBlo t 2, 36.8%/40.9%/44.3%/42.9% for rBlo t 5, 62.1%/51.6%/37.9%/27.1% for rBlo t 7, and 35.6%/37.6%/27.8%/22.9% for rBlo t 21 while percentages based on Blo t-ImmunoCAP positive was 76.4%/80.8%/23.8%/28.1% for rBlo t 2, 58.2%/73.1%/83.3%/93.8% for rBlo t 5, 98.2%/92.3%/71.4%/59.4% for rBlo t 7, and 56.4%/67.3%/52.4%/50% for rBlo t 21 respectively. Notably, rBlo t 2 is much more prominent in the allergic cohort of Selangor, rBlo t 5 for Terengganu, rBlo t 7 for Kuala Lumpur, and rBlo t 21 in Selangor as well. Allergic individual IgE antibody levels are presented in Fig. 3.

IgE antibody levels were assessed by means of direct ELISA in sera of 329 allergic individuals. Each symbol represents the result obtained with an individual serum. Short horizontal solid lines represent the median value of the group results. The cut-offs are represented by green (0.27 for rBlo t 2 assay), yellow (0.31 for rBlo t 5 assay), blue (0.28 for rBlo t 7), and red (0.26 for rBlo t 21) dashed lines, respectively.
A multinomial logistic regression approach was conducted to examine the geographical variation in the prevalence of sensitization to tested rBlo t. The CI, OR, and p-value was OR = 5.165, CI = (3.013, 8.854), P-value < 0.001 for rBlo t 2; rBlo t 5: OR = 0.776, CI = (0.500, 1.204), P-value = 0.258; rBlo t 7: OR = 2.385, CI = (1.525, 3.730), P-value < 0.001; rBlo t 21: OR = 1.489, CI = (0.930, 2.384), P-value = 0.098 respectively. Collectively, our data evidenced a statistically significant and robust relationship between sensitization to rBlo t 2, rBlo t 7 and the residential region of the patients (p < 0.001), higher sensitization rates to rBlo t 2, and rBlo t 7 being recorded in the Klang Valley (79.4% and 66% respectively) than in the East Coast (20.4% and 34%). In contrast, no significant association was observed between sensitization to rBlo t 5, rBlo t 21 and geographical location (Fig. 4a).

(a) Comparison of % sensitization rates between populations from Klang Valley and East Coast of Malaysia across native and recombinant allergen components (Blo t, rBlo t 2, rBlo t 5, rBlo t 7, rBlo t 21). Statistically significant differences are indicated (***). (b) Distribution of % sensitization rates across allergic disease types: AA (Allergic Asthma), AR (Allergic Rhinitis), ARC (Asthma with Rhinitis), and AD (Atopic Dermatitis) for the same allergen components.
Blo t and rBlo t allergens sensitization as markers for allergic diseases
A multinomial logistic regression analysis was performed to assess Blo t and rBlo t sensitization as a risk factor for the development of allergic disease. Among all the allergic diseases, AA exhibited the strongest relationship with Blo t (OR = 9.442E + 9, CI = 1.615E + 7- 5.519E + 10), suggesting a highly robust effect. Similarly, ARC and AR followed closely, with OR values of 6.853E + 9 and 4.343E + 9, respectively, indicating substantial associations supported by their respective confidence intervals (1.145E + 7 to 4.102E + 10 for ARC and 2.669E + 8 to 7.066E + 10 for AR). AD showed a slightly weaker, yet still significant, association, with an OR of 2.469E + 9 (1.465E + 8-4.162E + 10, (p < 0.001; Fig. 4b). Similarly, AA and AR exhibited the strongest relationship with rBlo t 2, 5, 7 and 21 at a p < 0.001 and the detailed OR and CI values are given in Supplementary Table 3. The consistently high odds ratios observed with AA and AR indicate a strong predictive value, which indicates that sensitization to these rBlo t allergens may help in the diagnosis of these allergic diseases.
Additionally, the analysis of rBlo t sensitization patterns across different allergic diseases reveals distinct trends in the number of allergens to which individuals are sensitized. Among individuals with AA, polysensitization is particularly prominent, with 23.9% showing sensitization to three rBlo t allergens, 19.6% being dual and quadra-sensitized respectively, and monosensitization (4.4%). In contrast, individuals with AR showed the highest rate of quadra-sensitization (21.5%), indicating a broad reactivity to Blomia allergens in this population. Although tri-sensitization is also present (12.7%), dual and mono-sensitization appear less common (11.4% and 6.3% respectively). Patients with ARC had tri-sensitization (18.5%) being the most frequent, while mono, dual and quadra- sensitization was 4.6%, 12.3%, and 15.4% respectively. AD individuals showed a unique sensitization pattern, while it has the highest rate of mono-sensitization (8.8%), it also demonstrates a high rate of quadra-sensitization (21.1%), with 8.8% and 7% reported for mono and dual-sensitization respectively.
rBlo t sensitization and ImmunoCAP grade classification
Figure 5a shows the strength and significance of associations between ImmunoCAP class and rBlo t allergens sensitization. Among the allergens, rBlo t 5 and rBlo t 7 show the strongest and most consistent associations across all ImmunoCAP classes with statistically significant p-values (p < 0.001) in nearly all cases suggesting that rBlo t 5 and rBlo t 7 could serve as key biomarkers for allergic responses in individuals with varying ImmunoCAP levels. In contrast, rBlo t 2 does not exhibit a consistent pattern across all classes but becomes statistically significant in higher ImmunoCAP classes, specifically, in Class 4 & 5. However, in lower ImmunoCAP classes (1, 2, and 3), rBlo t 2 does not show a significant relationship, indicating that its role may be more relevant in severe cases of allergic sensitization. Interestingly, rBlo t 21 consistently fails to show significant associations across all ImmunoCAP classes (p > 0.05), although not statistically significant, its high confidence intervals highlight its major role in allergic sensitization in this study cohort. Additionally, the percentage of recognized rBlo t allergens based on the different ImmunoCAP classes is given in Fig. 5b. Higher ImmunoCAP classes (Class 3 and Class 4) dominate in frequency, with Class 3 (> 3.5–17.5) consistently represents the highest percentage across all rBlo t allergens, ranging from 31% to 35%, while Class 4 (≥ 17.5–50) follows closely with 26% to 32% of cases.

(a) Forest plot of correlations between rBlo t sensitization and ImmunoCAP classification. CI > 1 and p < 0.05 indicates a positive correlation between each Blo t ImmunoCAP class and the likelihood of sensitization to rBlo t allergens, (b) rBlo t sensitization rates among the different ImmunoCAP classes (n = 180).