
Cell culture
C57BL/6 mice derived from the melanoma cell line B16F10, the colon cancer cell line MC38, the hepatocellular carcinoma cell line Hep53.4, and the normal hepatocyte cell line AML12 were obtained from the Shanghai Cell Bank and the Chinese Academy of Science (Shanghai, China).
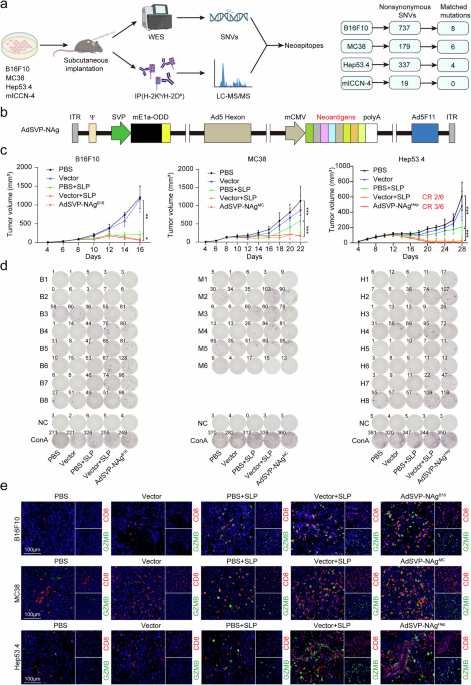
The murine ICC cell line mICCN-4 was isolated from a cholangiocarcinoma model established via murine Akt/NICD hydrodynamic injection. Specifically, 20 μg of NICD, 4 μg of Akt, and 2 μg of Sleeping Beauty transposase (SB) plasmids were dissolved in 2 mL of saline and injected into 6-week-old C57BL/6 mice via hydrodynamic tail vein injection (HTVI) within 5 s. Six weeks later, the tumor tissues were harvested and subjected to subcutaneous transplantation for further purification. Once the subcutaneous tumors reached 10 mm × 10 mm, the tumor tissues were excised, and the cell line was extracted.
All the cell lines were maintained in Dulbecco’s modified Eagle’s medium (DMEM) (Gibco, USA) supplemented with 10% fetal bovine serum (FBS) (Gibco, USA) and 1% penicillin/streptomycin (Beyotime, China) in a humidified incubator containing 5% CO2 at 37 °C.
Synthetic peptides
Synthetic peptides representing neoantigens for ELISpot assays and vaccination were synthesized by GeneScript Biotechnology (USA). The sequences of the peptides are listed in Supplementary Table 3.
SLP vaccination
The formulation of the SLP vaccine was adapted from previous studies,36 with each dose containing 20 μg of each 29-mer neoantigen peptide in Supplementary Table 3 and 50 μg of poly I:C (MedChemExpress, USA), dissolved in 200 μL of a 10% DMSO/90% PBS solution.
Mouse models
Six-week-old male C57BL/6 mice were purchased from GemPharmatech Co., Ltd. (Nanjing, China). All the animal studies were approved by the Welfare and Ethics Group of the Laboratory Animal Science Department of Fudan University, with Approval Certificate No. 2023-HSYY-287-JZS, and the animal experimental procedures strictly complied with the ethical requirements and the ARRIVE guidelines 2.0. All the mice were housed under standard specific pathogen-free (SPF) conditions with a controlled temperature (22 ± 1 °C) and a 12/12-h light/dark cycle. The health status and welfare of the mice were monitored daily. Euthanasia was performed when the mice reached predefined humane endpoints, including signs of imminent mortality, severe physiological compromise, or tumor burden accompanied by ulceration and behavioral abnormalities.
For the subcutaneous tumor model, 2 × 10⁵ or 1 × 10⁶ tumor cells resuspended in 100 µL of physiological saline were injected subcutaneously into the axillary region of the mice.
For the orthotopic tumor transplantation model, when the subcutaneous mICCN-4 tumor reached ~500 mm³ in size, the tumor tissue was harvested and cut into 1 mm × 1 mm blocks. These tumor blocks were implanted under the liver capsules of the mice, and the liver wounds were sealed with surgical glue.
For the liver metastasis model, 2 × 10⁵ mICCN-4 or 5 × 10⁵ Hep53.4 cells resuspended in 200 µL of physiological saline were slowly injected into the spleens of C57BL/6 mice.
For the lung metastasis model, 2 × 10⁵ mICCN-4 or 5 × 10⁵ Hep53.4 cells resuspended in 200 µL of physiological saline were injected into the tail vein of C57BL/6 mice.
Treatment of tumor-bearing mice
For subcutaneous tumors, the following treatments were used: intratumoral injection of 100 μL of PBS, vector, AdSVP-NAg, AdSVP-Flt3L or NeoViron; multipoint injection at seven positions (superior, inferior, left, right, anterior, central, posterior) around and within the tumor; subcutaneous injection of SLP; and intraperitoneal injection of a rat IgG isotype control (BioXcell, USA; BE0089) or anti-PD-1 antibody (BioXcell, USA; BE0146). The mice were euthanized by cervical dislocation to collect tumor tissues for subsequent analysis when the measured tumor volume reached 2000 mm³ or the maximum diameter reached 20 mm.
For the CD4/CD8 T-cell depletion experiments, the mice received intraperitoneal injections of 200 μg of anti-CD4 (Selleck, USA; A2101), anti-CD8 (Selleck, USA; A2102), or rat IgG isotype control (Selleck, USA; A2116) antibodies. The first injection was administered 2 days before initiation of the therapeutic treatment, with subsequent injections repeated every 3 days until study termination.
For orthotopic tumors, intratumoral injection of PBS, vector, or NeoViron was performed under the guidance of a small animal ultrasound system (KOLO SiliconWave 30, China).
MHC peptide immunoprecipitation and enrichment
To enrich MHC-bound peptides, 1 × 10⁸ B16F10, MC38, Hep53.4, and mICCN-4 cells or 200 mg of subcutaneous tumor tissue were lysed via lysis buffer containing 0.5% CHAPS (EMD Milipore, USA; 220201) and protease inhibitors (Thermo Fisher, USA; A32963). H-2Kb/H-2Db-specific peptides from the lysate were immunoprecipitated via anti-mouse MHC-I antibodies (BioXcell, USA; BE0077) conjugated to CNBr-activated beads (Cytivia, USA; 17043001). Peptides were eluted from the antibody-bead complexes via elution buffer containing 28% acetonitrile and 0.1% trifluoroacetic acid. The enriched peptides were subsequently desalted via a C18 column (Thermo Fisher, USA; 89870) according to the manufacturer’s instructions and evaporated to dryness via a vacuum concentrator. Before mass spectrometry analysis, the dried peptides were reconstituted in 4% formic acid.
Mass spectrometry (MS)
Peptide samples were analyzed via liquid chromatography‒tandem mass spectrometry (LC‒MS/MS) on a quadrupole Orbitrap Exploris 480 mass spectrometer (Thermo Fisher, USA) connected to an UltiMate 3000 RSLC nanoliquid chromatography system (Dionex, USA). Approximately 500 ng of peptide was loaded onto a chromatography column (150 μm inner diameter, 250 mm length, Jupiter 3 μm C18 300 Å) for separation via a gradient of 5–30% ACN-0.1% FA at a flow rate of 600 nL/min. Each full MS spectrum was acquired at a resolution of 120,000, with an injection time and spectrum acquisition using tandem mass spectrometry on the most abundant multicharged precursor ions, lasting up to a maximum of 3 s.
All mass spectrometry data were analyzed via the DeepNovo workflow of PEAKS Studio 11 for de novo peptide sequencing and searched against the Mus musculus SwissProt (2024_03) database. The peptide search parameters were set to no enzyme digestion, methionine oxidation (+15.99 Da), 15 ppm parent mass error tolerance, and 0.03 Da fragment mass error tolerance. The search results were further filtered using a 70% DeepNovo score and a 3% false discovery rate (FDR). Finally, the peptide list was refined by filtering for peptide lengths of 8–10 amino acids.
Whole exome sequencing (WES)
DNA extracted from B16F10, MC38, Hep53.4, and mICCN-4 subcutaneous tumors and C57BL/6 mouse tail tissues was subjected to WES, which was conducted by the HaploX Genomics Center. The DNA was fragmented, end-repaired, ligated with sequencing adapters, and amplified via PCR and size selection. Whole-exome capture was then performed via the Agilent SureSelect Mouse All Exon V1 capture kit. After library quality control, different libraries were pooled on the basis of their effective concentration and the target data output requirements, followed by Illumina PE150 sequencing. The effective sequencing data were aligned to the mouse reference genome mm9 via BWA (http://bio-bwa.sourceforge.net), generating alignment results in the BAM format. Somatic SNPs and Indels were identified via VarScan2 and functionally annotated via ANNOVAR.
Peptide affinity prediction
The binding affinity of 8–10 amino acid peptides generated from nonsynonymous mutations to H-2 Kb and H-2Db alleles was predicted via NetMHCpan 4.1. The binding threshold for weak binder was set at rank <2%, and that for strong binder (SB) was set at rank <0.5%. For mICCN-4, the 8–10-mer mutant peptides with a binding threshold set at rank <2% to H2-Kb or H2-Db were considered candidate neoantigens. Ten neoantigens meeting these criteria were selected for viral incorporation.
Construction of virus vectors
The construction and production of the oncolytic adenovirus vector for neoantigen delivery were based on the previously described Ad5SVPF11 (vector) and Ad5SVPF11-DsRed (AdSVP-DsRed) vectors.15 The survivin promoter was synthesized and cloned upstream of the adenovirus serotype 5 (Ad5) E1a gene. A 12-bp sequence (cacgaggctggc) within the CR2 region of E1a was deleted to generate a mutant E1a (mE1a), and the oxygen-dependent degradation (ODD) domain sequence of hypoxia-inducible factor-1a (HIF-1a) was fused downstream of mE1a as a genetic switch. Concurrently, the coding sequences for both the E1b-55kD and E1b-19kD proteins in the Ad5 E1 region were deleted. Furthermore, the fiber knob domain of Ad5 was replaced with the corresponding fragment from Ad11.
To construct AdSVP-NAg, the cDNA sequences corresponding to the 29-mer-long peptides covering the mutated epitopes were inserted into the E3 region of the oncolytic adenovirus vector in the form of tandem minigenes. To construct AdSVP-Flt3L, the gene sequence of murine Flt3L was inserted into the E3 region. For the construction of NeoViron, both the tandem minigene and the murine Flt3L gene sequences were inserted into the E3 region, which is connected by the 2A peptide sequence from the foot-and-mouth disease virus (F2A). All viruses were amplified in HEK293 cells and purified through cesium chloride gradient centrifugation. The viral titers were measured via the 50% tissue culture infective dose (TCID50) method.
Oncolytic virus infection experiments in vitro
The cells were cultured in 6-well plates and infected with vector, AdSVP-DsRed, AdSVP-NAg, AdSVP-Flt3L, or NeoViron at an MOI = 50 pfu/cell. At 0 h, 48 h, and 96 h, red fluorescence from DsRed was captured via a fluorescence microscope, and total RNA was collected for qRT‒PCR analysis to detect the expression of E1A, Flt3L, or tandem minigenes.
cDNA synthesis and quantitative real-time PCR (qRT‒PCR)
Total RNA was extracted from the cell lines via an RNA extraction kit (Beyotime, China) and reverse-transcribed into cDNA via the Prime-Script RT Reagent Kit (TaKaRa, Japan). Quantitative real-time PCR (qRT‒PCR) was performed via TB Green Fast qPCR Mix (TaKaRa, Japan) on an ABI7500 system (Thermo Fisher, USA) following the manufacturer’s protocol. Gene expression levels were normalized to those of β-actin and expressed as the relative copy number for each gene.
Flt3L quantification via enzyme-linked immunosorbent assay (ELISA)
ELISA for the measurement of Flt3L was carried out following the manufacturer’s instructions. To quantify Flt3L in the cell supernatant, the supernatant was collected after the cells were infected with AdSVP-Flt3L for ELISA analysis. To measure Flt3L levels in the blood, retro-orbital bleeding was performed on tumor-bearing mice to collect blood. The samples were centrifuged at 10,000 rpm for 10 min, and the resulting sera were used for ELISA analysis. For the measurement of Flt3L in tumor tissues, the mice were euthanized, and the tumors were excised. One hundred milligrams of tumor tissue were finely sliced and incubated at 37 °C in 200 µL of PBS for 2 h. The supernatants were then collected and analyzed via a mouse Flt3L ELISA Kit (Proteintech, USA).
ELISpot
Tumor-bearing mouse spleens were ground via a syringe plunger, filtered through a 40-μm cell strainer, and erythrocytes were lysed with erythrocyte lysing solution. Freshly isolated splenic lymphocytes (2 × 10⁵ cells/well) were cocultured with each neoantigen peptide (10 ng/µL) in RPMI-1640 medium supplemented with 10% FBS and incubated in IFN-γ ELISpot plates (Mabtech, Sweden; 3321-4AST-2) for 18–24 h at 37 °C. Negative controls were resuspended in RPMI-1640 medium supplemented with 10% FBS. The positive control groups were stimulated with ConA (Invitrogen, USA; 00-4978-93, 1:500). IFN-γ-secreting T cells were then detected via IFN-γ ELISpot assays following the manufacturer’s protocol. The developed spots were quantified via an AID iSpot ELISpot reader (AID, Germany).
Generation of murine bone marrow (BM)-derived DCs
The femurs and tibias were excised from the mice, and the skin and muscles were carefully removed. After both ends of the bones were cut, the BM cells were flushed out with RPMI medium. The cells were passed through a 70-μm filter and centrifuged at 400 × g for 5 min to pellet the cells. Red blood cells were lysed by resuspension in 3 mL of ammonium chloride-potassium lysis buffer for 3 min. The cells were then incubated at a density of 1.5 × 10⁶ cells/mL in RPMI medium containing 10% FBS. Subsequently, 20 ng/mL recombinant mouse Flt3L (PeproTech, USA; 250-31 L) or supernatants from AdSVP-Flt3L-infected tumor cells and 300 pg/mL mouse GM-CSF (PeproTech, USA; 315-03) were added to the culture. After 9 days of culture, nonadherent and loosely adherent cells were collected and gently washed with PBS for flow cytometry analysis.
Flow cytometry
To detect T cells in tumors, the tumor tissues were dissociated into single-cell suspensions, followed by the addition of 1× cell activation cocktail (BioLegend, USA; 423301) and activation at 37 °C for 4–6 h. For Fc receptor blockade, anti-mouse CD16/32 (BioLegend, USA; 101320, 1:50) was added to the cells for 10 min at 4 °C. The following antibodies were subsequently used to target surface markers: BV510 anti-mouse CD45 (BioLegend, USA; 103138, 1:50), PE/Cy7-CD3 (BioLegend, USA; 100220, 1:100), FITC-CD8a (BioLegend, USA; 100706, 1:100), BV605-CD4 (BD Biosciences, USA; 563151, 1:100), BV421-CD279 (BioLegend, USA; 135217, 1:100), and Fixable Viability Dye eFluor 780 (eBioscience, USA; 65-0865-14, 1:100). The cells were incubated with antibodies at 4 °C for 30 min, followed by fixation and permeabilization with Fix/Perm Buffer (BioLegend, USA; 426803) for 20 min. Subsequently, intracellular staining was performed via the following antibodies: APC-GZMB (BioLegend, USA; 372203, 1:20) and PE-IFN-γ (BioLegend, USA; 505808, 1:100), followed by incubation at 4 °C for 30 min.
To assess DCs, BM-derived DCs or tumor tissue cell suspensions were stained with the following antibodies targeting extracellular markers: BV510 anti-mouse CD45 (BioLegend, USA; 103138, 1:50), PE-CD11b (BioLegend, USA; 101208, 1:100), APC-CD11c (BioLegend, USA; 117310, 1:100), FITC anti-mouse I-A/I-E (BioLegend, USA; 107605, 1:200), PE/Cy7-CD103 (BioLegend, USA; 121425, 1:50), and Fixable Viability Dye eFluor 780 (eBioscience, USA; 65-0865-14, 1:100), followed by incubation at 4 °C for 30 min. The samples were subsequently analyzed via LSRFortessa flow cytometry (BD, USA), and the data were processed via FlowJo V10.8.1.
Single-cell RNA sequencing (scRNAseq)
The raw FASTQ files were generated and demultiplexed via CeleScope RNA (v.3.0.1) from Singleron, followed by primary data analysis via CeleScope (v.1.10.0) via a custom reference package based on the Mus_musculus_ensembl_92 reference genome. Downstream data analysis was performed via Seurat v5.1.0.37 The cells were filtered on two criteria: (1) the number of detected genes per cell ranged from 200–6000, and (2) the proportion of mitochondrial gene counts (UMIs from mitochondrial genes/total UMIs) was less than 10%. The gene expression data were normalized via the SCTransform function in Seurat. The normalized SCT data were reduced to two dimensions via uniform manifold approximation and projection (UMAP) for visualization, with 30 principal components (PCs) as inputs. Differentially expressed genes (DEGs) were identified via the FindMarkers function for pairwise comparisons, with a log fold-change threshold of 0.25 applied for selection. Pseudotime trajectory analysis was performed with Monocle3,38 and cell‒cell communication analysis was conducted via CellChat.39
Immunohistochemistry (IHC)
Fresh tissues removed from the mice were immediately fixed in 4% paraformaldehyde for 24 h, embedded in paraffin, and sectioned into 4 μm thick slices for immunohistochemical staining. After deparaffinization, the sections were subjected to antigen retrieval by boiling in Tris-EDTA (pH 9.0) solution for 20 min. After the sections cooled naturally to room temperature, they were incubated with 3% H2O2 for 10 min to block endogenous peroxidase activity. The sections were then blocked with normal goat serum at room temperature for 30 min, followed by incubation with the primary antibody overnight at 4 °C. After being washed with PBS, the sections were incubated with the secondary antibody at room temperature for 1 h, followed by color development via 3,3’-diaminobenzidine (DAB). Finally, the sections were counterstained with hematoxylin and scanned via a Pannoramic Midi digital slide scanning analysis system (3D Histech). The following primary antibodies were used: anti-cytokeratin 19 (Abcam, USA; ab52625, 1:1,000) and anti-adenovirus type 5 E1A (Abcam, USA; ab204123, 1:100).
Tyramide signal amplification (TSA) multicolor immunohistochemistry
The sections were deparaffinized, subjected to antigen retrieval, endogenous peroxidase blocking, and blocking of nonspecific binding. During each staining cycle, the sections were incubated overnight at 4°C with different primary antibodies. The sections were subsequently incubated with HRP-labeled secondary antibodies at room temperature for 1 h, followed by staining with TSA fluorophores (AiFang Biological, China) for 8 min. The sections were placed in boiling antigen retrieval solution for 20 min to elute the antibodies. After the above steps were repeated, the sections were sequentially incubated with primary and secondary antibodies, followed by staining with TSA fluorophores (TYR-480, TYR-520, TYR-570, and TYR-690) in the specified order. Finally, the sections were stained with DAPI for 10 min and scanned via a Pannoramic Midi digital slide scanning system (3D Histech). The following primary antibodies were used: anti-CD8 alpha antibody (Abcam, USA; ab217344, 1:1000), anti-Granzyme B antibody (Abcam, USA; ab255598, 1:1000), anti-CD103 antibody (Abcam, USA; ab224202, 1:1000), anti-MHC class II antibody (Abcam, USA; ab23990, 1:500), CD69 rabbit PolymAb (ABclonal, China; A26620PM, 1:500), TCF1/TCF7 rabbit mAb (Cell Signaling Technology, USA; 2203, 1:500), and anti-CD8 alpha antibody (Abcam, USA; ab237709, 1:1000).
Statistical analysis
Statistical analysis was performed via GraphPad Prism 10.1.2, with details and methods provided in the figure legends or main text. Two-tailed Student’s t test was used to analyze differences between two groups, whereas two-tailed one-way ANOVA or two-way ANOVA was used for comparisons among more than two groups. Survival curves were generated via Kaplan‒Meier estimates, and p values were calculated via the log-rank test. A p value of <0.05 was considered statistically significant. All the data were analyzed in a double-blinded manner by two statisticians.