
Biallelic Knockout of STAT1 alters cellular cholesterol metabolism and homeostasis
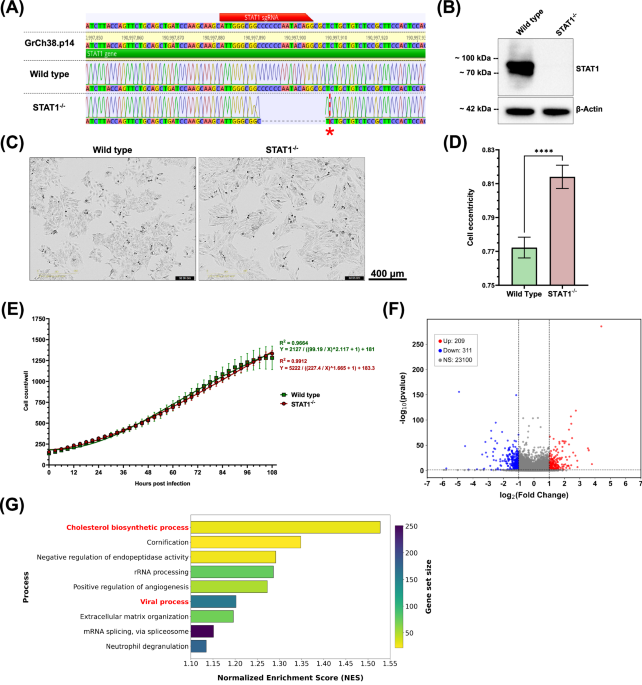
For the generation of a STAT1−/− HEp-2 cell line, a CRISPR-Cas9-mediated knockout was performed targeting the first exon of the STAT1 gene (ENSG00000115415). Oxford Nanopore sequencing of the resulting clone revealed a biallelic, compound heterozygous deletion of 16 base pairs (bp) and 17 bp, occurring just after the sgRNA binding site (Fig. 1A). We verified the knockout at protein level in the HEp-2 clone by western blotting for STAT1 (Fig. 1B). While STAT1 was abundant in wild-type HEp-2 cells, no expression was detected in the STAT1−/− clone, confirming the knockout on both genetic and protein levels. Transcriptomic comparison of wild-type and STAT1−/− HEp-2 cells further showed an almost two-fold reduction of STAT1 expression in STAT1−/− cells, while a minor decrease in the expression of STAT1 dimerization partners (STAT2-5) was also observed (Supplementary Figure 1a). Since STAT1 is involved not only in immune response signaling but also in cellular homeostasis18, we continued to characterize the STAT1−/− HEp-2 cell line in terms of cellular growth and morphology compared to wild-type HEp-2 cells. Cellular expansion of both wild-type and STAT1−/− HEp-2 cells was quantified over 4.5 days using IncuCyte Live-cell imaging (Fig. 1C,D). Bright-field images of wild-type HEp-2 cells revealed a triangular to polygonal shape typical of epithelial cells (Fig. 1C, left), while STAT1−/− HEp-2 cells were elongated and spindle-shaped (Fig. 1C, right). This observation was supported by the significantly increased eccentricity of STAT1−/− cells compared to wild-type cells (Fig. 1D, Supplementary Figure 1b). Comparison of cell growth kinetics revealed no significant differences between wild-type and STAT1−/− HEp-2 cells (p = 0.9572) (Fig. 1E). We continued to analyze the effect of STAT1 deletion in HEp-2 cells by RNA-Seq (Fig. 1E,F). Our analysis revealed that 209 genes were upregulated, and 311 genes were downregulated in STAT1−/− HEp-2 cells compared to wild-type cells (Fig. 1F). Transcriptomic analysis of wild-type and STAT1−/− HEp-2 cells was continued by Gene Set Enrichment Analysis (GSEA) using Gene ontologies (GO) terms, characterizing broad biological processes and functions, and Reactome databases, allowing mechanistically detailed comparison of signaling pathways. The GSEA GO analysis revealed significant enrichment of gene sets related to cholesterol biosynthetic processes, with a Normalized Enrichment Score (NES) of 1.53 (Fig. 1G). These findings are supported by Reactome pathway analysis, which highlights the enrichment of cholesterol biosynthesis-related pathways with NESs ranging from 1.35 to 1.5 (Supplementary Fig. 1b). Genes assigned to these processes can be classified into four clusters: 1) Genes directly involved in cholesterol biosynthesis (HMGCS1, HMGCR, MVK, MVD, FDPS, FDFT1, SQLE, LSS, MSMO1, NSDHL, EBP, CYP51A1, TM7SF2, HSD17B7, DHCR7, DHCR24, SC5D, GGPS1), 2) Transcription (co-)factors controlling cholesterol biosynthesis (SREBF2, CREBBP, CARM1, TBL1X, NFYB, NFYC, NCOA6, MTF1), 3) Indirect modulators of cholesterol homeostasis (ACAA2, ACACA, SCD, ELOVL6, FASN, GPAM), and 4) Regulators of cholesterol biosynthesis and homeostasis (INSIG1, INSIG2, PRKAA2, ACAT2, KPNB1, SEC24C). A summary of the clusters, the involved genes, and expression trend is provided in Supplemental Table 2.

A Sequence alignment of wild-type and STAT1−/− to STAT1 gene of the human genome (GrCh38.p14). The red bar indicates the binding site of sgRNAs. The red star indicates the 17 bp deletion on the second allele. B Western blot of whole cell lysates of wild-type and STAT1−/− HEp-2 cells targeting STAT1 (top) and β-Actin (bottom) as loading control. C Bright-field IncuCyte live-cell images of wild-type (left) and STAT1−/− HEp-2 (right) at 72 hours (h) post-seeding. Images representative of three independent experiments (10 technical replicates). Scale bar indicated next to images. D Quantification of cell eccentricity for wild-type and STAT1−/− HEp-2 cells at 72 h post-seeding based on live cell images. Eccentricity was assessed at approximately 60% confluence, which was reached at 72 h post-seeding for both cell types. Minimum area, minimum eccentricity, and Hole fill were set to 600 μm2, 0.3, and 1000 μm2, respectively. Mean ± SD from three independent experiments, with 10 replicates each, are shown. Statistical analysis: Unpaired t-test. E Quantitative analysis of IncuCyte live-cell images for cells per well, with images taken every 3 h for 4.5 days. Mean ± SD of three independent experiments (10 technical replicates) is shown, with non-linear regressions applied for wild-type (green) and STAT1−/− (red) HEp-2 cells. Statistical analysis: Mann-Whitney test for comparison of ranks. F Volcano plot demonstrating the number of differentially expressed genes between wild-type and STAT1−/− HEp-2 cells with thresholds p < 0.05 and |Log2 Fold change | ≥ 1. G Bar plot of Gene Set Enrichment Analysis of Gene Ontology. The plot shows significantly enriched biological processes in STAT1−/− compared to wild-type HEp-2 cells.
Notably, expression of these genes was significantly lower in STAT1−/− HEp-2 cells compared to expression in wild-type HEp-2 cells, except for DHCR7, NFYB, SC5D, and INSIG2, which were significantly higher in STAT1−/− cells.
No differences in RSV replication kinetics but increased cell fusion in STAT1−/− HEp-2 cells
We continued to characterize the effect of STAT deletion in the context of viral infection. Since STAT1 signaling is pivotal for the initiation of antiviral responses, its absence may benefit viral replication and spread in STAT1−/− HEp-2 cells. We quantified infectious viral particles in whole-cell preparations of RSV-A-0594 or rRSV-A-0594-eGFP-infected wild-type and STAT1−/− HEp-2 cells for up to five days post-infection by TCID50 assay (according to Reed and Muench42). For both cell types, a significant increase in RSV titers was observed for both virus strains, with titers peaking at 96 hpi (Fig. 2A). Direct comparison of viral titers revealed no significant difference at any time point between the two cell types. Although viral titers did not differ significantly between wild-type and STAT1−/− HEp-2 cells, we observed differential pathophysiology upon infection (Fig. 2B). Microscopic analysis of rRSV-A-0594-eGFP-infected wild-type and STAT1−/− HEp-2 cells at 48 hpi revealed large syncytia formation in STAT1−/− HEp-2 cells, which was observed for the wild-type HEp-2 cells only to a limited extent. RNA-Seq analysis of viral mRNA upon infection with rRSV-A-0594-eGFP revealed no significant differences in the abundance of viral transcripts at 0, 12, and 24 hpi (Fig. 2C, Supplementary Figure 2a), while at 48 hpi, a significantly increased expression was only observed for the viral polymerase (RSV L protein) in STAT1−/− HEp-2 cells (Log2FC = 1.2). To characterize the effect of altered STAT1 signaling and increased syncytia formation on inhibition of RSV infection, fusion inhibition assays were performed using Presatovir, a small-molecule F protein inhibitor currently in clinical trials for therapeutic treatment of RSV-infected individuals (NCT04938830)43,44,45. A similar kinetic was observed between the two cell types and comparison of inhibition dynamics based on a non-linear fit of the data revealed no significant difference between wild-type and STAT1−/− HEp-2 cells (P[Hill slope] = 0.1137) and in neither cell type eGFP expression was detectable at a Presatovir concentration of 125 nM (Fig. 2D, Supplementary Fig. 2b). Calculation of the half maximal inhibitory concentration (IC50) based on the non-linear fitted graphs showed a significantly increased value for STAT1−/− HEp-2 (1.6 nM) compared to wild-type HEp-2 (1.1 nM).

A Viral replication kinetics of RSV-A-0594 (dashed lines) and rRSV-A-0594-eGFP (solid lines)-infected wild-type (green) and STAT1−/− (red) HEp-2 cells (MOI 0.05). Mean ± SD of three independent experiments (four technical replicates) is shown. Statistical analysis: Two-way ANOVA with Fisher’s LSD test. B Fluorescence images of rRSV-A-0594-eGFP-infected (MOI 0.05) wild-type (top) and STAT1−/− (bottom) Hep-2 cells at 48 hours post-infection (hpi). Images representative of three independent experiments (two technical replicates). Scale bar indicated next to images. C Graph showing the comparison of viral transcript numbers from RNA-Seq analysis between wild-type and STAT1−/− HEp-2 cells from 0 to 72 hpi with thresholds set at p < 0.05 and |Log2 Fold change | ≥ 1. D Presatovir-based fusion inhibition assay on wild-type (green) and STAT1−/− (red) HEp-2 cells at 72 hpi with rRSV-A-0594-eGFP (MOI 0.05). Fluorescence intensity (eGFP) relative to untreated, infected cells is shown. Solid lines indicate mean values, while dashed lines above and below each curve indicate the corresponding standard deviation (Mean ± SD). Horizontal dashed line and the right graph indicate Half Maximal Inhibitory Concentration (IC50) of wild-type (green) and STAT1−/− (red) HEp-2 based on non-linear regression fitted to graphs. Mean ± SD of three independent experiments (eight technical replicates) is shown. Statistical analysis for IC50 comparison: Unpaired t-test with Welsh’s correction.
Cellular cholesterol levels affect fusion events upon RSV infection
We continued to analyze differences in gene expression upon rRSV-A-0594-eGFP infection of STAT1−/− and wild-type HEp-2 cells using RNA-Seq. To exclude any differences in background gene expression between the two cell types, gene expression of infected STAT1−/− and wild-type HEp-2 cells was first compared to the respective uninfected samples, followed by comparison of DEGs and GSEA of GO and Reactome databases between STAT1−/− and wild-type HEp-2 cells. This comparison of DEGs showed that, after RSV infection, 59 genes were unique to wild-type HEp-2 cells, 37 genes were exclusively differentially expressed in STAT1−/− HEp-2 cells, and 260 genes were differentially expressed in both cell types (Fig. 3A). We continued to analyze possible differences in DEGs, that were shared between the two cell types, by GSEA of GO (Fig. 3B) and Reactome pathway analysis (Supplementary Fig. 2c), as the majority of genes that were unique to infected wild-type HEp-2 cells were related to cytokine signaling and those unique to infected STAT1−/− cells related to intracellular stress responses. Pathways and processes linked to inflammatory responses and interferon signaling in response to viral infections were enriched in both wild-type HEp-2 cells and STAT1−/− cells, with higher NESs in wild-type HEp-2 cells. We categorized the genes assigned to these processes and pathways into six clusters: 1) ‘Innate immune sensors’ (e.g., IFIH1 [Melanoma Differentiation-Associated protein 5, MDA-5], DDX58 [Retinoic Acid-Inducible Gene I, RIG-I], DHX58 [Laboratory of Genetics and Physiology 2, LGP2], TMEM173 [Stimulator of Interferon Genes, STING], IFI16), 2) ‘Antigen processing and presentation’ (e.g., HLA-B, TAP1, PSMB8, B2M, HLA-C), 3) ‘Host factors involved in viral replication’ (e.g., EIF4G1, NUP98, DDX3X, NXF1, RANBP2), 4) ‘Stress response regulators’ (e.g., BAX, BNIP3, CFLAR, HSPA8, CASP1 [caspase 1]), 5) ‘Immune signaling and transcription regulators’ (e.g., STAT1, STAT3, JAK1, IRF7, IRAK1), and 6) ‘Interferon-stimulated genes’ (e.g., ISG15, IFIT1, RSAD2 [Viperin], TRIM25, OAS1). An overview of genes assigned to these clusters and their respective expression trend is provided in Supplemental Table 3. Most of the genes in clusters 1, 2, 4, 5, and 6 were significantly upregulated in infected wild-type HEp-2 and STAT1−/− HEp-2 cells compared to the respective uninfected control, although gene expression levels were mainly lower in infected STAT1−/− cells (especially for clusters 5 and 6). While the expression trends for clusters 1, 2, 4, 5, and 6 were comparable between infected wild-type and STAT1−/− cells, we noticed differences in the expression of genes assigned to cluster 3 (‘Host factors involved in viral replication’). Most Cluster 3 genes were significantly downregulated in infected wild-type HEp-2 cells. In contrast, their expression was significantly upregulated in infected STAT1−/− cells compared to the respective uninfected controls. Besides innate responses and interferon signaling, cholesterol biosynthesis-related processes and pathways were highly enriched in both cell types, with a stronger enrichment in STAT1−/− cells compared to wild-type HEp-2 cells, except for the ‘sterol biosynthetic process’, which had a higher NES in wild-type HEp-2. Genes assigned to these processes were again clustered into four categories, based on their role during cholesterol biosynthesis, namely direct involvement (FDPS, MSMO1, DHCR7, SQLE, MVD, HMGCR, HSD17B7, FDFT1, HMGCS1, LSS, DHCR24, EBP, MVK, CYP51A1, NSDHL, TM7SF2, GGP51, SC5D, IDI1), transcription (co-)factors (CARM1, SCAP, HELZ2, MTF1, CREBBP, TBL1X, NCOA6, SREBF2), indirect modulators (ACLY, CYB5R3, FASN, ELOVL6, ACACA, SCD, G6PD), and direct regulators (INSIG1/2, ACAT2). The summary of the mentioned clusters, including assigned genes and their expression trend compared to uninfected samples, is provided in Supplemental Table 4. Notably, most of the mentioned genes were significantly downregulated in infected wild-type HEp-2 cells compared to uninfected cells, while the majority were significantly upregulated in STAT1−/− HEp-2 cells. Similar to wild-type HEp-2 cells, expression of FDFT1, DHCR24, TM7SF2, SC5D, IDI1 (all directly involved in cholesterol biosynthesis), and SCD (direct regulator) was significantly downregulated in STAT1−/− HEp-2 cells compared to uninfected cells. Comparing transcriptomic data from wild-type and STAT1−/− HEp-2 cells under both homeostatic and infection conditions revealed a link between STAT1 signaling and intracellular cholesterol metabolism. We sought to validate this finding with follow-up experiments focusing on the effect of absent STAT1 signaling on intracellular cholesterol levels. Lysed STAT1−/− HEp-2 cells displayed a significant two-fold increase in total, free cholesterol levels compared to lysed, wild-type HEp-2 cells, in the absence of both infection and stimulation (Fig. 3c). We continued to assess the changes in cholesterol content upon infection, stimulation with IFN-α2/IFN-γ, or treatment with M\({\rm{\beta }}\)CD, a compound that depletes cholesterol from cellular membranes, at 24 and 48 h post-treatment (Fig. 3d). Treatment of wild-type cells with M\({\rm{\beta }}\)CD resulted in a significant decrease in free cholesterol compared to untreated cells, with over threefold and fivefold reductions observed at 24 and 48 hpi, respectively. Comparably, infection of wild-type HEp-2 with RSV-A-0594 (MOI 0.05 and MOI 0.5) and stimulation of cells with IFN-α2/IFN-γ resulted in significant decreases in free cholesterol levels by at least two-fold. Comparable to wild-type HEp-2, treatment of STAT1−/− HEp-2 cells with MβCD resulted in a significant sixfold reduction in free cholesterol levels. Upon infection with RSV-A-0594 (MOI 0.05 and MOI 0.5), free cholesterol levels in STAT1−/− HEp-2 were significantly decreased by at least 1.5-fold. In contrast to wild-type HEp-2 cells, stimulation of STAT1−/− HEp-2 cells with IFN-α2/IFN-γ resulted in no significant changes at 24 (p = 0.6777) or 48 hpi (p = 0.8827) compared to uninfected, untreated STAT1−/− HEp-2 cells. Significant differences between wild-type and STAT1−/− HEp-2 cells were also observed. More specifically, free cholesterol levels were significantly elevated in untreated STAT1−/− cells at 24 and 48 hpi (1.5-fold and 1.4-fold, respectively), at 48 hpi in infected samples (1.5-fold for MOI 0.05, 1.8-fold for MOI 0.5), as well as 48 h after stimulation with IFN-α2/IFN-γ (2.8-fold).

A UpSet plot demonstrating differentially expressed genes that are shared and unique to infected wild-type and STAT1−/− HEp-2 after comparison to respective uninfected controls with thresholds p < 0.05 and |Log2 Fold change | ≥ 1. B Cleveland Dot Plot of Gene Set Enrichment Analysis (GSEA) of Gene Ontology comparing processes enriched in both infected wild-type and STAT1−/− HEp-2 cells based on Normalized Enrichment Scores (NES). C Quantification of total free cholesterol by luminescent enzymatic assay in uninfected wild-type (green) and STAT1−/− (red) HEp-2 cells. Statistical analysis: Mann-Whitney test. D Quantification of total free cholesterol by luminescent enzymatic assay in wild-type and STAT1−/− HEp-2 cells, which were uninfected (grey), treated with 5 mM methyl-beta-cyclodextrin (MβCD, orange), infected at MOI 0.05 (light red), infected at MOI (dark red), or treated with 100 ng/ml IFN-α2 and 50 ng/mL IFN-γ at 24 and 48 hpi. Only significant differences between untreated and treated cells within a cell type or within treatments between cell types are shown. Statistical analysis: two-way ANOVA with Fisher’s LSD test. Mean ± SD of four independent experiments (two technical replicates) shown for (C, D).
Depletion of cholesterol in STAT1−/− cells reduces syncytia size
Since the data shown above reveal a link between functional STAT1 signaling and intracellular cholesterol levels, we further investigated the dependency of virus-mediated cell fusion on cellular cholesterol levels using fluorescence microscopy. We used Filipin III, a fluorescent cholesterol-specific probe, to visualize free cholesterol in the plasma membrane of rRSV-A-0594-eGFP-infected or uninfected wild-type and STAT1−/− HEp-2 cells at 0 and 48 hpi (Fig. 4, Supplementary Figs. 3–5). To assess differences in signal intensity between cell types and treatments, Filipin III staining intensity was quantified, and corrected total cell fluorescence was calculated (Supplementary Figure 6). As observed in previous experiments, infection of STAT1−/− cells induced increased syncytia formation compared to wild-type HEp-2 cells, while no significant differences in surface cholesterol levels were observed (Fig. 4, Supplementary Fig. 6). Next, we assessed the effect of reduced cholesterol levels on syncytia formation in infected cells by the addition of cholesterol-lowering agents. Treatment with GFZ, a PPAR-α agonist that primarily modulates lipid metabolism but also alters cholesterol transport, did not result in significant changes in Filipin III staining (Supplementary Figure 6), indicating that GFZ does not alter free cholesterol levels in the membrane but rather affects intracellular cholesterol levels. Depletion of cholesterol by MβCD treatment of wild-type and STAT1−/− HEp-2 cells led to a significant reduction in surface free cholesterol at 0 hpi in both uninfected and infected cells (Supplementary Figs. 3, 4a, 5a, 6a,c). However, surface cholesterol levels returned to levels of untreated cells by 48 hpi, indicating that MβCD treatment only transiently affects cellular cholesterol levels (Fig. 4, Supplementary Figs. 4b, 5b, 6b,d). Although treatment of wild-type and STAT1−/− HEp-2 cells with GFZ (with or without MβCD) did not alter surface cholesterol levels at 48 hpi, we observed a visible reduction in syncytia size in both cell types (Fig. 4). Incubation of wild-type and STAT1−/− HEp-2 cells with 25-HC, an oxysterol and inhibitor of cholesterol biosynthesis by suppressing the activation of the SREBP pathway, resulted in a significant decrease in Filipin III staining at 48 hpi and, therefore, free cholesterol in the plasma membrane, in both infected (Fig. 4) and uninfected cells (Supplementary Figs. 4b, 5b, 6b,d), along with a visible reduction in syncytia size. While in GFZ/GFZ + MβCD-treated cells, syncytia still seemed to be slightly increased in STAT1−/− cells compared to treated wild-type cells, no visible difference was noted between wild-type and STAT1−/− HEp-2 cells upon 25-HC treatment with infection limited to individual cells. The corresponding bright-field images of infected/uninfected and treated/untreated wild-type and STAT1−/− HEp-2 cells are shown in Supplementary Figs. 7 and 8.

Representative fluorescence images of rRSV-A-0594-eGFP-infected wild-type (A) and STAT1−/− (B) HEp-2 cells (MOI 0.05) at 48 hpi. Cells were left untreated (first row), treated with 50 μM Gemfibrozil (GFZ, second row), treated with 5 μM methyl-β-cyclodextrin (MβCD) and 50 μM GFZ (third row), or with 10 μM 25-hydroxycholesterol (25-HC, bottom panel). Free cholesterol in plasma membranes was visualized by Filipin III staining (0.05 mg/ml), and DNA was visualized by Propidium iodide (PI) staining (5 μg/ml). Images representative of three independent experiments (two technical replicates). Scale bar indicated next to images.
We further validated a possible link between cholesterol levels and syncytia formation by quantifying differences in syncytia size in the absence or presence of cholesterol-lowering agents. To this end, rRSV-A-0594-eGFP-infected wild-type and STAT1−/− HEp-2 cells were imaged over 48 h using an IncuCyte live-cell imager (Fig. 5a, Supplementary Figs. 9–12). Quantification of syncytia size relative to the number of eGFP-positive cells (Green Area per Image/ Green object count per image) and statistical comparison of syncytia size over the course of infection confirmed our previous observations (Fig. 5b). The size of eGFP+ cells was significantly smaller in wild-type HEp-2 cells compared to STAT1−/− HEp-2 cells (red lines). Syncytia size in wild-type HEp-2 cells reached a plateau at 36 hpi, while it peaked at 45 hpi for STAT1−/− cells. No significant changes were observed in syncytia size upon treatment of infected wild-type HEp-2 cells with cholesterol-lowering drugs (p > 0.99), whereas treatment of infected STAT1−/− cells resulted in a significant reduction of syncytia size (1.3-fold). No significant differences were observed between GFZ and 25-HC treatment in STAT1−/− cells (p > 0.99). Direct comparison of treated STAT1−/− cells to treated, wild-type HEp-2 cells (GFZ, 25-HC) revealed significantly increased syncytia formation in both treatments for STAT1−/− cells. No significant differences were observed in the syncytia size of treated STAT1−/− cells compared to those of untreated, infected wild-type HEp-2. Notably, differences in the kinetics of syncytia formation were observed between 25-HC and GFZ treatment for both wild-type and STAT1−/− cells. While syncytia size increased throughout the experiment in GFZ-treated cells, syncytia size increased rapidly upon 25-HC treatment, peaking at 36 hpi, followed by a rapid decline afterwards.

A Fluorescence images from IncuCyte live-cell imaging of rRSV-A-0594-eGFP-infected wild-type (left) and STAT1−/− (right) HEp-2 cells (MOI 0.05), which were left untreated (left column), treated with 50 μM Gemfibrozil (GFZ, middle column), or with 10 μM 25-hydroxycholesterol (25-HC, right column) at 12, 24, 36, and 48 hpi. Images representative of three independent (two technical replicates) experiments. Scale bar indicated next to images. B Quantification of syncytia size by IncuCyte live-cell imaging for green (fluorescent) area per image relative to green object count per image of rRSV-A-0594-eGFP-infected wild-type (solid lines) and STAT1−/− (dashed lines) HEp-2 cells (MOI 0.05), either untreated (red), treated with 50 μM GFZ (blue), or 10 μM 25-HC (green). Images of cells were taken every hour for up to 48 hpi. Mean ± SEM of eight independent experiments (two technical replicates) is shown. Statistical analysis was conducted on the overall distribution of syncytia size during the course of infection using the Friedman test with Dunn’s multiple-comparison test.
The role of cholesterol in the transport and stability of RSV F protein
Fundamental to RSV dissemination and syncytia formation is the transport of the viral F protein to the cell surface and its integration into the membrane. To determine if the distribution of the F protein is affected by changes in intracellular cholesterol levels, we performed immunofluorescence staining targeting the F protein in the PostF conformation on the surface of rRSV-A-0594-eGFP-infected wild-type and STAT1−/− HEp-2 cells, both with and without cholesterol-lowering drugs (Fig. 6). In untreated, infected wild-type HEp-2 cells, the PostF protein appeared evenly distributed on the cell surface of individual infected cells, especially on the surface of syncytia (Fig. 6A). This pattern of PostF expression on the cell surface was even more pronounced on infected, untreated STAT1−/− HEp-2 cells, with PostF forming an even and intense border along large syncytia that distinguished them from uninfected, neighboring cells (Fig. 6B). The even distribution of PostF observed in untreated wild-type and STAT1−/− RSV-infected HEp-2 cells was disrupted after treatment with GFZ and 25-HC. Confocal imaging revealed a bulging morphology of RSV-induced syncytia in HEp-2 cells, resulting in minor variations in apparent nuclear size attributable to Z-stack focus positioning rather than treatment effects or imaging inconsistencies. The corresponding images of uninfected, treated wild-type and STAT1−/− HEp-2 cells are shown in Supplementary Fig. 13. Having demonstrated that intracellular cholesterol levels influence the distribution and abundance of the RSV F protein, we aimed to analyze the integration of the F protein into cellular membranes in the absence or presence of cholesterol-lowering agents. We performed western blot analysis on rRSV-A-0594-eGFP-infected wild-type and STAT1−/− HEp-2 cells, targeting the PreF and PostF proteins in the membrane fractions, as well as total F protein in whole cell lysates (Fig. 7). Western blots showed visually comparable levels of PreF and PostF in the membrane fractions of infected, untreated cells, which were similar between wild-type (Fig. 7a) and STAT1−/− HEp-2 (Fig. 7b) cells. Levels of total F in whole cell lysates, however, were markedly reduced in STAT1−/− HEp-2 cells compared to wild-type HEp-2 cells. Upon treatment with GFZ or GFZ in combination with MβCD, a slight increase in PostF was observed in membrane fractions of both wild-type and STAT1−/− HEp-2, while PreF total F were comparable or slightly reduced compared to untreated controls. This change was also visible upon treatment of infected wild-type and STAT1−/− HEp-2 cells with 25-HC. While a band for PreF was still visible in wild-type HEp-2 cells, no PreF was detectable in the membrane fraction of STAT1−/− HEp-2 cells. Notably, levels of total F protein in whole cell lysates were markedly increased in both cell types upon 25-HC treatment.

Confocal microscopy images of RSV-A-0594-infected wild-type (A) and STAT1−/− (B) HEp-2 cells (MOI 0.05) at 48 hpi. Infected cells were left untreated (top), treated with 50 μM Gemfibrozil (GFZ, middle), or 10 μM 25-hydroxycholesterol (25-HC, bottom). Cells were stained for RSV postfusion F protein on the cell surface. Intracellular actin was visualized by ActinRed staining and nuclei by NucBlue staining. Images representative of three independent experiments (two technical replicates). Scale bar indicated next to images.
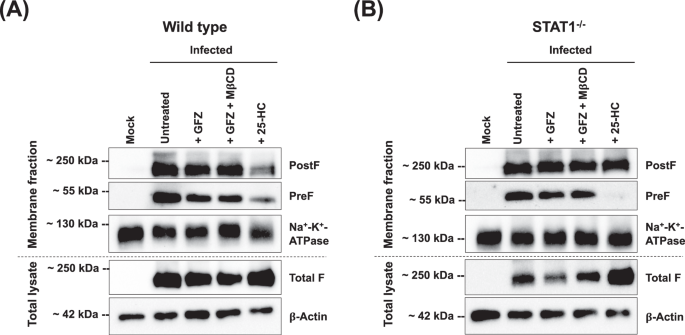
Western blot of membrane fractions and total cell lysates in uninfected (‘Mock’) and rRSV-A-0594-eGFP-infected (MOI 0.5) wild-type (A) and STAT1−/− HEp-2 (B) HEp-2 cells at 48 hpi. Infected cells were left untreated, treated with 50 μM Gemfibrozil (GFZ), treated with 5 μM methyl-β-cyclodextrin (MβCD) and 50 μM GFZ, or with 10 μM 25-hydroxycholesterol (25-HC). Membrane fractions were stained for prefusion F protein, postfusion F protein, and Na+-K+-ATPase (loading control). Total cell lysates were stained for total F protein (prefusion and postfusion conformation) and β-Actin (loading control). Images representative of three independent experiments.