
Animals
Commercially available 8-week-old T2D mice (db/db mouse, The Jackson Laboratory homozygous BKS.Cg-Dock7m +/+ Leprdb/J, male) were purchased, as were lean littermate controls (heterozygous Dock7m +/+ Leprdb). Animals were kept under pathogen-free conditions, 12 h light–dark cycle, controlled temperature (20–22 °C) and fed chow and water ad libitum. Circulating glucose (tail sample, Accu-Check, Roche) and body weight were monitored weekly. This investigation conformed to UK Home Office Guidance on the Operation of the Animals (Scientific Procedures) Act, 1986.
AZD1656 drug treatment protocol
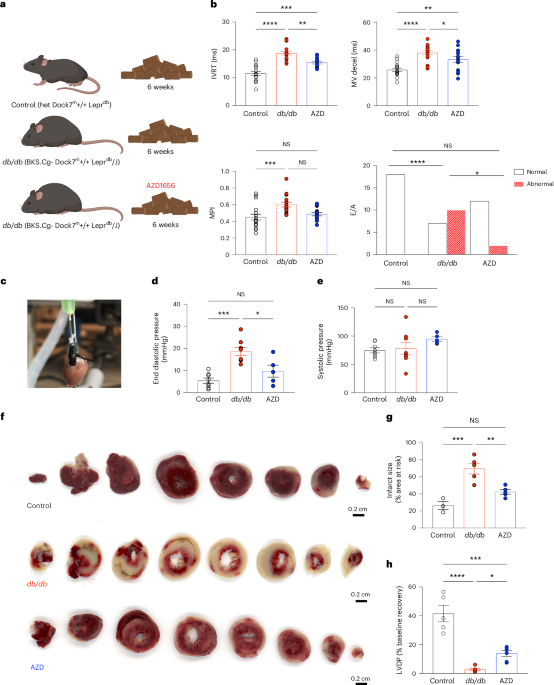
AZD1656 (AZD) is a selective glucokinase activator. No significant clinical effects nor specific toxicology risks, other than hypoglycemia, were noted in clinical trials58. The db/db and lean controls were divided into 3 groups at 13 weeks of age: group 1, lean controls, Envigo diets control diet (2019 Teklad Global 19% Protein Rodent Diet, irradiated, Teklad Custom Diets, Envigo); group 2, db/db, Envigo diets control diet; group 3, db/db, AZD1656 diet (30 mg kg−1 body weight per day, Envigo Specialist Diets; drug dosing based on refs. 59,60) (Fig. 1a). Diets were fully matched in terms of nutritional standardization and food intake was not affected by dietary drug incorporation. Animals (study total: group 1, controls n = 64; group 2, db/db n = 63; group 3, AZD1656 n = 57) were kept on the feeding protocol from 14 until 20 weeks of age when the study reached endpoint. For the obesity-induction protocol, C57/BL6 8-week-old male mice (n = 18, Charles River) were fed a high-fat diet for 12 weeks ad libitum (HFD, cat. no. TD.200185; Envigo, 60.3% fat, 21.4% carbohydrate, and 18.3% protein; percentage of energy in kcal)52. In vivo physiology and heart function, as well as the ex vivo cardiac metabolome, were assessed as has been described52.
Body composition analysis
Body composition analysis was carried out by non-invasive magnetic resonance relaxometry using an EchoMRI Body Composition Analyser E26-348-MT. The accumulation factor was for extra-high precision (3×) resulting in a scan time of approximately 2.5 min.
In vivo assessment of left ventricular systolic and diastolic function
CINE magnetic resonance imaging
For the assessment of systolic function, mice were imaged in a 7T MRI instrument (Agilent) using CINE magnetic resonance imaging, as previously described61. Eight to 10 short-axis slices (slice thickness, 1.0 mm; matrix size, 256 × 256; field of view, 25.6 × 25.6 mm; echo time/repetition time, 0.3/4.6 ms; flip angle, 30°; and number of averages, 4) were acquired with a gradient echo, fast low-angle shot sequence62. Left ventricular volumes were derived using the freehand draw function in ImageJ (National Institutes of Health). For each heart, left ventricular mass, ejection fraction, stroke volume and cardiac output were calculated.
Echocardiography
M-mode and Doppler echocardiography was performed in 20-week lean controls, db/db and AZD1656-treated db/db mice at the end of the drug-treatment protocol as previously described52,63. Anesthesia was induced with 4% isoflurane and maintained at 1.5–2% for the duration of the procedure. Echocardiography images were recorded using a Vevo-3100 imaging system with a 40-MHz linear probe (VisualSonics). Morphological measurements were taken in the parasternal short axis view at the level of the papillary muscles, and the ejection fraction was calculated from M-mode images. Diastolic transmitral left ventricle (LV) inflow images were acquired from apical four-chamber views using pulsed-wave doppler to calculate early (E) and late (atrial, A) peak filling blood flow velocities and E-wave deceleration time. Analysis was performed using VevoLab 5.5.1 software. Researchers were blinded to phenotype when assessing cardiac function.
Hyperpolarized magnetic resonance spectroscopy
For the in vivo assessment of cardiac metabolism, hyperpolarized magnetic resonance spectroscopy was used to monitor the downstream fate of hyperpolarized [1-13C]pyruvate, as previously described64. Experiments were performed between 7 and 11 a.m., when mice were in the fed state. A total of 40 mg [1-13C]pyruvic acid (Sigma-Aldrich) doped with 15 mmol L−1 trityl radical (OXO63; GE Healthcare) and 3 ml Dotarem (1:50 dilution; Guerbet) was hyperpolarized in a prototype polarizer, with 30–60 min of microwave irradiation65. The sample was subsequently dissolved in a pressurized and heated alkaline solution, containing 2.4 g L−1 sodium hydroxide and 100 mg L−1 EDTA dipotassium salt (Sigma-Aldrich), to yield a solution of 80 mmol L−1 hyperpolarized sodium [1-13C]pyruvate with a polarization of ~30%. A total of 200 μl was injected over 10 s through the tail vein. 13C MR pulse–acquire cardiac spectra were acquired over 60 s following injection of hyperpolarized [1-13C]pyruvate (repetition time, 1 s; excitation flip angle, 15°; sweep width, 13,021 Hz; acquired points, 2,048; and frequency centred on the C1 pyruvate resonance)64. The 13C label from pyruvate and its metabolic products was summed over 60 s from the first appearance of pyruvate and fitted with the AMARES algorithm in jMRUI66. Data are reported as the ratio of metabolic product to the [1-13C]pyruvate signal to normalize for differences in polarization and delivery time.
Langendorff heart perfusions
Mice were terminally anesthetized. Their hearts were rapidly excised, cannulated and perfused, following standard Langendorff preparation as previously described67. The Krebs-Henseleit (KH) perfusion buffer was continuously gassed with 95% O2/5% CO2 (pH 7.4, 37 °C) and contained (in mM): NaCl (116), KCl (4.7), magnesium sulfate heptahydrate, KH2PO4 (1.2), NaHCO3 (25), CaCl2 (1.4) and enriched with metabolites (glucose (11), intralipid 0.4 mM, 1 sodium L-lactate; 0.1 sodium pyruvate; 0.5 L-glutamic acid monosodium salt monohydrate; 5 mU l−1 insulin (NovoRapid insulin, Novo Nordisk, Denmark)) and paced at 550 b.p.m. The impact of 1μM AZD4 on heart function and metabolism was assessed in unpaced hearts perfused using hyperglycaemic (11 mM) crystalloid KH buffer. At the end of each experiment, hearts, liver, adipose tissue and muscle (gastrocnemius and soleus) were immediately freeze-clamped using Wollenberger tongs for metabolic profiling.
Myocardial infarct size was quantified using triphenyltetrazolium chloride (TTC) staining68. In brief, after 20 min of equilibration, Langendorff perfused hearts were subject to 20 min of global normothermic ischemia (37 °C) and 2 h of reperfusion (37 °C). At the end of the protocol, hearts were perfused for 10 min with 3% TTC in KH Buffer followed by 10 min incubation in 3% TTC-KH. Tissue was sectioned (mouse heart gauge, Zivic instruments, USA) and infarct field was quantified using ImageJ Software (National Institute of Health).
Metabolomic profiling
Snap frozen and pulverized tissue (heart, liver, skeletal muscle(gastrocnemius+soleus), adipose tissue) was analyzed as previously described52,69. Non-targeted lipid profiling of the cardiac tissue was done using LC–MS/MS at the School of Chemical and Physical Sciences Mass Spectrometry Laboratory Services. Lipids were extracted from weighed heart tissue using a modified Folch protocol. Samples were homogenized in chloroform–methanol and washed with 0.9% NaCl to induce phase separation, and the organic layer was collected, dried under nitrogen and reconstituted in methanol for HPLC–MS analysis. Total lipids were separated using an ACQUITY UPLC system (Waters Corporation) equipped with a UPLC CSH C18 column (2.1 × 100 mm, 1.7 μm (Waters Corporation), maintained at 55 °C). The mobile phases consisted of (a) acetonitrile:water (60:40, vol/vol) containing 10 mM ammonium formate and 0.1% formic acid, and (B) isopropanol:acetonitrile (90:10, vol/vol) containing 10 mM ammonium formate and 0.1% formic acid. Lipid species were separated using a step gradient to 70% solvent B over 12 min at a flow rate of 0.45 ml min−1.
MS detection was performed on a Synapt G2-Si high-resolution mass spectrometer (Waters Corporation) operated in positive electrospray ionization (ESI) mode. Mass spectra were acquired over an m/z range of 50–1200. Nitrogen was used as both the cone and desolvation gas, with flow rates of 25 L h−1 and 900 L h−1, respectively. The source and desolvation temperatures were maintained at 125 °C and 350 °C. Leucine enkephalin (Leu-Enk) was continuously infused and used as a lock mass for real-time mass calibration. Data acquisition and instrument control were performed using MassLynx software (Waters Corporation). Cardiotonic lipids were analyzed in a non-targeted acquisition mode. Following mass spectrometry data collection, samples were processed using UNIFI software (Waters Corporation). The observed mass intensities of each identified lipid were matched against a curated cardiolipid library comprising approximately 270 lipid species. Lipid signal intensities were normalized to the weight of the corresponding heart tissue samples. Annotation of lipid species to lipid classes and categories was conducted using Lipidmaps70. MS intensities were then used to weight the molecular fatty acyl (FA) contributions and calculate class wise and total FA profiles. The carbon chain length distribution of phospholipid species was expressed as a percentage of the total signal within each class (carbon length (%)). For each phosphatidylcholine (PC) species, the total number of carbons across both fatty acyl chains was calculated, and the proportion of all PC species containing the total carbon number was determined. Similarly, the degree of unsaturation was assessed by calculating the total number of double bonds in the fatty acyl chains of each PC species and expressing the proportion of species carrying that total number of unsaturations as a percentage of all PC species (carbon bonds (%)).
Lipoprotein lipase assay
Lipoprotein lipase (LPL) activity was measured in cardiac tissue samples (control, db/db n = 10 per group, AZD n = 9) using a fluorometric assay (Cell Biolabs, STA-610, Lot:8724005). In brief, cardiac tissue samples were homogenized in 20 mM Tris (pH 7.5), 150 mM NaCl before centrifugation at 10,000g for 10 min at 4 °C. The supernatant was diluted 1:50 in LPL assay buffer and run alongside an LPL enzyme standard curve. Fluorescence intensities were measured at 485 excitation and 520 emission.
In silico analysis of cardiac metabolism
In silico simulations were performed using the metabolic network of the cardiomyocyte, CardioNet67. Mathematical modeling has previously been used to study the dynamics of cardiac metabolism in response to stress, and CardioNet has been successfully applied to identify limiting metabolic processes and estimate flux distributions10,67,71. Optimization problems were defined with the objective to minimize the total sum of fluxes through the CardioNet metabolic network72. Simulations for control, db/db or AZD1656 groups were based on the assumption that cardiomyocytes seek to maintain a certain ATP provision to sustain cardiac contractile function alongside the synthesis of macromolecules, including structural proteins and phospholipids for membranes72. We included the intracellular metabolite concentrations of 23 metabolites. Furthermore, we constrained extracellular metabolites that could be taken up from the blood, including glucose, lactate, cholesterol and free fatty acids. Linear programming was solved using the GUROBI solver (version 9.1.2 build v9.1.2rc0, Linux64)73. Details of all reactions and their metabolic subsystems used for CardioNet analysis were as classified in the Kyoto Encyclopedia of Genes and Genomes database74.
Tissue extraction and digestion for fluorescence-activated cell sorting
To generate leukocyte single cell suspensions for characterisation of immune cell populations, hearts were isolated from mice and digested. Mice were euthanised using an overdose of anaesthesia with 5 % isoflurane in 2 L min−1 O2. Cessation of pedal and corneal reflexes were checked, and death was confirmed by cervical dislocation.
Cardiac tissue suspensions were prepared by perfusing hearts with cold HBSS for 5 min before the atria was removed, followed by mincing of the ventricular tissue digested in collagenase I (Worthington Laboratories, C1639, 450 units ml−1), collagenase XI (Worthington Laboratories, C7657, 125 units ml−1), DNase 1 (Worthington Laboratories, D4527, 60 units ml−1) hyaluronidase (Sigma Aldrich, H3506, 60 unitsml−1) and 20 mM Hepes in PBS for 20 min at 37 ˚C with gentle agitation (Thermomixer, 750 r.p.m.). Spleens were mechanically dissociated by mashing through a cell strainer using the plunger end of a sterile syringe. Samples were passed through a 70-µm cell strainer, rinsed with cold 2% FBS/PBS and centrifuged at 400g for 10 min at 4˚C. The supernatant was removed, and pellets were resuspended in 5 ml red blood cell lysis buffer (BioLegend). Samples were then centrifuged for 8 min at 4˚C and 400g, the supernatant was removed and cells were resuspended and incubated with FC-block (BioLegend 101320, 1 µl per 1 × 10⁶ cells). Cells were then washed again and resuspended in PBS ready for counting and antibody staining.
Flow cytometry
Cells isolated from tissues were resuspended (~1 × 10⁷ cells per ml) and incubated for 30 min at room temperature with fluorochrome-conjugated antibodies (Supplementary Table 1) in 100 μl of flow cytometry buffer made of PBS containing 0.1% sodium azide (SigmaAldrich) and 1% FBS. For intracellular marker staining, cells were fixed and permeabilized for 30 min at 4 °C using a fixation–permeabilization kit (eBioscience), washed in 1× permeabilization buffer (eBioscience) and stained with fluorochrome-conjugated antibodies. A final wash with 1× permeabilization buffer was performed, centrifuged and resuspended in 200 μl of flow cytometry buffer. Cell viability was assessed using incubation with viability dyes (Supplementary Table 1). Samples were analyzed on FACSAriaIII (BD Biosciences) running FACSDiVa v.8.0 software (BD Biosciences). CD3 beads (Miltenyi) were routinely used to calibrate the cytometer. Single stain and fluorescence minus one control were acquired for compensation and precise gating (Extended Data Fig. 1, gating strategies). Compensation was automatically calculated, and samples were analyzed using FlowJo software (version 10, FlowJo).
Histology
Hearts were collected into buffered formalin (Sigma Aldrich). All histological processing was carried out by the Bart’s Cancer Institute Histology Core Facility (Masson’s trichrome staining). Stained cardiac sections were scanned using a Nanozoom panoramic scanner (40×). Images (whole heart sections) were analyzed using ImageJ (National Institute of Health).
Electron microscopy
Left ventricle tissue samples were collected from db/db, AZD1656-treated db/db and lean control mice (n = 3 per group) and placed into phosphate-buffered glutaraldehyde (4%) for fixing71. Samples were embedded in Araldite resin (Agar Scientific) and ultrathin sectioned (Reichert-Jung Ultracut E Ultramicrotome, Leica) for TEM analysis in JEM1400F (JEOL) at 120 kV by Transmission Electron Microscope Facility, School of Biological and Behavioural Sciences. Image analysis was completed using Fiji Image J software, and mitochondrial cristae surface density was calculated on the basis of previously described methods75,76.
Plasma analysis
Blood samples were collected at the time of experimental endpoint into heparinized tubes. Plasma biochemical profiling was carried out by the MRC Mouse Biochemistry Laboratory (Addenbrookes NHS Hospital, Cambridge). Circulating plasma cytokines were assessed using the XXL mouse cytokine array kit (Biotechne).
RNA sequencing and bioinformatic analysis
RNA extracted from the snap-frozen hearts was analyzed by massive analysis of cDNA End (MACE-Seq). Rapid MACE-seq was used to prepare 3′ RNA sequencing libraries. Samples of 100 ng of DNA-depleted RNA were used for library preparation, using the Rapid MACE-Seq kit (GenXPro, Germany). Fragmented RNA underwent reverse transcription using barcoded oligo(dT) primers containing TrueQuant unique molecular identifiers, followed by template switching. PCR-amplified libraries were purified by solid-phase reversible immobilization beads, and subsequent sequencing was performed using the Illumina platform NextSeq 500. Unprocessed sequencing reads were adapter-trimmed and quality-trimmed using Cutadapt (version 3.4 (ref. 77)). Deduplication based on unique molecular identifiers (UMIs) was performed using in-house tools. FastQC (0.11.9 (ref. 78)), was used to assess the quality of sequencing reads. MultiQC (version 1.16 (ref. 79)), was used to create a single report visualizing output from multiple tools across many samples, enabling global trends and biases to be quickly identified. MACE-Seq was annotated, reads were quantified and P values for differential expression were generated by GenXPro.
Visual representations of the DEG dataset were performed using the Python programming language (version 3. 9.7) as well as libraries and packages, including Matplotlib (version 3.4.3) for data visualization, Pandas (version 1.3.4) for data management, NumPy (version 1.20.3) for numerical computations and Jupyter Notebook (version 6.4.5) for interactive code development. The functional enrichment analysis was performed using the g:Profiler (version e108_eg55_p17_0254fbf) with g:SCS multiple testing correction method applying a significance threshold of 0.05 (ref. 80). To determine enriched pathways and ontologies in all analysis comparisons, both Ingenuity Pathway Analysis (IPA; Ingenuity) and Metascape comparison analysis (https://metascape.org)81 was performed on all genes. Comparisons were db/db_vs control (2,740 DE genes) and AZ_vs_db/db (1,271 DE genes). Both metascape and IPA utilize hypergeometric tests and Benjamini–Hochberg P value correction to identify all ontology and pathway terms that contain a greater number of genes in common with an input list than expected by chance81.
Data analysis and statistics
Data are presented as mean ± s.e.m. Comparisons between groups were performed by Student’s t-test (Gaussian data distribution), two-way ANOVA with Bonferroni’s correction for multiple comparison and one-way ANOVA using Bonferroni’s correction for multiple comparisons when applicable. The normality of the data distribution was examined using Shapiro–Wilk’s normality test. Statistical analysis was performed using GraphPad Prism (v10.3.1) software. Data analysis and visualization was conducted using R Studio (version 2022.12.0 Build 353). Partial least-squares discriminant analysis (PLS-DA) was conducted using the R package mdatools. PCA was conducted with normalized intensities lipidomics data using the PCA function included in the factoextra package.
Flux estimations (CardioNet) were compared between experimental groups using Wilcoxon rank-sum test, and adjusted P values were computed using the Bonferroni correction. Differences were considered significant when P < 0.05.
To assess the E/A ratio across groups, we employed a quantization approach due to the observed nonlinear (U-shaped) association between low and high E/A values with adverse outcomes, which is inconsistent with a linear relationship. Specifically, both low and high E/A values are known to be indicative of diastolic dysfunction82, which suggests a threshold effect (in which highly elevated E/A in the presence of disease is sometimes termed ‘pseudonormal’)83.
We therefore discretised the observed E/A data into distinct categories, designating values more than three sample s.d. above or below the mean of the lean control group as ‘abnormal’ (A); those within the range of ±3 sample s.d. were classified as ‘normal’ (N). This classification was chosen to reflect the non-linear nature of the response; extreme values on either end of the spectrum were associated with pathological conditions and is arguably more appropriate than a simple shift in means (as could be quantified for example through linear modeling and ANOVA-type approaches), which would not adequately capture the complexities of the relationship. We then used Fisher’s exact test for the resulting contingency table, which is particularly suited for categorical data comparisons in cases with small or unbalanced groups, implemented in the RVAideMemoir R package84,85. Multiplicity correction was performed by the FDR correction method of Benjamini–Hochberg86, with corrected P < 0.05 considered significant.
Reporting summary
Further information on research design is available in the Nature Portfolio Reporting Summary linked to this article.