
Lnc13 is a candidate regulator of oral gluten tolerance
Gliadin peptides from ingested gluten are presented by antigen-presenting cells on HLA-DQ2 or HLA-DQ8, leading to activation of gliadin-specific T cells6. If left unchecked, these hyperactivated T cells initiate a cascade of inflammatory responses that culminate in tissue pathology4. We reasoned that regulation of T cells is a critical component of oral gluten tolerance and therefore we hypothesized that lncRNA candidates would (1) respond to mucosal T cell activation and (2) contain CeD-associated GWAS SNPs.
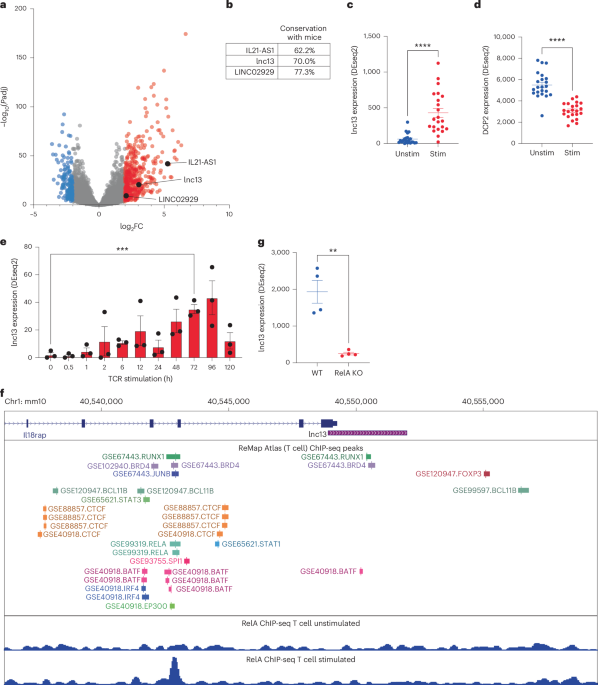
To identify such lncRNAs, we profiled RNA expression in gliadin-specific T cells from human CeD small intestines stimulated via the TCR. This analysis revealed 449 lncRNAs that were significantly upregulated and 168 that were downregulated. Notably, only three of these differentially expressed lncRNAs overlapped with CeD GWAS SNPs: IL21-AS1, LINC02929 and lnc13, all of which were upregulated following stimulation (Fig. 1a).

a, Volcano plot showing differentially expressed long-noncoding RNAs (lncRNAs) in gluten-specific CD4+ T cells from human small intestine activated by TCR for 3 h (data from GSE146441). n = 22 donors. lncRNAs upregulated (red) or downregulated (blue) are highlighted (abs|log2 fold change (FC)| > 2, adjusted P < 0.01). CeD-associated GWAS lncRNAs are shown in black. b, Cross-species sequence conservation (human-to-mouse alignment) of the three top candidate lncRNAs overlapping CeD-associated GWAS loci: IL21-AS1, LINC02929 and lnc13. c,d, Expression of lnc13 (C; P = 9.44537 × 10⁻⁷) (c) and its RNA-degrading enzyme DCP2 (D; P = 5.69524E-10) (d) in human gluten-specific CD4+ T cells at 0 and 3 h post-TCR stimulation (GSE146441). n = 22 donors. e, Time-course expression of human lnc13 in CD4+ T cells over 5 days of TCR activation (GSE96538), showing peak expression at days 3–4. n = 3 donors. P = 0.00078864. f, ChIP-seq analysis showing TF binding upstream of lnc13 in T cells. Middle: ReMap atlas of TF peaks; bottom: RELA ChIP-seq tracks in resting and 3-h-stimulated CD4+ T cells (GSE99319), indicating NF-κB recruitment. g, RNA expression of lnc13 in CD4+ T cells from WT and Rela-conditional knockout mice following 4 h of TCR stimulation (GSE239700), demonstrating NF-κB dependence. n = 4. P = 0.0017125. Differential expression (a,c–e,g) was computed using DESeq2 with adjusted P values that reflect Benjamini–Hochberg multiple comparisons correction. P < 0.05, **P < 0.01, ***P < 0.001, ****P < 0.0001. In scatter-plots (c–e,g), lines represent mean ± s.e.m.
Source data
Among these, LINC02929 (an uncharacterized transcript) exhibited the smallest fold change. IL-21-AS1, a promoter antisense lncRNA, has been studied in other autoimmune diseases, where it regulates IL-21 expression in cis13,19; however, IL21-AS1 showed the least evolutionary conservation between humans and mice (Fig. 1b), diminishing its suitability for in vivo modeling.
In contrast, lnc13 fulfilled all key criteria: it harbored a CeD-associated haplotype block, was robustly induced upon gliadin-specific T cell activation and exhibited high sequence conservation across species. We therefore prioritized lnc13 as the leading candidate for further investigation.
Lnc13 levels increased markedly following 3 h of gliadin-specific T cell stimulation, while its degrading enzyme DCP2 (ref. 16) decreased in parallel (Fig. 1c,d and Extended Data Fig. 1a). Human T cells showed delayed upregulation of lnc13, with peak expression (21.5-fold increase) occurring 3–4 days after TCR activation (Fig. 1e). This pattern of expression was largely inversely correlated with DCP2 and resembled the late-phase kinetics of FOXP3, a key regulator of immune restraint (Extended Data Fig. 1b,c). By contrast, proinflammatory transcripts such as TBX21 and IFNG exhibited earlier or mid-phase induction (Extended Data Fig. 1d,e). Both gluten-specific T cell and general peripheral T cell TCR stimulation upregulated lnc13 to similar magnitudes and kinetics (Extended Data Fig. 1f).
To understand how lnc13 is transcriptionally regulated, we examined transcription factor (TF) binding at its promoter using ChIP-seq datasets. We identified multiple inducible TF peaks, notably for RELA, a member of the NF-κB family, which binds near a potential lnc13 upstream regulatory element following T cell activation (Fig. 1f). Given that NF-κB activity is elevated in CeD and broadly pleiotropic, its downstream effectors such as lnc13 may represent more selective therapeutic targets20,21. Indeed, conditional deletion of Rela in activated T cells abolished lnc13 expression (Fig. 1f), confirming that lnc13 is an NF-κB-dependent gene induced during T cell activation. Overall, we identified lnc13 as a top regulator of oral gluten tolerance that is dynamically induced by NF-κB upon T cell activation.
lnc13 loss breaks gluten tolerance in HLA-DQ8 mice
The lnc13 transcript harbors the CeD-associated haplotype block marked by lead SNP rs917997 (ref. 16). The risk allele of rs917997 alters lnc13’s secondary structure and impairs its regulatory function in macrophages16. While lnc13 is highly conserved between humans and mice, the immediate sequences surrounding the SNPs of this haplotype block do not align perfectly between species, precluding precise allele modeling in mice. To mimic the systemic loss-of-function effect of the human SNP, we generated a full lnc13 knockout (KO) mouse (Extended Data Fig. 2a and see Supplementary Table 2 for Cas9 gRNA sequences).
Lnc13 is located near Il18rap but exists as an independent transcript, and its genomic locus lacks enhancer-associated chromatin features (Extended Data Fig. 2b–d). In bone-marrow-derived macrophages (BMDMs), lnc13 is downregulated upon LPS stimulation, and its deletion does not alter Il18rap expression under either resting or activated conditions (Supplementary Fig. 1a,b). These findings confirm that the KO is specific and does not disrupt neighboring gene expression. Notably, lnc13−/− BMDMs showed heightened expression of inflammatory genes such as Il6, Il1b and Nos2 following LPS stimulation (Supplementary Fig. 1c), suggesting that lnc13 restrains inflammation.
To test whether lnc13 regulates oral tolerance to gluten, we crossed the lnc13 KO onto HLA-DQ8 transgenic mice, which express the human DQ8 allele under its native promoter and lack endogenous murine MHC class II; thus every CD4+ T cell TCR in the mouse is educated against HLA-DQ8 (refs. 22,23) (Supplementary Fig. 2a,b). These mice were weaned on a gluten-free diet and switched at 10 weeks old to standard chow containing gluten (Fig. 2a). To normalize exposure, all mice were additionally gavaged with 20 mg of unmanipulated gliadin every other day for 45 days, similar to previously published protocols22,24.

a, Schematic of the gluten challenge protocol in HLA-DQ8 transgenic mice. Mice were weaned onto a gluten-free diet, then switched to standard chow and gavaged with 20 mg gliadin every other day for 45 days. b,c, Relative RNA expression of type 1 cytokines Ifng (b; P = 0.00351387) and Il12b (c; P = 0.00207621) in terminal ileum tissue from gluten-free or gluten-challenged mice, measured by RT–qPCR. Relative RNA levels are calculated in reference to Rpl32 housekeeping gene. n = 3–6 mice, across four independent experiments. d, lnc13 expression in terminal ileum from gluten-free versus gluten-challenged DQ8 mice, showing decreased expression upon gluten exposure. Relative RNA levels are calculated in reference to Rpl32 housekeeping gene. n = 3–6, across four independent experiments. P = 0.00023608. e–g, Representative flow cytometry plots (left) and quantification (right) showing frequencies of IFN-γ+ cells from live CD45+TCRb+B220− cells, where quantifications show those further gated on CD8+CD4− (P = 0.00013518) or CD4+CD8− (P = 0.00047811) (e), frequencies of IL-12+CD11b+ cells from live CD45+TCRb−B220− cells (P = 0.00031403) (f) and frequencies of FOXP3+ cells (P = 0.03630467) from live CD45+TCRb+B220−CD4+CD8− cells (g) in the small intestinal lamina propria (Lp) of gluten-challenged lnc13−/−-DQ8 and WT-DQ8 mice. n = 6 mice, across four independent experiments. h, Pathway enrichment analysis of DEGs in whole ileum (‘tissue’) and Lp lymphocytes (LPLs) from lnc13−/−-DQ8 versus WT-DQ8 mice after gluten challenge, and duodenal biopsies from patients with CeD versus healthy controls (GSE134900). Shared pathways include immune response and cytokine-mediated signaling. i, Expression of selected proinflammatory and B cell-associated genes in the ileum of lnc13−/−-DQ8 versus WT-DQ8 mice by RT–qPCR. Relative RNA levels (ΔΔCt) are calculated in reference to Rpl32 and then normalized to the average of WT-DQ8 samples. n = 6 across three independent experiments. P values for Il1a, Il21, Csf2, Il2, Tnfa, Il27, Il13, Il1b, Il17a, Hprt, Il7, Cd138 and Blimp1 are 0.006489, 0.004429, 0.001036, 0.000873, 0.030904, 0.023022, 0.0517, 0.0078, 0.035474, 0.299992923, 0.61115255, 0.20111989 and 0.02767208, respectively. An unpaired, two-tailed, Student’s t-test was used for comparison (b–g,i). *P < 0.05,**P < 0.01, ***P < 0.001, NS, not significant. In scatter-plots (b,c,e–g,i), samples from lnc13−/−-DQ8 (KO-DQ8) mice are represented by red dots and those from lnc13+/+-DQ8 (WT-DQ8) mice are represented by blue dots. Lines represent mean ± s.e.m. Image of mouse in a generated by BioRender; Yang-Fischer, R. https://biorender.com/hz505m6 (2026).
Source data
The mucosa of patients with CeD is associated with a type 1 immune profile, characterized by IFN-γ and IL-12 (ref. 4). Remarkably, in the small intestines of lnc13−/−-DQ8 mice, gluten challenge led to increased expression of Ifng and Il12b (Fig. 2b,c). Notably, lnc13 levels were decreased in gluten-challenged wild-type (WT)-DQ8 mice compared to gluten-free controls (Fig. 2d), mirroring findings in biopsies from patients with CeD16. Because CeD arises from coordinated interactions among CD4+ helper T (TH) cells, cytotoxic CD8+ IELs, B cells and myeloid cells4, we next examined whether lnc13 deficiency affected each of these key immune populations involved in gluten-driven inflammation.
Flow cytometric analysis revealed that gluten-challenged lnc13−/−-DQ8 mice exhibited increased frequencies of IFN-γ+CD4+ and CD8+ T cells in the small intestinal lamina propria compared to WT-DQ8 controls (Fig. 2e and Supplementary Fig. 3a), consistent with a TH1-skewed inflammatory response. We also observed an increase in IL-12-producing CD11b+ myeloid cells (Fig. 2f and Supplementary Fig. 3b), in agreement with independent human studies that have reported enrichment of IL-12 signaling pathways in lamina propria dendritic cells and macrophages from patients with active celiac disease, as well as elevated circulating IL-12 levels25,26. Indeed, human patients with CeD express increased levels of IL12Aand IL12B transcripts (Supplementary Fig. 3c). Further profiling identified increased IL-12 production within dendritic cells, a population previously implicated in breaking gluten tolerance27 (Supplementary Fig. 3a,d). Together with established evidence that IL-12 is predominantly produced by myeloid cells, these findings support the biological relevance of increased IL-12 production observed in our model.
In contrast to observations in human CeD, where increased numbers of FOXP3+ regulatory T (Treg) cells have been reported in the lamina propria28, we observed a reduction in FOXP3+ Treg cells in the lamina propria of gluten-challenged lnc13−/−-DQ8 mice (Fig. 2g). This difference likely reflects distinctions between reductionist mouse models of oral tolerance and the complex, polygenic nature of human disease, where Treg cell expansion may represent a compensatory but functionally impaired response28,29. Notably, multiple mouse models of loss of oral tolerance have similarly reported diminished or failed Treg cell expansion as a hallmark of disease induction, underscoring the relevance of this phenotype in experimental settings27,30,31,32. Together, these findings indicate that lnc13 is essential for maintaining immune homeostasis in response to dietary gluten.
To assess global molecular changes, we performed RNA sequencing (RNA-seq) on whole ileal tissue and lamina propria lymphocytes (LPLs) from gluten-challenged WT and lnc13−/−-DQ8 mice. Pathway analysis revealed substantial overlap between differentially expressed genes (DEGs) in lnc13-deficient mice and those in human CeD biopsies (Fig. 2h). We also observed increased expression of proinflammatory cytokines implicated in CeD, such as Il1a, Il1b, Il21, Csf2, Il2, Il27, Il13 and Tnfa (Fig. 2i). Cross-species DEG correlation confirmed strong similarity between the lnc13−/−-DQ8 mouse and human CeD transcriptomes, especially for inflammatory genes like Cxcl5, Saa2 and Oas2 (Extended Data Fig. 3a).
In the LPL compartment, loss of lnc13 was associated with upregulation of B cell activation and antibody secretion pathways (Fig. 2h). Consistent with this, we observed an elevated expression of Blimp1 and Sdc1 (CD138), markers of plasma cells (Fig. 2i). Immunoglobulin (Ig) locus genes were similarly upregulated in both lnc13-deficient mice and patients with CeD (Extended Data Fig. 3b). Serologically, lnc13−/−-DQ8 mice produced higher levels of anti-gliadin, anti-deamidated gliadin and anti-tTG (Extended Data Fig. 3c), hallmarks of humoral autoimmunity in CeD.
Altogether, these data demonstrate that lnc13 is critical for maintaining gluten tolerance and preventing the inflammatory responses that characterize CeD.
Lnc13 restrains cytotoxic intraepithelial lymphocytes
In CeD, the breakdown of oral tolerance leads to epithelial inflammation, driven in part by cytotoxic IELs4. To evaluate whether loss of lnc13 promotes this pathology, we analyzed IELs isolated from the small intestines of gluten-challenged WT-DQ8 and lnc13−/−-DQ8 mice.
RNA-seq of bulk IELs revealed several immune-related pathways uniquely altered in this compartment, including those related to defense response to bacteria and interspecies interaction, none of which was prominent in lamina propria datasets (Figs. 2h and 3a). These changes suggested a distinct, lnc13-dependent inflammatory environment within the epithelium.

a, Pathway enrichment analysis of DEGs from whole small intestinal tissue (‘tissue’) and IEL fraction of lnc13−/−-DQ8 versus WT-DQ8 mice after gluten challenge and duodenal biopsies from patients with CeD versus healthy controls (GSE134900). Enriched pathways in IELs include antibacterial defense, interspecies interaction and immune response. Scale bar shows −log10(FDR) of enriched pathways in each dataset. b, Representative flow cytometry plots (left) and quantification (right) showing increased frequencies of CD8α+CD45+ cells of total live cells in the IEL compartment of lnc13−/− versus WT mice. n = 4, P = 0.00121286. c–i, Elevated cytotoxicity markers shown in various IEL populations: GZMB expression (c; P = 3.50839 × 10⁻⁶ for %, P = 0.00027095 for MFI) and CD107a (LAMP-1)+ CD107b (LAMP-2)+ double-positive (d, P = 0.00021012) cells of live CD45+B220− TCRgd−TCRβ+CD8α+CD8β+ IELs; GZMB expression of live CD45+B220−TCRgd−TCRβ−NKG2D+ intraepithelial (IE) NK cells (e, P = 0.00477969 for %, P = 0.00477969 for MFI); CD107a+CD107b+ double-positive cells of live CD45+B220−TCRgd−TCRβ+CD8α+CD8β− IELs (f, P = 0.00161301); T-bet expression of live CD45+B220−TCRgd−TCRβ−NK1.1+NKG2D+ intraepithelial NK cells (g, P = 0.00308031 for %, P = 0.00205277 for MFI); and NKG2D+ cells of live CD45+B220−TCRgd−TCRβ+CD8α+CD8β+ IELs (h, P = 0.00181557). i, % GZMB+NKG2D+ double-positive CD8ab+ T cells (P = 0.02508331). For c,e,g, representative histogram plots are shown on the left with dashed lines denote isotype controls, red histogram represent cells from lnc13−/−-DQ8 mice and blue histogram represent cells from WT-DQ8 mice. The middle section of these panels show quantification of cells expressing these markers, with gating based on isotype controls. On the right section of these panels, quantification of MFI is shown. For d,f,h, representative pseudocolor plots are shown on the left, while quantifications of marker-positive cells are shown on the right. Across scatter-plots in c–i, samples from lnc13−/−-DQ8 (KO-DQ8) mice are represented by red dots and those from lnc13+/+-DQ8 (WT-DQ8) mice are represented by blue dots. n = 6 biological replicates, across four experiments. j, Volcano plot of DEGs from sorted CD8αβ+TCRαβ+ IELs post-gluten challenge. Top upregulated genes include T cell activation markers (Phlda1 and Atf3), homing receptors (S1pr1, S1pr3 and Ccr7), co-activation receptors (Tnfrsf4/OX40, Tnfsf11/RANKL, Tnfrsf9/4-1BB and Il1r2) and NK-like genes (Klra7, Klrb1b and Klri1). Differential expression was computed using DESeq2 to derive P values. k, Pathway enrichment of CD8αβ+ T IEL DEGs from lnc13−/−-DQ8 versus WT-DQ8 mice after gluten challenge (n = 3 mice), alongside pseudobulk DEG profiles from human patient with CeD CD8+ T cells versus controls, and human ‘natural effector’ (NE) CD8+ T cells versus all other CD8+ subsets (GSE252762). Shared pathways include T cell activation, proliferation and lymphomagenesis. Unpaired, two-tailed, Student’s t-test was used for comparison (b–i). *P < 0.05,**P < 0.01, ***P < 0.001, ****P < 0.0001; lines represent mean ± s.e.m.
Source data
Consistent with a CeD-like phenotype, CD8+ T cells were markedly increased in the epithelium of lnc13-deficient mice (Fig. 3b), along with an expansion of CD8αβ+TCRαβ+ IELs expressing GZMB and CD107a/b (LAMP-1/2), markers of cytotoxic granule release (Fig. 3c,d and Supplementary Fig. 4). These CD8αβ+ cytotoxic IELs are strongly implicated in CeD tissue damage4. We also detected elevated inflammatory marker expression in other IEL subsets, including: CD107a/b in CD8αα+ T cells (Fig. 3f) and T-bet and GZMB in NK cells (Fig. 3e–g).
CD8+ IELs in CeD often acquire an NK-like lymphokine-activated killer (LAK) phenotype, characterized by expression of NKG2D33. In lnc13−/−-DQ8 mice, we observed increased frequencies of NKG2D+CD8αβ+ IELs and of dual NKG2D+GZMB+ cytotoxic IELs (Fig. 3h,i), mirroring pathogenic IEL profiles seen in patients with CeD.
To investigate transcriptional signatures underpinning these phenotypes, we performed RNA-seq on sorted CD8αβ+ IELs from gluten-challenged WT and lnc13-deficient DQ8 mice (Fig. 3j and Supplementary Table 3). Genes most differentially upregulated in lnc13−/− CD8+ IELs included activation markers (Phlda1 and Atf3), T cell trafficking receptors (S1pr1, S1pr3 and Ccr7), critical T cell co-activation receptors (Tnfsf11/RANKL, Tnfrsf4/OX40, Tnfrsf9/4-1BB and Il1r2), cell-cycle regulator (Cdkn3) and NK-associated genes (Klra7, Klri1 and Klrb1b). Pathway analysis indicated enhanced signatures of T cell proliferation, activation and lymphomagenesis (Fig. 3j), the latter of which aligns with the known risk of enteropathy-associated T cell lymphoma in CeD34.
To assess translational relevance, we compared our murine transcriptomes to published single-cell RNA-seq of human small intestinal CD8+ T cells28. Gene expression changes in lnc13−/− CD8αβ+ IELs closely mirrored those found in natural effector CD8+ T cells from patients with active CeD, which are absent in healthy controls or gluten-free treated patients (Fig. 3k). Together, these data demonstrate that lnc13 restrains the differentiation and activation of cytotoxic and inflammatory IELs, and that its loss drives the emergence of a CeD-like intraepithelial immune landscape28,33.
We next performed a systematic characterization of immune cell populations and cytokine profiles. In peripheral blood, cytokine analysis revealed elevated TNF and IFN-γ, whereas CRP and IL-6 remained unchanged, consistent with a type 1-skewed but nonsystemically inflamed state (Extended Data Fig. 4a–d). This distinction is expected, as lnc13 represents only one CeD-associated locus, whereas human CeD reflects the combined effects of many genetic and environmental risk factors3. Peripheral immune alterations were modest and largely not biologically meaningful, with minimal changes in circulating IFN-γ+ T cells and preserved T cell development (Extended Data Fig. 4e–u). Thus, lnc13 deficiency does not drive systemic autoimmunity but instead results in mucosa-restricted inflammation, mirroring human CeD.
Overall we identify that lnc13 is necessary to restrain expansion of cytotoxic and inflammatory intraepithelial lymphocytes.
Loss of lnc13 leads to CeD-like pathology in mice
Although HLA-DQ8 transgenic mice mount an immune response to gluten, they typically do not develop overt small intestinal pathology in response to dietary gluten alone23,27. Given the pronounced immune activation observed in lnc13−/−-DQ8 mice, we hypothesized that lnc13 deficiency might provide an additional inflammatory stimulus to trigger celiac-like histological changes.
This hypothesis is supported by a previous study showing that transgenic overexpression of IL-15 in DQ8 mice can sensitize the intestinal mucosa to gluten-induced injury, leading to recapitulation of CeD pathology22. Of note, while CeD in humans primarily affects the proximal small intestine, gluten is thought to accumulate in the distal small intestine of mice, such as the terminal ileum, due to differences in gastrointestinal physiology and gluten metabolism24,35.
We therefore first examined the terminal ileum. After 45 days of gluten exposure, lnc13−/−-DQ8 mice exhibited significantly lower villus-to-crypt ratios compared to WT-DQ8 controls (Fig. 4a–c). Of note, we observed crypt hyperplasia, a hallmark of early CeD pathology that reflects ongoing mucosal inflammation and epithelial remodeling (Fig. 4d). Consistent with CeD-like IEL infiltration, crypt hyperplasia was accompanied by a significant increase in IEL numbers, which inversely correlated with the villus-to-crypt ratio (Fig. 4e,f). The increased IEL numbers agrees with our earlier flow cytometry result showing increased frequency of CD8+ IELs in mice lacking lnc13 (Fig. 3b).

a, Representative H&E-stained histological sections of terminal ileum from gluten-challenged WT-DQ8 and lnc13−/−-DQ8 mice. Crypt thickness indicated by black brackets. Black scale bar, 200 μm. b,c, Quantification of: villus-to-crypt (V/C) ratios (n = 10–12 mice, across five independent experiments; P = 0.00073755) (b) and villous atrophy (VA) scores in terminal ileum gut bundles (n = 5–9 mice; P = 0.02808226) (c). VA scoring: 0, no atrophy; 1, mild; 2, clear atrophy. Blinded scoring performed by a pathologist. Only samples from (A) that had sufficient coverage for a confident call by the pathologist were scored. d, Measurement of crypt depth in terminal ileum, showing crypt hyperplasia in lnc13−/−-DQ8 mice (n = 10–12 mice, across five independent experiments; P = 0.0054398). e, EL counts per 100 intestinal epithelial cells (IECs) in terminal ileum, increased in lnc13−/−-DQ8 mice (n = 10–12 mice, across five independent experiments). f, Correlation between V/C ratio and IEL density across individual mice. Pearson two-tailed correlation test showing inverse correlation of IEL counts per 100 IECs and V/C ratio. n = 22 mice. P = 6.54842 × 10⁻⁵. g,h, Swiss roll histological quantification in distal small intestines (ileum) (g; P = 0.00030838 for V/C ratio; P = 0.04160064 for crypt length) and proximal small intestines (jejunum) (h; P = 0.00023621 for V/C ratio; P = 0.0441443 for crypt length): left, V/C ratio; middle, villus height; right, crypt depth. Analysis confirms crypt hyperplasia extends into proximal small intestine in gluten-challenged lnc13−/−-DQ8 mice (n = 3–10 mice). i, Schematic of gluten withdrawal protocol to assess pathology reversibility. j, Quantification of V/C ratio in gluten-challenged mice switched to a gluten-free diet. Gluten-induced pathology in lnc13−/−-DQ8 mice is reversible (n = 6–8). Statistical comparisons: unpaired, two-tailed Student’s t-test. In scatter-plot, lines represent mean ± s.e.m., except c (median). *P < 0.05,**P < 0.01, ***P < 0.001, ****P < 0.0001. Image of mouse in i generated by BioRender; Yang-Fischer, R. https://biorender.com/hz505m6 (2026).
Source data
We next used Swiss roll sections of the entire small intestine, enabling unbiased histological analysis across the proximal-to-distal axis. Using this approach, we found that crypt hyperplasia extended into the proximal small intestine of lnc13−/−-DQ8 mice (Fig. 4g,h and Supplementary Fig. 5). This pathology was observed only in mice expressing HLA-DQ8, challenged with gluten, and lacking lnc13, supporting a model in which these three factors together are required to induce histological features of CeD.
In humans, crypt hyperplasia typically precedes villous atrophy, which emerges after prolonged inflammation36. Thus, the changes we observed in lnc13−/−-DQ8 mice after 45 days of gluten exposure likely represent early-stage CeD-like pathology. Finally, we tested whether these changes were reversible. Upon switching mice to a gluten-free diet, we observed resolution of histological abnormalities (Fig. 4i,j), meeting a critical standard for CeD mouse modeling24.
To determine directly whether the immune phenotypes observed in gluten-challenged lnc13−/−–DQ8 mice require gluten exposure, we performed a full immune characterization of WT-DQ8 and lnc13−/−–DQ8 mice maintained on a gluten-free diet with sham gavage for 45 days (Extended Data Fig. 5a). Across all compartments examined, we did not observe any differences between genotypes. In the lamina propria, Treg cell frequencies were unchanged (Extended Data Fig. 5b), and the percentages of IFN-γ+CD8+ and CD4+ T cells (Extended Data Fig. 5c) were comparable between WT-DQ8 and KO-DQ8 mice. Similarly, among IELs, we detected no differences in GZMB+CD8αβ+ T cells (percent or mean fluorescence intensity (MFI); Extended Data Fig. 5d), GZMB+ NK cells (Extended Data Fig. 5e), CD107a/b+CD8αβ+ IELs (Extended Data Fig. 5f), CD107a/b+CD8αα+ IELs (Extended Data Fig. 5g) or NKG2D+CD8+ IELs (Extended Data Fig. 5h). Peripheral lymph nodes likewise showed no differences in IFN-γ+CD8+ (Extended Data Fig. 5i) or IFN-γ+CD4+ T cells (Extended Data Fig. 5j), nor in FoxP3+ Treg cell frequencies (Extended Data Fig. 5k).
We also performed a full immune characterization in WT-DQ8 and lnc13−/−-DQ8 mice that was first challenged with gluten, and then reverted to a gluten-free diet for 45 days with sham treatments every other day (Extended Data Fig. 6a). Similarly, mice challenged with gluten and subsequently reverted to a gluten-free diet exhibited normalization across all immune compartments examined (Extended Data Fig. 6), including IEL activation markers, lamina propria effector T cells and peripheral T cell subsets.
Together, these results demonstrate that the immune abnormalities observed during gluten challenge (including heightened IEL activation, increased effector function and reduced Treg cell frequencies) fully normalize when gluten is removed. Thus, the immunopathology in lnc13−/−-DQ8 mice is gluten-dependent rather than an intrinsic or persistent consequence of lnc13 deficiency. These findings demonstrate that loss of lnc13 in the context of HLA-DQ8 and dietary gluten induces key features of CeD, including crypt hyperplasia, IEL infiltration and gluten dependence with reversibility on a gluten-free diet.
Lnc13 restrains CD8αβ+ IEL responsiveness to IL-15 signaling
Given the robust inflammation observed in both the lamina propria and epithelial compartments of lnc13−/−-DQ8 mice after gluten challenge, we hypothesized that lnc13 normally dampens immune cell responsiveness to inflammatory cytokines. Notably, lnc13 expression is one of the highest in CD8+ T cells (Fig. 5a and Extended Data Fig. 7a,b), prompting us to focus our mechanistic studies on this population.

a, Relative expression of lnc13 in murine CD4+ T cells, CD8+ T cells and B cells, measured by RT–qPCR. lnc13 is most highly expressed in CD8+ T cells (n = 4; P = 0.00700709 comparing CD4+ versus CD8+ T cells, P = 0.00795608 comparing CD8+ T cells and B cells). b, RT–qPCR quantification of lnc13 and Dcp2 expression in CD8α+ IELs cultured for 48 h with medium alone, soluble IL-15 (sIL-15) or IL-15 superagonist (IL-15SA; IL-15 pre-complexed with IL-15Rα). IL-15 stimulation leads to downregulation of lnc13 and upregulation of its degrading enzyme Dcp2. lnc13 and Dcp2 expression, by RT–qPCR, was first normalized to Rpl32. ΔΔCt was calculated relative to average of unstimulated samples (for lnc13) or IL-15SA stimulated samples (for Dcp2). n = 5 mice per experiment. For comparisons of lnc13 expression medium versus IL-15 and medium versus IL15ra, as well as Dcp2 medium versus IL-15 and medium versus Il15rap, P = 4.70678 × 10⁻⁶, 2.74899 × 10⁻⁶, 2.47 × 10⁻⁵ and 4.7847 × 10⁻⁷, respectively. c, Schematic model proposing that IL-15 signaling activates STAT5 to promote Dcp2 expression, leading to degradation of lnc13. d, Time-course of NKG2D expression in WT CD8a+ IELs cultured with or without IL-15SA. NKG2D induction becomes robust by day 5, marking NK-like differentiation. e, Purified CD8a+ T IELs were stimulated with IL-15SA for 5 days. CD8+ IELs from lnc13−/− mice exhibit enhanced cytotoxicity and NK marker expression. Representative flow plots (left) and quantification (right) showing: NKG2D+GZMB+ double-positive live cells. n = 4 mice across three independent experiments. P = 0.00028843. Samples from lnc13−/− mice are represented by red dots and those from lnc13+/+ mice are represented by blue dots. f, After 5 days of IL-15SA stimulation, representative histogram of GZMB and NKG2D of WT-DQ8 (blue) and lnc13−/−-DQ8 (red) is shown. Dashed line represents isotype control. Error bars represent mean ± s.e.m. Unpaired, two-tailed Student’s t-test was used for comparisons. **P < 0.01, ***P < 0.001, ****P < 0.0001.
Source data
To identify relevant cytokine cues, we stimulated murine immune cells with key CeD-associated cytokines: IL-15, TNF, IFN-γ and IL-6 (Extended Data Fig. 7c). While TNF had no effect on lnc13 expression, IFN-γ and IL-6 upregulated lnc13, consistent with STAT1 and STAT3 binding at a potential lnc13 upstream regulatory element in available ChIP-seq data (Extended Data Fig. 7c,d). By contrast, IL-15 stimulation led to a downregulation of lnc13 (Extended Data Fig. 7c).
IL-15 plays a central role in CeD, particularly in driving IEL cytotoxicity and tissue destruction33; however, the molecular intermediates linking IL-15 stimulation to pathogenic T cell differentiation remain incompletely defined. We confirmed that lnc13 does not directly regulate IL-15 expression (Extended Data Fig. 8a–c), suggesting that its function lies downstream of IL-15 signaling.
To model IL-15 signaling more accurately in vitro, we isolated small intestine CD8+ IELs from WT mice and stimulated them with either soluble IL-15 (sIL-15) or an IL-15 superagonist (IL-15SA), which mimics physiological presentation via complexing with IL-15Rα37 (Fig. 5c). Both forms of IL-15 stimulation resulted in downregulation of lnc13 and upregulation of Dcp2, its RNA-degrading nuclease (Fig. 5b). These changes occurred within 4 h (Extended Data Fig. 8d). We next noticed that, at the Dcp2 promoter, there exist substantial binding of STAT5, the canonical activated TF of IL-15 signaling38,39,40,41 (Extended Data Fig. 8e,f) and Dcp2 expression is dependent on STAT5 activity (Extended Data Fig. 8g). These results provide an explanation for the upregulated Dcp2 expression by IL-15 (Fig. 5c) and a mechanism for the decreased lnc13 levels upon IL-15 stimulation in CD8+ T cells.
To further investigate the expression dynamics of lnc13, we next stimulated naive CD4+ and naive CD8+ T cells with IL-15, TCR, IL-15 + TCR or IL-12. In contrast to IL-15, which significantly reduced lnc13 levels in CD8+ T cells, IL-12 stimulation had no detectable effect on lnc13 expression in either naive CD8+ or CD4+ T cells (Extended Data Fig. 8h,i). Moreover, lnc13 expression in CD4+ T cells was not responsive to IL-15 stimulation (Extended Data Fig. 8h). In both CD4+ T cells and CD8+ T cells, while TCR signaling increased lnc13 expression, lnc13 levels were induced much higher in CD4+ T cells than CD8+ T cells (Extended Data Fig. 8h,i). In CD4+ T cells, TCR + IL-15 also increased lnc13 expression to a similar level as TCR signaling alone. In CD8+ T cells, however, IL-15 + TCR resulted no change in lnc13 levels, indicating the suppression of lnc13 by IL-15 signaling and induction of lnc13 by TCR signaling canceled each other (Extended Data Fig. 8h,i). To understand this divergence, we examined Dcp2, the lnc13-degrading enzyme and found that while IL-15 induces Dcp2 expression in peripheral CD8+ T cells, IL-15 does not induce Dcp2 in CD4+ T cells (Extended Data Fig. 8j). This cell-type-specific Dcp2 regulation may reflect differences in chromatin accessibility and enhancer usage between CD4+ and CD8+ lineages. As controls, we observed that for canonical T cell activation cytokines Ifng and Il2, TCR and TCR + IL-15 strongly induced their expression (Extended Data Fig. 8k–n).
We next confirmed that human lnc13 is similarly degraded by IL-15 in CD8+ T cells (Extended Data Fig. 9a). We purified human CD8+ T cell subsets and found that effector memory and central memory CD8+ T cells expressed much higher levels of lnc13 than naive CD8+ T cells (Extended Data Fig. 9b). We next examined the expression of lnc13 upon stimulation in human naive, effector memory and central memory CD8+ T cells (Extended Data Fig. 9c–e). lnc13 in naive human CD8+ T cells responded similar as in mice, whereas IL-15 reduced lnc13 levels, TCR stimulation increased lnc13 levels and TCR + IL-15 had no effect on lnc13 levels (Extended Data Fig. 9c). In effector memory CD8+ T cells, whereas TCR stimulation had no effect, IL-15 stimulation and IL-15 + TCR stimulation reduced lnc13 levels (Extended Data Fig. 9d). In central memory CD8+ T cells, lnc13 levels remained largely unchanged across all conditions, with only a minimal increase under combined IL-15 + TCR (Extended Data Fig. 9e).
To assess functional consequences, we cultured WT CD8+ IELs with IL-15SA and monitored NKG2D expression over time. NKG2D, a cytotoxic NK receptor, was strongly induced by day 5 (Fig. 5d). When we repeated the experiment using lnc13−/− IELs, we observed a significantly higher proportion of cells expressing IFN-γ, NKG2D and GZMB, hallmarks of NK-like, IL-15-driven LAK cells and resembling phenotypes seen in vivo post-gluten challenge (Fig. 5e,f and Extended Data Fig. 9f). Notably, knockout of lnc13 did not alter the expression of Il18rap in CD8+ T cell at resting or upon stimulation validating that these effects are not artifacts due to disruption of the adjacent Il18rap gene (Extended Data Fig. 9g).
These results establish that lnc13 constrains the differentiation of CD8+ IELs into cytotoxic LAK cells by limiting responsiveness to IL-15. Loss of lnc13 lowers the threshold for IL-15-induced activation, potentially contributing to the inflammatory and cytotoxic phenotype observed in vivo.
Lnc13 associates with DNA regulatory elements in CD8+ T cells
To understand how lnc13 regulates IL-15 responsiveness, we performed transcriptomic analysis of CD8α+ IELs stimulated in vitro with IL-15SA for 48 h (Fig. 6a and Supplementary Table 4). Top upregulated genes in KO (for example, Tiam1, Maf, Cxxc5, Brca2, Bcl9, Bcl2l2, Fcho1, Bmf and Junb) are consistent with enhanced T cell activation, proliferation and epigenetic remodeling, in line with the heightened responsiveness observed to in vivo gluten challenge CD8+ T IELs and in CD8+ T IELs from patients with CeD (Figs. 3k and 6a). Pathway enrichment analysis revealed that, with IL-15SA, KO vs WT DEGs are enriched for response to stimulus, signal transduction, leukocyte activation, IL-2/IL-15 signaling, Notch signaling, NK activation and lymphoma/CeD signatures (Fig. 6b). These are consistent with the broad transcriptomic signatures from post-gluten challenge in vivo CD8+ IEL KO versus WT DEGs and celiac disease CD8+ T IEL DEGs (Fig. 3k). In contrast, the no-stimulation KO–WT comparison shows these terms as largely attenuated in significance (TCR, IFN-γ, response to stimulus, signal transduction and cell cycle) or nonsignificant (such as leukocyte activation, IL-2–IL-15 signaling, inflammatory response, CeD and lymphoma), indicating that the in vivo CD8+ T IEL transcriptomic changes are partly recapitulated by IL-15 stimulation ex vivo (Fig. 6b–d).

a, Volcano plot of DEGs from CD8α+ IELs isolated from WT or lnc13−/− mice and cultured with IL-15SA for 48 h. n = 3 biological replicates. Key upregulated genes in lnc13−/− cells include T cell activation (Tiam1 and Junb), immune activation (Maf, Cxxc5 and Ifngr2) and proliferation (Brca2, Mapk7, Bcl9, Bcl2l2 and Bmf). Differential expression was computed using DESeq2 to derive P values. b, Pathway enrichment analysis of DEGs from IL-15SA-stimulated CD8α+ IELs (‘+IL-15’) and control unstimulated CD8a+ IELs (unstim). n = 3 biological replicates. Enriched terms in ‘+IL-15’ but not in ‘unstim’ include signal transduction, leukocyte activation, T cell response in CeD, NK cell activation and IL-2/IL-15 signaling pathway. c, Heatmap showing expression of selected IL-15-responsive genes (for example, Junb, Pak1, Bcl2l1 and Cbl) and IL-15 signaling pathway components (for example, Il2rb, Jack3, Gab2 and Rela), which are also marked with yellow circles in RNA-seq of WT and lnc13−/− activated with IL-15. d, Pathway enrichment analysis of lnc13 KO-DQ8 vs WT-DQ8 DEGs from CD8ab+ T IELs isolated after gluten challenge (‘in vivo gluten’) and lnc13 KO versusWT DEGs from CD8a+ T cell stimulated for 48 h with IL-15SA (‘ex vivo + IL-15’) and control unstimulated CD8a+ T cells (‘ex vivo unstim’). ‘In vivo gluten’ DEGs show significant enrichment of IL-15–IL-2 signaling pathway along with those associated with RANKL, IL-12, IL-6, TNF, IL-4/IL-5 and IFN-γ, whereas those from ‘ex vivo + IL-15’ show only significant enrichment for IL-15–IL-2, Notch and MAPK. DEGs from ‘ex vivo unstim’ do not show significant enrichment of any of these pathways. Scale bar shows −log10(FDR) of the mentioned pathways. e, Heatmap of selected shared DEGs between CD8α+ IELs stimulated with IL-15SA in vitro (left) and CD8αβ+ IELs isolated in vivo after gluten challenge (right). Many IL-15-responsive genes upregulated in vitro are also elevated in vivo upon lnc13 loss. On the far right, genes are functionally classified into proliferation (green), immune activation (purple), metabolism (yellow) or circadian rhythm (blue). For c and e, the numbers after ‘rep:’ indicate paired littermate mice from the same cage. f, Enrichment of TF motifs associated with DEGs in lnc13-deficient IELs (IL-15SA condition). Multiple enriched TFs (outer circle) are known to interact with the NuRD chromatin remodeling complex (highlighted by connecting lines). g, Schematic of RAP–DNA sequencing approach to map endogenous lnc13 chromatin association in primary CD8+ T cells. h, RAP-DNA-seq track (n = 2, overlaid), WT RAP versus KO RAP (as negative control), showing strong enrichment of lnc13 at its own locus, confirming pulldown specificity. i–k, RAP-DNA-seq coverage tracks showing association of lnc13 with Maf (i) Cxxc5 (j) and Gab2 (k). Each track is normalized by both bin size and total read counts, akin to the RPKM normalization analysis in RNA-seq (h–k). Tracks from both replicates were overlaid together. l, Bar graph showing the percent overlap of lnc13 KO versus WT ‘ex vivo + IL-15’ DEGs with RAP peaks separated based on how close these peaks are to the gene body of the DEGs: ±5 kb, ±50 kb or ±500 kb. m, Model. In resting CD8+ T cells, lnc13 associates with NuRD to repress IL-15 pathway genes. Upon IL-15 stimulation, lnc13 is degraded, lifting repression and permitting NK-like LAK differentiation.
Source data
We also observed upregulation of signaling components associated with IL-15 signaling, such as Il2rb, Jak3, Gab2, Rela, Stat5a, Mapk8 and Pik3cg, as well as IL-15 response genes, such as Junb, Pak1, Arhgdia, Bcl2l1 and Cbl (Fig. 6c). Moreover, we observed that 32.6% of the in vivo lnc13−/−-DQ8 versus WT-DQ8 CD8+ T IELs after gluten challenge DEGs (Fig. 3j) correspond to IL-15-responsive genes in WT cells, and this proportion increases to 42.0% when using the KO IL-15 response set (Extended Data Fig. 10a and Supplementary Tables 5 and 6). Several of the DEGs in both the in vivo and ex vivo +IL-15SA datasets overlapped and interestingly, many of the upregulated genes are associated with proliferation and immune activation while downregulated genes are associated with metabolism and circadian rhythm (Fig. 6e). These data suggest that a significant proportion of the in vivo transcriptomic changes (KO-DQ8 versus WT-DQ8, post-gluten) are IL-15-responsive genes.
Notably, the in vivo DEGs also show enrichment for signaling pathways driven by multiple cytokines beyond IL-2/IL-15, including TNF, IL-12, IFN-γ, RANKL, IL-6 and IL-4/IL-5, whereas the ex vivo IL-15-stimulated DEGs are enriched primarily for IL-15/IL-2-associated pathways (along with Notch and MAPK, which act downstream of IL-15 signaling) (Fig. 6d). None of these signatures was detected in the unstimulated condition, indicating that the enhanced cytokine responses in lnc13-deficient cells remain specific to the activating signal (Fig. 6d). Together, these results suggest that ex vivo IL-15 stimulation captures the core IL-15-responsive program regulated by lnc13, whereas the full in vivo transcriptional phenotype reflects the systems-level integration of additional cytokine inputs within the intestinal microenvironment. These results suggest that lnc13 deficiency lowers the activation threshold of CD8+ T IELs, enabling synergistic responses to IL-15 and other inflammatory cytokines, which together drive the amplified effector and inflammatory signatures observed in vivo. Indeed, many of these cytokine pathways (for example, TNF, IL-12 and IFN-γ) are known to amplify or modulate specific aspects of IL-15 signaling, further supporting this integrated model42,43,44.
We next independently validated a selection of key lnc13 DEGs presented from both in vivo gluten and ex vivo IL-15-stimulated RNA-seq datasets (Fig. 3j and Fig. 6a) by RT–qPCR in human CD8+ T cells with lnc13 knockdown versus control siRNA knockdown that were unstimulated or stimulated with human IL-15 (Extended Data Fig. 10b,c). These results show consistent upregulation of these genes upon lnc13 knockdown when stimulated with IL-15, but the differences were largely abolished without IL-15 stimulation.
To determine how lnc13 controls expression of these targets, we performed TF motif analysis of lnc13-regulated genes. This revealed significant enrichment for TFs associated with the NuRD (nucleosome remodeling and deacetylase) complex, consistent with our previous work showing that lnc13 recruits NuRD to repress gene expression16 (Fig. 6f).
We next used RNA antisense purification (RAP) followed by DNA sequencing (RAP–DNA-seq) to map lnc13 chromatin binding sites in primary CD8+ T cells, where RAP in lnc13 KO CD8+ T cells served as negative controls for background sequencing noise (Fig. 6g). Lnc13 enrichment at its own locus confirmed the specificity of our pulldown (Fig. 6h). We then performed differential enrichment analysis, and significant peaks are shown in Integrated Genome Viewer (IGV) (Fig. 6i–k) for representative genes (Maf, Cxxc5 and Gab2). These genes are upregulated in lnc13 KO CD8+ IELs after IL-15 stimulation, illustrating a direct correspondence between binding and expression effects. Notably, binding patterns differed among targets: Maf and Gab2 exhibited sharp enrichment at promoter regions, whereas Cxxc5 displayed more diffuse binding across the gene body. Such broad binding patterns are consistent with previous reports demonstrating that, in certain contexts, lncRNAs can exert regional regulatory influence rather than binding at discrete, sharply defined sites45,46.
We next compared the genomic coordinates of RAP peaks with DEGs from the CD8a+ IELs stimulated with IL-15SA RNA-seq dataset. Considering the possibility of lnc13 to act via both promoter-proximal and distal enhancer interactions, we evaluated overlap using three proximity windows around each gene body: ±5 kb, ±50 kb and ±500 kb. We found that 14.1% of DEGs overlapped nearby (±5 kb) RAP peaks, 32.1% overlapped within ±50 kb and 83.6% overlapped within ±500 kb (Fig. 6l), representing 33% of total RAP peaks (Extended Data Fig. 10d). Thus, a substantial proportion of lnc13-regulated genes are physically associated with lnc13-bound loci, consistent with cis-regulatory targeting.
These data demonstrate that lnc13 binds specific DNA regulatory elements in CD8+ T cells and represses expression of IL-15-responsive genes, a function likely mediated via NuRD recruitment. Together, this provides a molecular mechanism for how lnc13 restrains cytotoxic effector differentiation and preserves oral tolerance to dietary antigens (Fig. 6m and Supplementary Fig. 6).