
IBD–UC increased colonic crypt TCRγδ+STAT5+ T cells
Using FACS analysis, we examined PBMCs from n = 24 UC, n = 21 Crohn’s disease and n = 10 healthy controls (Supplementary Table 1) and found significantly increased frequencies of CD3+TCRγδ+ T cells in PBMCs from UC but not patients with Crohn’s disease compared with control samples (Supplementary Fig. 1a,b and data not shown). Interestingly, CD3+CD4−CD8−TCRγδ+ T cells from these patients with UC show significant activation of pYSTAT5, as indicated by markedly increased frequencies of pYSTAT5+CD3+TCRγδ+ T cells (Supplementary Fig. 1c,d). Consistent with these data, HE and immunohistochemistry (IH) assays with healthy control colonic specimens revealed few intra-IEC lymphocytes, crypt CD3+ or TCRγδ+ T cells in the healthy crypt compartment, with a significantly elevated number of intra-IEC lymphocytes, CD3+ or TCRγδ+ T cells in the hyperproliferative, inflamed or cryptitis crypts of patients with UC (Supplementary Fig. 1e and Fig. 1a–c), a finding compatible with a positive role for crypt TCRγδ+ cells in ISC regeneration. Moreover, Immunofluorescence (IF) assays showed that part of these infiltrating crypt CD3+ T cells in patients with UC are TCRγδ+ cells that colocalize with STAT5 staining (Supplementary Fig. 1e and Fig. 1d–f). These data suggest that STAT5 may play a role in recruiting TCRγδ+ T cells into the ISC zone or into the crypt base. Importantly, we did not find a significant difference in the frequency of crypt CD3+ or TCRγδ+ T cells between patients with Crohn’s disease and controls (Supplementary Fig. 1e,f), suggesting that the population of crypt TCRγδ T cells may represent the protective response of patients to UC-induced crypt inflammation.

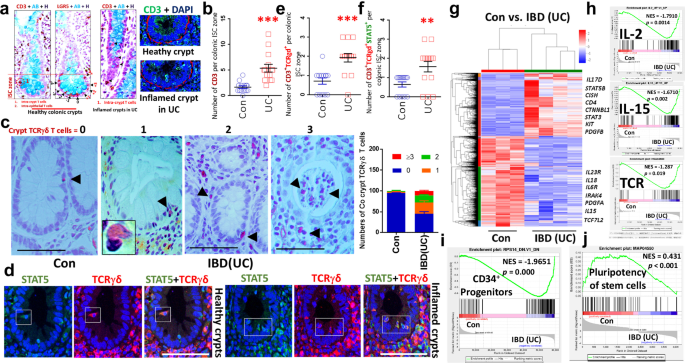
a Paraffin or OCT-embedded slides of crypts from n = 10 healthy controls (Con) and n = 24 patients with IBD–UC stained with anti-CD3 and anti-LGR5 IH antibodies or anti-CD3 IF antibodies. CD3+ T cells were observed in the ISC zone at the bases of colonic crypts in both Con and UC, as indicated by LGR5 staining. AB, Alcian blue; H, hematoxylin. The arrows indicate CD3+ T cells or LGR5+ ISC. CD3+ T cells (green) crypts are represented as open circles. b Crypt CD3+ T cells were counted in 50–100 well-oriented colonic crypts. Results are expressed as the mean ± s.e.m. ***P < 0.001 versus Con. The arrow indicates crypt TCRγδ T cells. c Colon (Co) sections from 10 Con and 24 patients with UC were immunostained with anti-TCRγδ antibodies. TCRγδ+ crypt T cells in either healthy or inflamed crypts were quantified as ‘0’, no TCRγδ+ T cells, ‘1’, one TCRγδ+ T cell, ‘2’, two TCRγδ+ T cells, and ‘≥3’, more than three TCRγδ+ T cells. The results are expressed as mean ± s.e.m. d Double IF staining with anti-TCRγδ (red) and anti-STAT5 (green) antibodies to show STAT5 expression in crypt TCRγδ cells in UC and Con; this image represents n = 10 Cons and n = 24 UC. e, f Crypt CD3+TCRγδ+ T cells (e) and TCRγδ+STAT5+ T cells (f) were counted in 50–100 well-orientated colonic crypts to determine the number of positive T cells per crypt ISC stem cell zone. Results are expressed as the mean ± s.e.m., **P < 0.01, ***P < 0.001 versus Con. Colonic tissues were collected from n = 3 Cons and n = 7 UCs with increased frequency of blood CD3+TCRγδ+ T cells and crypt TCRγδ+ cells. RNA was extracted and subjected to RNA-seq analysis. g A heat map shows that compared with Cons, 1644 genes are upregulated and 2,406 genes are downregulated in UC with a fold change >2.0 and P < 0.05. h–j GSEA analysis shows an elevation in the IL-2, IL-15 and TCR pathways (h) as well as the CD34+ progenitor pathway (i) and downregulation of the pluripotency of stem cells pathway in UC versus Con (j).
IBD–UC increases TCR, HLA and IL-17 gene signatures
We performed RNA-seq on colonic tissues from seven patients with UC with increased TCRγδ T cells in blood and crypt TCRγδ T cells (Fig. 1c and Supplementary Fig. 1b). We found these individuals show significantly increased CD4, IL17, STAT5B, CISH, KIT, CTNNB1 and STAT3 expression, coincident with reduced IL23R, IL6, IL18, IL15 and TCF7L2 versus controls (Fig. 1g). Gene set enrichment analysis (GSEA) further revealed that these patients with UC exhibit pronounced activation of IBD, JAK–STAT, IL-2, IL-15, IL-17, TH1, TH2, TH17, TCR, HLA-DR antigen processing and presentation, and CD34 progenitor pathways, coincident with suppressed pluripotency of stem cells (Fig. 1h–j and Supplementary Fig. 1g). These data suggest that an exaggerated JAK–STAT, TCR, IL-17 and HLA signaling pathway in UC affects ISC activity and progenitor regeneration, implicating increased interaction between TCRγδ T cells and ISCs in IBD–UC.
Depleting STAT5 tetramer resulted in IEC hyperplasia and increased crypt T cells
Stat5a–Stat5b DKI N-domain mutant mice form STAT5 dimers but not tetramers28 (Supplementary Fig. 2a). DKI mice have fewer intestinal CD8+ T cells and mucosal Treg cells (CD4+CD25+ or Foxp3+) than WT littermate controls, leading to exaggerated colitis after adoptive T cell transfer27,28. These findings indicated that STAT5 tetramers are required for gut immune suppression. Our data further showed that STAT5 tetramer depletion induced hyperplastic proliferative IECs, hypertrophic crypts and increased goblet cell, PC, ISC and progenitor cell numbers (Fig. 2a,b and Supplementary Fig. 3a,b), displaying much bigger crypts and villi than WT control crypts and villi (Supplementary Fig. 3c). Strikingly, DKI mice showed a dramatic infiltration of intra-IEC lymphocytes and CD3+ T cells at crypt bases (Fig. 2c), which can be tightly adherent to crypt ISCs or IECs (Fig. 2d). These data suggest the direct role of crypt CD3+ T cells in the IEC hyperplasia and crypt hypertrophy. Next, we determined their effects on Lgr5 ISCs.

a, Stat5a–Stat5b DKI mice display hyperplastic intestinal crypts and increased intra-IEC lymphocytes, as shown with insert CD3 IH, goblet cells, as shown with insert AB staining, and lysozyme (Lyso)+ Paneth cells in the SI compared with WT controls (Con); n = 5 mice per group. b, DKI mice were killed, and SI sections were immunostained with anti-Ki67 antibodies. The number of Ki67+ IECs and hyperplastic crypts was counted. Results are expressed as mean ± s.e.m, ***P < 0.001 versus Con. c, SI or colonic (Co) sections were immunostained with anti-CD3 antibodies, and the numbers of CD3-positive T cells in the SI and Co crypts were counted (n = 5 mice per group). d, Isolated SI and Co crypts were immunostained with anti-CD3 antibodies and counterstained with Alcian blue (AB). The enumeration of intra-crypt CD3+ T cells is shown. Numbers of crypt T cells were counted in 100 isolated crypts per group. Results are expressed as mean ± s.e.m, **P < 0.01, ***P < 0.001 versus Con.
Depleting tetrameric STAT5 in mice significantly increased Lgr5 regeneration
Bulk RNA-seq and GSEA of SI tissue revealed no significant upregulation of genes associated with JAK–STAT, TH1, TH2 and TH17 cells; IL-17 signaling; or TCR pathways in DKI versus control mice (Fig. 3a). However, DKI mice show significant upregulation of IL17rb, Tnfrsf21, Ccl20, Pla2g4c, Wnt5b and Pou2f3, coincident with downregulation of the pro-inflammatory response genes IL12rb2, Ccl21, Reg3b, Reg3g, Csf2 and Twist1 (Fig. 3a), suggesting an exaggerated immune and repair response in the DKI mucosa. We then crossed DKI and Lgr5CreER mice to mark LGR5+ ISCs lacking STAT5 tetramers (Supplementary Fig. 2a). FACS using dissociated crypt cells (Supplementary Fig. 2b) and confocal IF show that these LGR5-DKI mice display significantly greater Lgr5+ and Lgr5‒ ISC proliferation (EdU+) (Fig. 3b,c) and LGR5+ ISC apoptosis (Supplementary Fig. 4a) than WT, indicating that depleting tetrameric STAT5 can significantly induce Lgr5 survival and regeneration. STAT5-overexpressing mice (Rs26CreER;cS5, STAT5Δ+++) have both STAT5 tetrameric and dimeric activation25, and the dimeric STAT5 activation can increase Lgr5+ ISC proliferation or regeneration19,40. Our data further reveal that STAT5Δ+++ mice exhibited significantly less numbers of crypt CD3+ T cells than DKI mice but still more than the number of crypt CD3+ T cells in WT, indicating that STAT5 tetramer depletion leads to greater crypt CD3+ T cells than STAT5 dimeric activation only and suggesting that STAT5 tetramer depletion may lead to the chromatin accessibility to control T cell influx into crypts or and increased interaction of T cells with crypt cells (Fig. 3d,e). Consistent with this notion, we also found that DKI can induce STAT5 overexpression, in addition to pYSTAT5 activation, in the crypt CD3+ T cells compared to control mice (Fig. 3f,g). These data confirm that the STAT5 tetramer inhibits T cell infiltration into the crypt compartment, possibly by epigenetic mechanisms. By contrast, STAT5 tetramer depletion can increase the number of CD3+ T cells entering the crypt bases by enhancing chromatin accessibility to genes controlling T cell differentiation and recruitment into crypts, other than STAT5 dimeric activation. Next, we determined the identity of crypt CD3+ T cells and their functions.

a, SIs from n = 5 DKI and n = 5 WT control (Con) mice were dissected, and RNA was extracted for RNA-seq analysis. The heat map and volcano plot show 407 upregulated genes and 235 downregulated genes in DKI versus Con mice, with fold changes >2 and P values <0.05. DKI mice were crossed with Lgr5CreER (Lgr5) mice to mark LGR5+ ISCs with STAT5 tetramer depletion, and the mice were killed after an EdU intraperitoneal (i.p.) injection. b, SI sections were immunostained for Lgr5+EdU+ cells; the arrows show Lgr5 (green) and EdU (pink) cells. The number of Lgr5+EdU−, Lgr5+EdU+ and Lgr5−EdU+ cells was counted per ISC zone in each crypt. *P < 0.05, **P < 0.01, ***P < 0.001 versus Con. All results are expressed as mean ± s.e.m. c, SI crypts from DKI and Con mice were dissociated into single IEC cells and were gated and analyzed by Flow Jo to measure frequencies of 7-AAD‒Lgr5+EdU+ and Lgr5‒EdU+ crypt cells. *P < 0.05, **P < 0.01, ***P < 0.001 versus Con. d, e, SI from DKI, STAT5Δ+++ and Con (STAT5+/+) mice were dissected, and tissue sections were immunostained with anti-CD3 and counterstained with AB (d); crypt T cells were quantified as the number of crypt CD3+ T cells per crypt (e). f, g, SI tissue sections were immunostained with anti-CD3 and anti-STAT5 (f), and colocalization of CD3 (red) and STAT5 (green) was counted (g). The result is expressed as mean ± s.e.m.; n ≥ 50 crypts, **P < 0.01, ***P < 0.001 versus STAT5Δ+++.
Depleting tetrameric STAT5 in mice activated pYSTAT5 and upregulated IL-17A in crypt CD3+TCRγδ+ T cells
By combining IH and confocal IF, we found that crypt TCRγδ+ T cells are upregulated in the SI and colon of LGR5-DKI mice (Fig. 4a, b). These crypt TCRγδ+ T cells are located at the crypt base or in between Lgr5 ISCs (Fig. 4b). Consistently, FACS analysis using dissociated crypt cells showed that crypt CD3+TCRγδ+ T cells in the LGR5-DKI SI or colon are significantly greater than WT controls (Fig. 4c and Supplementary Fig. 4b). These data indicate that depleting tetrameric STAT5 can increase crypt CD3+TCRγδ+ T cells. Compared with WT, the frequency of pYSTAT5+ and/or IL-17A+CD3+TCRγδ crypt cells is increased in SI or colon of LGR5-DKI mice (Fig. 4d,e). Noticeably, the mean fluorescence intensity of intracellular IL-17A is increased in the SI crypt CD3+TCRγδ+ T cells in LGR5-DKI mice (Fig. 4d). In concomitant with upregulated pYSTAT5 and IL-17A in CD3+TCRγδ crypt cells upon depleting the tetrameric STAT5 (Fig. 4d,e), the number of Lgr5+ and Paneth cell niche cells is increased in the crypts (Figs. 2a and 3b). We then ask whether these crypt T cells are migrated from the LP. Using a gentle MACS dissociator to dissociate intestinal LP cells, we performed FACS analysis with CD3, CD4, CD8, TCRγδ, pYSTAT5 and IL-17A to identify CD3+CD4−CD8−TCRγδ+IL-17A+, CD3+CD4−CD8−TCRγδ+pYSTAT5+ and CD3+CD4−CD8−TCRγδ+IL-17A+pYSTAT5+ cells in LP. As shown in Fig. 4f–i, the frequency of LP IL-17A+TCRγδ+ cells and IL-17A+pYSTAT5+ TCRγδ+ T cells is significantly increased compared with control mice, suggesting that crypt TCRγδ T cells migrated from LP. In summary, these data indicate that depleting tetrameric STAT5 activates STAT5, leading to increased migration of CD3+TCRγδ+ crypt cells from the LP, which may promote Lgr5 ISC regeneration by secreting IL-17A14. These data also suggest a direct role for dimeric STAT5 activation, at the expense of suppressive tetrameric STAT5, IL-17A expression in crypt CD3+TCRγδ+T cells.

a, SI and colon (Co) sections from 5 Lgr5-DKI and 5 Lgr5 control (Con) mice were stained with TCRγδ IH. TCRγδ+ crypt T cells were quantified as ‘0’, no TCRγδ+ T cells, ‘1’, one TCRγδ+ T cell, ‘2’, two TCRγδ+ T cells, and ‘3’, three TCRγδ+ T cells. The results are expressed mean ± s.e.m. b, SI or Co sections were IF-stained to show Lgr5+ ISCs (green) and crypt TCRγδ+ T cells (red). The asterisk shows TCRγδ+ T cells within crypts. Images were captured with a confocal microscope. SI and Co crypts were isolated from 5 Lgr5-DKI and 5 Lgr5 Con mice and dissociated into single cells. The dissociated IECs were stained with anti-GFP, anti-CD3, anti-CD4 and anti-CD8, anti-TCRαβ and anti-TCRγδ, anti-pYSTAT5, and IL-17A FACS antibodies. c, Scatter graphs and frequency of SI or Co CD3+CD4−CD8–TCRγδ+ cells in the crypt lymphocytes are shown. The results are expressed as mean ± s.e.m. **P < 0.01 versus Lgr5-Con. d, IL-17A expression was determined as the frequency of SI or Co crypt IL-17A+CD3+TCRγδ+ T cells or the mean fluorescence intensity (MFI) of IL-17A in the SI or Co crypt CD3+TCRγδ+ T cells. Representative FACS scatter plots of isotype controls (iso), Lgr5-Con and DKI are shown. The results are expressed as mean ± s.e.m. **P < 0.01 versus Lgr5 Con. e, pYSTAT5 activation in the crypt IL-17A+TCRγδ+ T cells was determined as the frequency of pYSTAT5+IL-17A+ in the SI or Co crypt CD3+TCRγδ+ T cells. The representative scatter graphs of pYSTAT5 and IL-17A are shown, and the results are expressed as mean ± s.e.m. *P < 0.05 or ***P < 0.001 versus Lgr5-Con. f–i, The LP cells were gently dissociated using a MACS dissociator from four to five Lgr5-Con or Lgr5-DKI mice. The LP cells labeled for CD3, CD4, CD8, TCRγδ, pYSTAT5 and IL-17A were analyzed by FACS to identify CD3+CD4−CD8–TCRγδ+IL-17A+, CD3+CD4−CD8−TCRγδ+pYSTAT5+ (f) and CD3+CD4–CD8–TCRγδ+IL-17A+pYSTAT5+ (h) cell populations. Representative scatter plots showing the frequencies of CD3+CD4–CD8–IL-17A+TCRγδ+ T cells in LP lymphocytes (g) or IL-17A+pYSTAT5+ cells within TCRγδ+ LP T cells (i) are presented. Results are expressed as mean ± s.e.m. ***P < 0.001 compared with Lgr5-Con.
Depletion of tetrameric STAT5 in mice protected ISCs from IR or colitis injuries and promoted de novo crypt regeneration
To further elucidate the role of STAT5 tetramerization in forming the crypt TCRγδ T cell niche and ISC regeneration. We treated DKI and WT control mice with 13-Gy ionizing irradiation (IR). The HE staining and IH for Ki67 in DKI and WT mice treated with IR revealed significantly increased regenerated crypts in DKI mice compared to controls, which may be indicative of increased ISC regeneration in DKI animals (Fig. 5a). Notably, we also detected a robust increase in crypt CD3+ T cells and goblet cells in DKI crypts (Fig. 5b and Supplementary Fig. 5a), suggesting a positive role for crypt T cells in the regulation of ISC regeneration in vivo. RNA-seq and GSEA analyses further show that IR-treated DKI mice exhibit activated JAK–STAT and increased Th1, Th2, and Th17 cell differentiation, stem cell pluripotency pathways, cytokine–cytokine receptor interactions, and antigen processing and presentation (Fig. 5c). Strikingly, numbers of the crypt containing TCRγδ+ T cells in DKI mice were significantly higher than TCRγδ+ T cells in WT (Fig. 5d). qPCR shows that the upregulated IL-4, IL-6, IL-17 and IL-27, in contrast to reduced IL-23, Lgr5 and Metallothioneins (Mt1) by comparing DKI with Con (Fig. 5e,f). These data suggest enhanced crosstalk between TCRγδ+ T cells and antigen-presenting cells or stem cells in DKI mice. Consistently, using two DSS-induced colitis models (Supplementary Fig. 5b(i),(ii)), particularly by three cycles of 5-day DSS following 16-day water recovery specific for apoptosis-induced colonic ISC regeneration19,43 (Supplementary Fig. 5c), we found that depleting STAT5 tetramers significantly increased the regeneration of nascent crypts adjacent to ulcers compared with WT controls (Fig. 5g), which is coincident with elevated colonic crypt CD3+ T cells (Fig. 5h). In those regenerated colon crypts, IH shows that colonic crypt TCRγδ+ T cells are increased in DKI mice (Fig. 5i), which is consistent with IBD–UC colon crypts, where more crypt lymphocytes and TCRγδ+ T cells appeared (Fig. 1c,d and Supplementary Fig. 1e). These data suggest that the crypt TCRγδ+ T cells act as a niche to assist colonic ISC regeneration.

A total of six DKI and five control (Con) mice were treated with 13 Gy IR. a, At 3.5 days post IR, the mice were killed. SI sections were stained with HE and immunostained with anti-Ki67 antibodies; Ki67+ crypts were counted as regenerated. b, SI sections were immunostained with anti-CD3 antibodies and counterstained with AB; CD3+ crypt T cells were quantified. Results are expressed as the mean ± s.e.m.; n = 5 mice per group, **P < 0.01, ***P < 0.001 versus Con. c, RNA was extracted from SIs of a total of six DKI and five Con mice in two independent experiments and subjected to RNA-seq analysis. The heat map shows hierarchical clustering of 142 genes with ANOVA P < 0.05 and expression fold change >2 in DKI versus Con mice (n = 5 per group). GSEA shows activation of TH1, TH2 and TH17, as well as TCR, IL-17, JAK–STAT and pluripotency pathways. d, SI sections from five IR-treated DKI and five Con mice were immunostained with anti-TCRγδ IH. TCRγδ+ crypt T cells in the regenerative crypts were quantified as ‘0’, no TCRγδ+ T cells, ‘1’, one TCRγδ+ T cell, ‘2’, two TCRγδ+ T cells, and ‘≥3’, more than three TCRγδ+ T cells. The results are expressed as mean ± s.e.m. e, f, Mucosa tissues were isolated from DKI and Con mice with or without IR treatment. The total RNA was extracted, and mRNA levels of TH1, TH2 and TH17 cytokines (e), Lgr5 ISC, Paneth cell markers and Mt1 (f) were measured by qPCR. Results are expressed as the mean ± SEM; n = 5 mice per group, **P < 0.01, ***P < 0.001 versus Con. The same number of DKI and WT Con mice were treated with either three cycles of 2.5% DSS with a 10-day water recovery in between (i) or 7-day DSS followed by 5-day water recovery (ii), with n = 5 per group. g, h, The mice were killed. Colonic tissues were isolated, sectioned and stained with HE, Ki67 IH (g), and CD3 IH (h). The number of CD3- or Ki67-positive cells within the ISC stem cell zone was counted. The results were expressed as mean ± s.e.m.; n = 50 crypts, **P < 0.01 versus WT Con. Scale bar, 200 μm. i, Consecutive sections from five DKI and five WT Con mice with three cycles of DSS treatment were stained with TCRγδ IH. TCRγδ+ crypt T cells were scored as ‘0’ for no TCRγδ+ T cells, ‘1’ for one TCRγδ+ T cell, ‘2’ for two TCRγδ+ T cells, and ‘3’ for three TCRγδ+ T cells. The results are expressed as mean ± s.e.m. Representative cross-sections showing TCRγδ+ T cell staining are displayed.
Tetrameric STAT5-deficient organoids exhibited reduced growth under IR exposure compared with the WT control group
In contrast to in vivo data, DKI enteroids generated from DKI mice exhibit reduced ISC proliferation and increased IEC hyperplasia compared with WT enteroids, manifested by reduced budding rate and increased number of spheroids in DKI enteroids (Fig. 6a). Proliferation of DKI enteroids is inhibited by 2-Gy IR to a greater extent than WT enteroids (Fig. 6b), indicating that depleting STAT5 tetramer decreases ISC proliferation and regeneration in vitro in an intrinsic manner. Intriguingly, confocal IF analysis revealed that enteroids differentiated from LGR5-DKI mice have fewer EdU+ ISCs at crypt bases and more EdU+ IECs in the villi and TA zone (Fig. 6c,d and Supplementary Fig. 6a), suggesting that STAT5 tetramer depletion increases progenitor hyperplasia. Consistent with these data, RNA-seq showed reduced stem cell pluripotency and enhanced antigen-processing and antigen-presentation pathways in DKI enteroids (Fig. 6e,f). Notably, the culture medium from the primary enteroids directly differentiated from IR-treated DKI crypts adhered by CD3+ T cells, exhibited the enhanced stimulation of WT enteroids growth, manifested by increased budding rate and reduced the number of spheres (Fig. 6g,h and Supplementary Fig. 6b). These data suggest that the in vivo effects of STAT5 tetramer depletion on Lgr5 ISC regeneration are due to niche cells like crypt TCRγδ+ cells. Together, these data suggest that STAT5 tetramer depletion drives ISC regeneration by promoting crypt T cell niche formation, thereby protecting Lgr5+ ISCs from injury. STAT5 tetramerization plays opposing roles in IECs and T cells, and DKI mediates ISC regeneration in vivo, possibly via STAT5 activation in the crypt T cells.

Enteroids were differentiated from the SI crypts of DKI and control (Con) mice. a, A subset of these enteroids was used to quantify proliferation and multiplicity. Results are expressed as the mean ± s.e.m.; >10 enteroids per group were traced and counted, ***P < 0.001 versus Con. b, The remaining enteroids were exposed to 2-Gy IR for 10 min on day 5 and allowed to differentiate for another 4 days. Organoid budding curves were generated from n = 10 enteroids per group, ***P < 0.001 versus Con + IR. c, Enteroids from Lgr5-DKI and Lgr5CreER mice were differentiated for 14 days with EdU added on day 10. d, EdU+ IECs or Lgr5+ ISCs were analyzed; >10 enteroids per group were counted, *P < 0.05, **P < 0.01 versus Con. e, After passage, enteroids were differentiated for 7 days, and RNA was extracted for RNA-seq analysis. The heat map and volcano plot show differentially expressed genes with fold change >2.0 and P < 0.05; n = 3 mice per group. f, GSEA reveals upregulation of TCR activation, stem cell pluripotency and antigen-processing and antigen-presentation pathways. g, DKI and Con mice were treated with 13 Gy IR. At 3.5 days post IR, the mice were killed. Primary enteroids were differentiated from the SI crypts of DKI and Con mice for 8 days. The medium from the primary intact crypt-derived enteroids of DKI and WT Con was transferred to the WT Con enteroids to coculture for 6 days, and the number of crypt budding and enteroids multiplicity were determined. h, The variance analysis was used to analyze the difference between the two groups treated with the transferred medium from DKI and WT Con. Results are expressed as the mean ± s.e.m., *P < 0.05, **P < 0.01 versus Con. All data presented in the organoid culture are representative of at least three repeated experiments. i–k, The enteroids were derived from intact Lgr5 crypts dissociated from Lgr5CreER mice. The enteroids were stimulated with IL-17A (1, 10 or 50 ng/ml) for 6 days. Representative GFP or GFP + DIC images of enteroids or IL-17-treated samples are shown from day 0 to day 5 (i). Lgr5 colony formation or colony growth in the 1 ng/ml or 50 ng/ml-treated enteroids (j), and budding curves of enteroids treated with 1, 10 or 50 ng/ml (k) were measured from 100 to 200 Lgr5+ or Lgr5− intact crypt-derived enteroids. Results are expressed as the mean ± s.e.m, *P < 0.05, versus Lgr5-Con. l, The enteroids on day 5 were collected, and total RNA was extracted. The expression levels of Lgr5, Atoh1, Lyz1, Olfm4 and Ascl2 were quantified using qPCR. Results are shown as mean ± s.e.m., with no significant differences (NS), *P < 0.05, **P < 0.01 or ***P < 0.0001 compared with Lgr5-Con, n = 4–6. m, n, The enteroids treated with 1 ng/ml or 50 ng/ml on day 5 were incubated with EdU, then collected and fixed with paraformaldehyde (PFA). Sections of 10-μm thickness were stained with anti-GFP and EdU IF (m). Lgr5+, EdU+ or Lgr5+EdU+ organoid cells were quantified as the number per organoid crypt; scatter plots are shown (n). Results are expressed as the mean ± s.e.m., with no significant difference (NS), *P < 0.05 or **P < 0.01 compared with Lgr5-Con, n = 4–6.
IL-17A promoted crypt IEC regeneration in a biphasic, dose-dependent manner
Our results revealed that depleting tetrameric STAT5 increases IL-17A expression in TCRγδ T cells at both crypt and LP (Fig. 4d,f). IL-17A has a dual, context-dependent role in ISCs, serving as a key promoter of tissue repair by inducing Lgr5+ ISCs to differentiate into secretory cells (goblet, Paneth, tuft) through the transcription factor ATOH114. Inhibiting IL-17A secretion worsens IBD severity44. However, during chronic inflammation, excessive IL-17 signaling can paradoxically promote abnormal proliferation or apoptosis of ISCs, highlighting its complex interactions with intestinal homeostasis and disease45. Still, it remains unclear at what doses or timing IL-17A can directly act on Lgr5+ ISCs or on other cell types during differentiation. To address these questions, we tested different doses (1, 10 and 50 ng/ml) of IL-17A on intact crypt-derived organoids, examining Lgr5 colony-forming efficiency, budding index, ATOH1/LGR5 programs and EdU incorporation. Using enteroids derived from intact Lgr5 crypts dissociated from Lgr5CreER mice, we stimulated the enteroids with IL-17A (1, 10 or 50 ng/ml). As shown in Fig. 6, 1 ng/ml of IL-17A increases crypt budding of Lgr5 enteroids and Lgr5 ISC proliferation compared to vehicle control, indicated by colony formation of Lgr5-GFP buds and the number of Lgr5+EdU+ ISCs (Fig. 6j,k,m,n). By contrast, 50 ng/ml of IL-17A promotes spheroid formation and organoid IEC proliferation, as demonstrated by organoid budding in Fig. 6i,k, multiplicity in Supplementary Fig. 6c and EdU staining in Fig. 6m,n, after 5-day induction with IL-17A. Consistently, qPCR and IF results show that 50 ng/ml of IL-17A can significantly increase Atoh1, Lyz1 and Olfm4 expression as well as the number of Lyz1+ organoid IECs and Lgr5−EdU+ spheroid IECs while decreasing Lgr5 and Ascl2 compared with vehicle control (Fig. 6l,n and Supplementary Fig. 6d,e), indicating that higher doses of IL-17A can halt Lgr5 ISC self-renewal and promote differentiation toward secretory lineages. However, using intact crypt-derived enteroids treated with IL-17A, our data also suggest that IL-17A might act on Lgr5+ or Olfm4+ ISCs differently or increase the switch of Lgr5 into Olfm4 ISCs that can repair the apoptotic IECs46, as evidenced by 50 ng/ml of IL-17A inhibiting Lgr5 while increasing Olfm4 expression in enteroids. By integrating scRNA-seq, GSEA and trajectory analysis, we next determined how STAT5 tetramer depletion enhances the migration of crypt TCRγδ+ T cells into the ISC compartment and their differentiation into niche cells, thereby facilitating ISC regeneration.
STAT5 tetramer depletion increased crypt T cell interaction with ISCs at a single-cell level, propelling them to form a healing cell population
Although ISCs were reported to crosstalk with T cells through MHC–TCR or E-cadherin-integrin αEβ7 interactions, it is not known how ISCs and T cells interact in the context of the deregulated cytokines that are often aberrantly expressed during mucosal inflammation11,15,17. To address this question, we performed scRNA-seq on dissociated SI mucosal cells and identified 32 SI cell populations (Fig. 7a,b, and Supplementary Fig. 7a). Of these, population 23 is characterized by a TCR gene signature and defined as the T cell population. Population 11 is characterized by an Lgr5 ISC gene signature with enhanced cell cycling and is defined as the ISC population. Population 1 is characterized by Lgr5 ISC and TCR cell gene signatures with activated Wnt and T cell signaling, and is defined as the ISC + T cells population (Fig. 7c–e and Supplementary Fig. 7b,c). The cells in cluster 1 have a potent regenerative capacity with enhanced TGF-β signaling and innate immune response (Supplementary Fig. 7d,e). Trajectory analysis reveals that T cells in cluster 23 are driven to differentiate toward the T cells in cluster 1, suggesting that the T cells in cluster 1 have more robust or active functions than the T cells in cluster 23 (Fig. 7f). Stem cells in cluster 11 are driven to mature toward the stem cells in cluster 1, suggesting that the cells in cluster 1 are more active in cell division, proliferation, and regeneration than the stem cells in cluster 11 (Fig. 7g). Importantly, compared with WT control, GSEA analysis revealed that depleting STAT5 tetramer leads to increased TCR pathway and reduced JAK–STAT activation in the T cell population (cluster 23; Fig. 7h and Supplementary Fig. 7f), increased DNA replication in the Lgr5 ISC population (cluster 11; Fig. 7i) and elevated stem cell division, Notch and TLR signaling while reduced allograft rejection and cell adhesion signaling in the ISC and T cell mixed population (cluster 1; Fig. 7j,k and Supplementary Fig. 7g–i). These data indicate that depleting STAT5 tetramer can enhance the regenerative capacity in cluster 1. Intriguingly, IL-17RA is increased in cluster 1 besides Lgr5 (Fig. 7l). Compared with cluster 1 in WT controls, TCRγδ cell regulatory genes47, such as Sox13, Rorc and Cd3e, are increased, and the genes regulating ISCs14, such as Lgr5, Olfm4 and IL-17RA, are upregulated in cluster 1 in DKI, suggesting an enhanced ISC function in cluster 1 possibly via IL-17RA (Fig. 7m and Supplementary Fig. 7j). Trajectory analysis revealed that depleting STAT5 tetramer promotes the transition of T cell cluster 23 or Lgr5 ISCs in cluster 11 toward the T cell and Lgr5 ISC populations in cluster 1 (Fig. 7n). Taken together, we demonstrate that STAT5 tetramer depletion enhances IL-17A action of TCRγδ T cells on Lgr5+ ISCs, possibly by activating Notch signaling in T cells and Wnt signaling in ISCs. This effect could cooperate with Paneth cells to promote Lgr5 ISC regeneration and repair during mucosal inflammation with the deregulated cytokines (Fig. 7o).

SI mucosal cells from three DKI and three WT control (Con) mice were dissociated into single cells, and 13,000 single cells per sample were analyzed by scRNA-seq. a, b, A total of 32 populations of intestinal cells were annotated and clustered into 11 types for both DKI and Con mice. a Intestinal cells are annotated into 32 populations of cells. b Thirty-two populations respectively in Con or DKI mice. Arrows show population 1, 11, or 23 in Con and DKI mice. c, GSEA analyses reveal that the TCR signaling pathway in cluster 23 is markedly activated compared with the other clusters, along with significant upregulation of CD3, PI3K, NFκB and MAPK genes. d, e, Compared with the rest of the clusters, cell cycling signaling in cluster 1 is significantly upregulated (d), and Wnt signaling is elevated with robustly activated TCF7L2, WNT3 and AXIN2 genes (e). The normalized enrichment score (NES), and adjusted P values are shown. Trajectory analysis was done by cell states and shows the roots of cell differentiation and maturation. f, T cells in cluster 23 were driven to differentiate into T cells in cluster 1 via sequential cell states 1–2–4 or 1–3. The arrows show the direction of T cell differentiation. g, Stem cells in cluster 11 were driven to mature toward the stem cells in cluster 1 by cell states, 1–2. The arrows indicate the direction of stem cell maturation. h–k, Compared with WT Con, GSEA analyses reveal that DKI exhibited significantly activated TCR signaling in the T cell population (cluster 23) (h), increased DNA replication in the stem cell population (cluster 11) (i), enhanced stem cell division (j) and elevated Notch activation (k) in the stem cell and T cell mixed population (cluster 1); NES and adjusted P values are shown. l, Compared with the rest of the clusters, Lgr5 and IL-17RA genes are highly enriched in clusters 11 and 1. m, DKI exhibits increased Sox13, Rorc, Lgr5 and IL-17RA genes in cluster 1 compared with cluster 1 in WT Con. Representative violin graphs and scatter graphs are shown. n, Pseudotime trajectory analyses reveal that the cell states in clusters 23 or 11 in DKI progress toward cluster 1 more quickly and more strongly than in WT Con, suggesting that DKI increases the transition of cluster 11 or 23 toward cluster 1 more than WT Con. o, Depleting STAT5 tetramers promotes the formation of an Lgr5 ISC and a T cell population with vigorous healing capacity. p, Using Loupe analysis to analyze 32 populations, Lgr5 and IL17RA are highly enriched in cluster 1, suggesting that it contains a large number of ISCs. Trdc and Cd3e are highly enriched in cluster 1, suggesting that it contains a large number of ISCs and TCRγδ T cells. q, Cluster 1 was further separated into five populations: 0–4. r, The bubble plot shows the expression of Lgr5, Cd3e, Olfm4, Cd3d, Cd3e, MKi67 and Trdc in different populations separated from cluster 1. s–v, Compared with WT Con, GSEA analyses reveal that DKI significantly activated TLR in population 0 (s), significantly upregulated cell adhesion pathway in DKI compared to Con (t), significantly upregulated cell cycle pathway in DKI compared to Con (u) and the TCR pathway in population 2 (v). NES and adjusted P values are shown.
To demonstrate our hypothesis, we further analyzed cluster 1 and examined gene expression in Lgr5 cells and T cells using specific markers: Lgr5 and IL-17RA for crypt Lgr5 cells and Cd3e and Trdc for TCRδ T cells. Our results confirm that cluster 1 is a mixed population including Lgr5 cells and TCRδ T cells (Fig. 7p). We divided cluster 1 into five subpopulations (clusters 0, 1, 2, 3 and 4; Fig. 7q). We identified that cluster 0 represents Lgr5 ISCs and TCRγδ T cells, marked by Lgr5, Cd3d and Trdc as shown in Fig. 7r. TLR signaling in DKI cluster 0 is significantly upregulated compared with control, suggesting increased healing activity in DKI (Fig. 7s). Cluster 1 is defined as Lgr5 ISCs and characterized by Lgr5. Cell adhesion in DKI cluster 1 increases, whereas cell cycling decreases, suggesting elevated Lgr5 and T cell adhesion tendency in cluster 1 (Fig. 7t,u). Cluster 2 is characterized by Trdc and increased TCR signaling, indicating activated T cell function (Fig. 7v). We next determine how crypt TCRγδ cells are differentiated and migrated from the mucosa upon STAT5 tetramer depletion.
Tetrameric STAT5-deficient mice displayed reduced STAT5 binding to the Mt1 gene, thereby relieving the repression of TCRγδ cell differentiation and migration into crypts
Metallothionein 1 (MT1) proteins can suppress T regulatory type 1 (TR1) and TH17 cell differentiation while regulating CD4+ T cell differentiation toward Treg cells48,49,50. Interestingly, MT1 can be released into the extracellular matrix to stimulate inflammation. Although M1 regulation and function are poorly understood, Mt1 can be mainly expressed in T cells49. ChIP sequencing and qPCR analyses of SI crypts (Fig. 8a) showed that STAT5 highly binds the Mt1 locus under standard conditions. By contrast, STAT5 tetramer depletion significantly decreases STAT5 binding on Mt1 locus (Fig. 8b,c), indicating that the reduced occupancy of STAT5 on Mt1 induced by STAT5 tetramer depletion releases the STAT5 repression of Mt1 activity. Interestingly, H3K4Me3 recruited by STAT5 tetramer depletion was slightly upregulated on the Mt1 promoter compared with input controls (Supplementary Fig. 8), suggesting that the repressed Mt1 activity induced by STAT5 tetramers is attributed to a suppressive chromatin that could be formed by a long-range interaction of the Mt1 promoter with enhancers or silencers. qPCR on crypt RNA extracted from control and DKI samples revealed that Mt1 expression is significantly higher in DKI than in controls (Fig. 8d). These data suggest that, upon STAT5 tetramer depletion, STAT5 binding to Mt1 genes in crypt T cells decreases, leading to increased Mt1 levels that promote T cell migration into the crypt ISC compartment.

a, SI from three DKI and three control (Con) mice were dissected, and intestinal crypts were dissociated. b, The nuclear proteins and DNA complex were extracted from 2000 crypts, cross-linked and then immunoprecipitated with total STAT5 antibodies. Libraries for next-generation sequencing were also prepared and sequenced with a HiSeq 2500 instrument. c, qPCR was used to measure the GAS motif (TTCTAGAA) at the Mt1 locus using nuclear protein–DNA complexes extracted from the crypts of DKI and Con mice. N = 5 mice per group, **P < 0.01 versus Con. d, The RNA from the dissociated crypts was extracted and analyzed by qPCR to determine Mt1 expression. The relative expression of Mt1 is quantified in the DKI and Con groups. Results are expressed as the mean ± s.e.m., **P < 0.01 versus Lgr5-Con, n = 5. e, Diagram description: STAT5 tetramers inhibit T cell influx into crypt bases (i) under normal conditions. During regeneration, depletion of STAT5 tetramers may lead to the formation of a crypt TCRγδ T cell niche, promoting ISC regeneration and IBD healing by increasing IL-17A interactions with IL-17RA on Lgr5 ISCs (ii).