
Trifluoperazine dihydrochloride (TFP), Pefabloc SC, pepstatin A, Z-AAD-CMK and E64d were purchased from Sigma-Aldrich. H-Leu-Leu-OMe (LLME) was purchased from Bachem. Bafilomycin A1 was obtained from Invivogen. Z-DEVD-FMK and Z-VAD-CMK were obtained from AH Diagnostics.
Mice
Mice were on C57BL/6 J genetic background. Both female and male mice (6–10 weeks of age) were used. The animal experiments were conducted in compliance with ethical regulations, and were approved by the local ethical committee (Uppsala djurförsöksetiska nämnd, Uppsala, Sweden; no C 31/14). Randomisation or blinding was not used.
Cell culture
Mouse bone marrow-derived MCs (BMMCs) were generated and cultured according to an earlier described protocol [49] with minor modifications. Briefly, cells were cultured in Dulbecco’s modified Eagle’s medium (DMEM) (Thermo Fisher Scientific) supplemented with 10% heat-inactivated fetal bovine serum (FBS) (Gibco), Penicillin-Streptomycin (100 U/mL, 100 μg/mL (Sigma-Aldrich)), 1 mM sodium pyruvate (Sigma-Aldrich) and 10 ng/ml recombinant mouse IL-3 (Peprotech) and 10 ng/ml stem cell factor (SCF; Peprotech). Cells that were at least four weeks old were analysed for the expression of c-kit using an anti-CD117 antibody (2B8)-APC (BD Biosciences, # 553356) and FcɛRI (using an anti-FcɛRI antibody (MAR-1)-PE (Thermo Fisher scientific, #12-5898-82)) with a two laser Accuri instrument (BD Biosciences, San Jose, CA) and used for further experiments. The anti-mouse antibodies used above are described as target (clone)-fluorochrome conjugate, vendor, #catalog number. Peritoneal cell-derived MCs (PCMCs) were cultured as described [23, 50]. Immortalized Human Mast Cell Line (LUVA) was obtained from Kerafast (#EG1701-FP) and cultured in complete StemPro™-34 SFM (Thermo Fisher Scientific), supplemented with 2 mM L-glutamine or 1× GlutaMAX™ (Thermo Fisher Scientific) and penicillin–streptomycin in the presence of IL-3, SCF, and IL-6 (Peprotech). The cells were subcultured every 3–4 days. Primary human lung fibroblasts (HLFs) (PCS-201-013) and primary human lung smooth muscle cells (HLSMCs)(PCS-130-010) were obtained from American Type Culture Collection (ATCC, Manassas, VA) and cultured following the manufacturer’s instructions. Primary human small airway epithelial cells (HSAECs) (PCS-301-010) were obtained from ATCC and cultured in Airway Epithelial Cell Basal Medium (ATCC) containing a Bronchial Epithelial Cell Growth Kit (ATCC) and penicillin-streptomycin (100 U/mL, 100 μg/mL). Triple-negative human breast cancer cell line Hs578T was obtained from ATCC (HTB-126) and cultured at 37 °C in 5% CO2 in DMEM (Invitrogen) supplemented with 10% FBS, penicillin-streptomycin (50 μg/ml, 60 μg/ml), and 2 mM L-glutamine (Sigma-Aldrich). The cells were subcultured after reaching 90-100% confluency.
Preparation of peripheral blood granulocytes
Eosinophil and neutrophil granulocytes were isolated from peripheral blood of healthy donors by Percoll gradient centrifugation as described [51]. Informed consent was obtained from all blood donors and the use of the blood samples for the present project was approved by the Uppsala Regional Ethical Review Board (Dnr 2020-05080).
Nasal polyp tissue
Nasal polyps were obtained from participants undergoing Functional Endoscopic Sinus Surgery at Otorhinolaryngology and Head and Neck Surgery clinic, Uppsala University Hospital. The study was approved by the Uppsala Regional Ethical Review Board (Dnr 2022-06097-02) and written informed consent was provided by all participants. The tissue was collected immediately after surgical excision, transferred into ice-cold saline buffer, and stored on ice until used in experiments. Patients with polyps included both asthma and non-asthma subjects. Single cell suspensions from nasal polyps were obtained using a previously published protocol [52] with some minor modifications. Briefly, nasal polyp tissue was washed twice with PBS and cut into small pieces using scalpel blades and curved scissors. These pieces were further washed with PBS through a 70-μm filter to remove residual red blood cells (RBCs) and enzymatically digested for 30 min in digestion medium containing 2.8 mg/ml collagenase type IV (Sigma) and 0.03 mg/ml DNAse I (PanReac Applichem) in Roswell Park Memorial Institute (RPMI) 1640 medium (Gibco) supplemented with 10% FBS, Penicillin-Streptomycin (100 U/mL, 100 μg/mL) and 2 mM L-glutamine (complete RPMI) at 37 °C with stirring. After 30 min incubation, samples were mechanically disrupted using a syringe with 16 G needle for five times and incubated with the digestion medium for another 30 min. The enzymatic process was terminated by adding ice-cold complete RPMI. Next, samples were filtered through 40-μm and 70-μm cell strainers and centrifuged at 400xrcf (4 °C) for 10 min. RBCs were lysed using ACK buffer (Thermo Fisher Scientific) for 5 min on ice and samples were washed with PBS 2% FBS. Cells were further resuspended in PBS 2% FBS. Cell numbers and viability was determined using trypan blue (Thermo Fisher Scientific) exclusion and quantified by an automated cell counter (Countess TMII FL, Life Technologies) and/or hemocytometer. Extracted nasal polyp cells were resuspended in complete RPMI and subsequently incubated with PBS and/or TFP (10 μΜ) for 19 h in a humidified 37 °C incubator with 5% CO2, followed by flow cytometry analysis.
Incubation of BMMCs with TFP and inhibitors
BMMCs were seeded in a 96-well plate in DMEM supplemented with 10% FBS, Penicillin-Streptomycin (100 U/mL, 100 μg/mL), and 1 mM sodium pyruvate. TFP was added to the cells at different concentrations and time periods and the plates were incubated at 37 °C in 5% CO2 in a humidified atmosphere. Cytotoxicity was assessed by flow cytometry. To investigate the effect of various protease inhibitors in response to TFP-induced cell death, BMMCs were pretreated with either the serine protease inhibitor Pefabloc SC (0.1 mM), the aspartic acid protease inhibitor pepstatin A (50 μΜ) or the cysteine protease inhibitor E64d (20 μΜ) for 30 min, followed by incubation with TFP. Cell death was assessed after 24 h. Caspase activation was evaluated by staining the cells with Caspase 3/7 Green Detection Reagent (2 μM) (Invitrogen). To this end, flow cytometric analysis of induced FITC fluorescence was performed. BMMCs treated with LLME (500 μΜ) for 1 h were included as positive control for caspase 3/7 activation [31]. To evaluate the enzymatic activity of caspase 3/7 inhibitor Z-DEVD-FMK, BMMCs were preincubated with Z-DEVD-FMK (20 μΜ) for 30 min followed by incubation with LLME (500 μΜ) for 1 h and measurement of caspase 3/7 activation. To delineate whether granule acidity mediates TFP-induced cell death, BMMCs were preincubated with the V-ATPase inhibitor bafilomycin A1 (20 nM) (Baf A1) followed by treatment with TFP. Caspase and granzyme B (GzmB) contribution to TFP-induced cell death was assessed by pretreating the cells with the pan-caspase inhibitor Z-VAD-FMK (20 μM) and Z-DEVD-FMK (20 μΜ) or the GzmB inhibitor Z-AAD-CMK (1, 10 μΜ), respectively, for 30 min followed by TFP treatment. When appropriate, the enzymatic activity of protease inhibitors and Z-AAD-CMK was tested using commercially available kits and/or fluorogenic substrates (Fig. S1).
Cysteine cathepsin-like activity measurement
E64d inhibitor activity was measured using the chromogenic peptide substrate Z-Phe-Arg-AMC (Bachem) using a previously published protocol [31] with some minor modifications. Briefly, Hs578T cells were left untreated or treated with E64d (20 μΜ) and/or Pefabloc SC (0.1 mM) for 30 min at 37 °C. The cells were then collected in Eppendorf tubes and centrifuged at 1.200×rpm (4 °C) for 8 min. The cell pellet was washed with ice-cold PBS, centrifuged at 1.200×rpm (4 °C) for 8 min and lysed in 50 μL of lysis buffer (150 mM NaCl, 20 mM Tris-HCl, pH 7.2, 1% (v/v) Triton X-100). After 15 min incubation on ice, the supernatant was removed by centrifugation at 10.000×rcf (4 °C) for 1 min. Twenty μL lysate from each sample was then mixed with 20 μL H2O and 50 μL PBS containing 1 mM EDTA and 1 mM dithiothreitol (DTT) (pH 6.0), and transferred in triplicates into individual wells of a 96-well flat-bottomed plate. Samples were incubated for 15 min at 37 °C. Next, 10 μL of 200 μM Z-Phe-Arg-AMC was added followed by incubation for 30 min at 37 °C. Fluorescence was then measured with a TECAN Infinite M200 plate reader at an excitation wavelength of 390 nm and an emission wavelength of 460 nm.
Cathepsin D activity assay
Pepstatin A (PesA) inhibitor activity was measured in cell lysates using a fluorometric cathepsin D (CTSD) activity assay kit (Abcam) according to manufacturer’s instructions. Briefly, BMMCs (1 × 10⁶) were incubated with or without PesA (50 μΜ) for 30 min at 37 °C. The cells were collected in Eppendorf tubes and centrifuged at 400×rcf (4 °C) for 5 min. The cell pellet was then washed with ice-cold PBS, centrifuged at 400×rcf (4 °C) for 4 min and lysed in 200 μL of chilled CD Lysis Buffer. After 10 min incubation on ice, samples were centrifuged at 10.000xrcf (4 °C) for 2 min. Equal amounts of sample were loaded in triplicates and CTSD substrate was added to the reaction. Plates were incubated for 1.5 h at 37 °C, protected from light. Fluorescence was then measured with a TECAN Infinite M200 plate reader at an excitation wavelength of 328 nm and an emission wavelength of 460 nm.
Granzyme B activity measurement
Z-AAD-CMK activity was determined by measuring GzmB activity according to previously described protocols [53] with some modifications. Briefly, BMMCs were incubated with or without Z-AAD-CMK (1, 10 μΜ) for 30 min at 37 °C. Cell lysates were prepared as described above using the lysis buffer (150 mM NaCl, 20 mM Tris-HCl, pH 7.2, 1% (v/v) Triton X-100). Next, 5 μL from the resulting lysates (corresponding to 100.000 cells) were transferred in triplicates into individual wells of a 96-well flat-bottomed plates and mixed with 95 μL of a reaction buffer (50 mM Hepes, pH 7.5, 10% (w/v) sucrose, 0.05% (w/v) CHAPS, and 5 mM DTT) and 10 μL of N-Ac-IEPD-pNA (200 μM, dissolved in Me2SO). Plates were incubated at 37 °C, protected from light. Absorbance was then measured using a microplate reader (TECAN Infinite M200) at 405 nm.
Flow cytometry
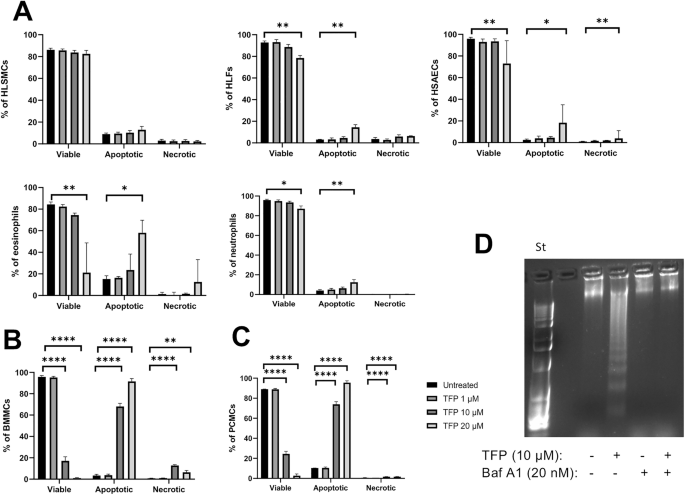
The effect of TFP on cell viability was assessed using Annexin V (AnnV) (BD Biosciences) and DRAQ7 (Abcam) staining. Viable cells were identified as double negative for Annexin V and DRAQ7, apoptotic cells were single positive for Annexin V and necrotic/late apoptotic cells were double positive for Annexin V and DRAQ7. BMMCs were identified based on their forward scatter area (FSC-A) and side scatter area (SSC-A) properties (Fig. S2). Granulocytes were gated by their forward- and side scatter properties. Additionally, eosinophils were identified as CD15+ CD193+(CCR3+), with lower fluorescence intensity of CD15 than in neutrophils. The anti-human antibodies used are described as target (clone)-fluorochrome conjugate, vendor, #catalog number: CD15 (W6D3)-PE (BD Biosciences, #562371), CD193 (5E8)-APC (Biolegend, #310707). The cells were analysed with a BD Accuri C6 plus flow cytometer. For nasal polyp tissue, single-cell suspensions were incubated with the following anti-human antibodies described as target (clone)-fluorochrome conjugate, vendor, #catalog number: CD45 (HI30)-eFluor™ 506 (Invitrogen, #50-112-4954), CD4 (RPA-T4)-BV421 (BD Biosciences, #562424), CD8 (RPA-T8)-BV421 (BD Biosciences, #562428), CD19 (HIB19)-BV421 (BD Biosciences, #562440), CD14 (M5E2)-FITC (BD Pharmingen, #557153), CD117 (104D2)-APC (Invitrogen, #17-1178-42), FcεRI (AER-37)-PE (BD Pharmingen, #556607). Single cell suspensions were stained with the antibody mix and LIVE/DEAD™ Fixable Near IR Dead cell stain kit (Invitrogen) for 30 min at 4 °C in the dark. After washing twice in FACS buffer (PBS with 0.1% BSA and 0.05% NaN3), flow cytometry analysis was performed on a Beckman Coulter Cytoflex S cytometer, and the data analyzed using FlowJo software (Tree Star Inc., Ashland, OR). Nasal polyp MCs, CD14+ monocytes, T- & B lymphocytes were gated as shown in Fig. S3Α.
Measurement of granule and cytosolic pH
Intragranular pH alterations were assessed using LysoSensor Green (LSG) (Thermo Fisher Scientific). LSG is a pH indicator that accumulates in acidic compartments due to protonation. Cytosolic pH was measured using a Fluorometric Intracellular pH Assay Kit BCFL-AM (Sigma-Aldrich) according to the manufacturer’s instructions. This pH probe produces high fluorescence under basic conditions. BMMCs were pretreated with TFP or bafilomycin A1 (20 nM), followed by incubation with either probe. Fluorescence was monitored either by fluorescence microscopy (Nikon ECLIPSE 90i) equipped with NIS-Elements software (Nikon) or flow cytometry using an Accuri flow cytometer; a FITC filter was used to measure granule acidity and cytosolic pH. Data analysis was performed using the FlowJo software.
Cytosolic extract preparation
Cytosolic extracts were prepared using digitonin extraction as previously described [31]. Supernatants (cytosolic extracts) were transferred to new Eppendorf tubes and protein concentration was determined using the Pierce™ BCA Protein Assay kit (Thermo Fisher Scientific). Samples were frozen until further use.
Western blot analysis
Equal protein concentrations of cytosolic extracts (55 μg) were used for Western blot analysis of mouse tryptase (Mcpt6) using an anti-Mcpt6 antiserum (raised in rabbits; in house). Membranes were incubated with primary antibodies overnight and secondary antibody incubation was performed for 1 h. Images were acquired by using the ChemoDoc MP Imaging System (Bio-Rad). To verify consistency of protein concentrations between samples, replicate aliquots were run on a separate SDS-PAGE gel and stained with InstantBlue Coomassie Protein Stain (Expedeon) (Figure S4).
DNA degradation
BMMCs previously treated with TFP and/or bafilomycin A1 were rinsed with ice-cold PBS and lysed (PBS, 0.2% Nonidet P-40, 0.4 mM EDTA, 12 μM pepstatin A, cOmplete™ EDTA-free Protease Inhibitor Cocktail (Roche)) for 14 min at 4 °C. Cells were then centrifuged at 12.000× rpm (4 °C) for 20 min and the supernatant was digested with 0.1 mg/ml RNAse for 1 h at 37 °C. The supernatant was further incubated with proteinase K (20 μg/ml) under the same conditions. Nucleic acids were precipitated by addition of 2-propanol, followed by incubation overnight at –20 °C. The samples were centrifuged at 12.000×rcf (4 °C) for 15 min and the pellets were incubated with ice-cold 70% ethanol for 20 min on ice. Next, samples were centrifuged at 12.000×rcf (4 °C) for 10 min and pellets air-dried for 30 min. Next, samples were resuspended in Tris acetate EDTA (TAE) buffer supplemented with sample buffer (0.25% bromphenol blue, 30% glycerol). Samples were then subjected to electrophoresis on 2% agarose gels at 100 V for 45 min, and for a further 10 min at 120 V. Gels were visualized under UV light after staining with GelRed Nucleic Acid Gel Stain (Biotium).
Staining of BMMCs
BMMCs were centrifuged onto cytospin glass slides (Cytospin, Shandon Southern Instruments, Sewickley, P) and air-dried overnight. The cells were stained with toluidine blue (Sigma-Aldrich) following a standard protocol [49]. Cell morphology was assessed using light microscopy.
Transmission electron microscopy (TEM)
BMMCs were fixed in 2.5% Glutaraldehyde (Ted Pella) and 1% Formaldehyde (Merck) in Phosphate Buffer (PB) (0.1 M, pH 7.4) and stored at 4 °C until further processing. Next, cells were rinsed with PB for 10 min followed by post-fixation in 1% osmium tetroxide (Agar Scientific) for 1 h. Cells were dehydrated in a graded series of ethanol (50%, 70%, 95% and 99.9%) for 10 min and propylene oxide (Agar Scientific) for 5 min. Subsequently, the cells were placed in a mixture of Epon Resin (Agar Scientific) and propylene oxide (1:1) for 1 h, followed by 100% resin and left overnight. Newly prepared Epon resin was added and left for 1–2 h. Next, the Epon resin was polymerized at 60 °C for 48 h. EM UC7 Ultramicrotome (Leica) was used to cut Ultrathin sections (60–70 nm). The sections were placed on a grid and contrasted with 5% uranyl acetate and 3% Reynold’s lead citrate (Science Services). Analysis was performed on a Tecnai™ G2 Spirit BioTwin transmission electron microscope (Thermo Fisher Scientific/FEI) at 80 kV equipped with an ORIUS SC200 CCD camera and Gatan Digital Micrograph software (both from Gatan Inc.).
Statistical analysis and graphs
Data were analysed using the GraphPad Prism 9.3 statistics and graphing software (GraphPad Software). If not indicated otherwise, statistical differences between three or more groups were assessed using one-way ANOVA with Dunnett’s multiple comparison test or when appropriate, non-parametric Kruskal-Wallis test with Dunn’s multiple comparison tests. Comparisons were performed relative to either untreated (control) or TFP-treated MCs as indicated in the figure legends. For comparisons between two groups, unpaired Student’s t-test was used. The results shown are from individual experiments, representative of at least 2 experiments. Statistical significance was set at P < 0.05.