
Enhanced CD8+ T cell proliferation after temporal cell cycle inhibition
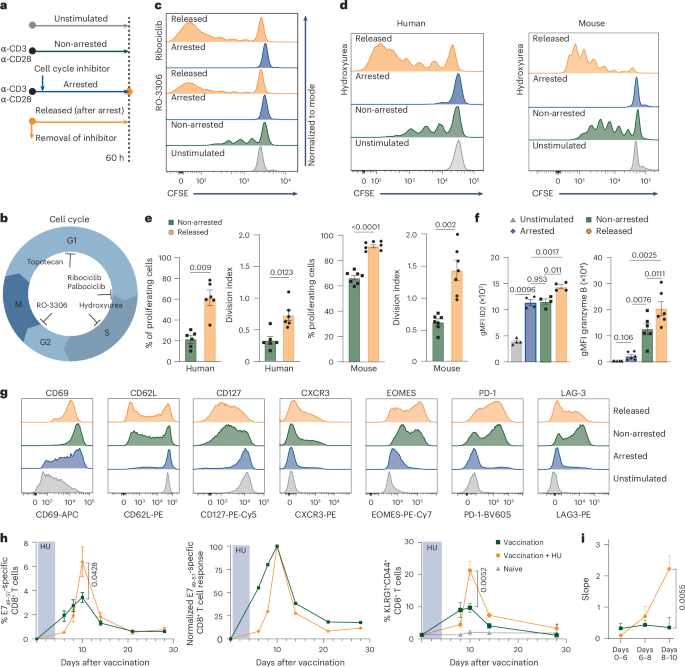
To uncouple CD8+ T cell proliferation from differentiation, we developed a reductionistic assay that allowed strict control of cell cycle progression (Fig. 1a). Human and mouse CD8+ T cells were activated with CD3 and CD28 agonistic antibodies ex vivo to mimic antigenic stimulation. After activation, the CD8+ T cells were allowed to experience normal cell cycle progression (non-arrested setting), or were ‘arrested’ using cell cycle inhibitors that acted in distinct phases of the cell cycle; that is, hydroxyurea (HU), which arrests cells in S phase16, the cyclin-dependent kinase 1 (CDK1) inhibitor RO-3306 (ref. 17), which inhibits G2-to-M progression, the topoisomerase I inhibitor topotecan, which arrests cells in G1 phase18, and the CDK4/CDK6 inhibitors ribociclib and palbociclib, which prevent G1-to-S progression19 (Fig. 1b). As expected, all inhibitors effectively arrested the cell cycle of mouse and human CD8+ T cells after activation (Fig. 1c,d and Extended Data Fig. 1a). Next, cell cycle arrest was terminated by removal of the inhibitor, thereby permitting CD8+ T cells to undergo cell cycle progression after initial blockade (hereafter named ‘released’ CD8+ T cells). Released CD8+ T cells displayed an increase in cell division when compared to non-arrested cells that proliferated the same time, as visualized by cell proliferation tracing dyes and by determining the percentage of dividing cells and calculating the average number of cell divisions (division index) of non-arrested and released conditions (Fig. 1c–e and Extended Data Fig. 1a). Enhanced proliferation of released CD8+ T cells was observed for all tested inhibitors, indicating that this effect was neither drug specific nor restricted to inhibition of a particular phase of the cell cycle. HU consistently provided the best overall CD8+ T cell survival compared to other cell cycle inhibitors (Extended Data Fig. 1b).

a, Experimental setup. Experiments were performed with isolated CD8+ T cells derived from peripheral blood mononuclear cells from healthy donors or from splenocytes of naive mice. b, Schematic overview of cell cycle inhibition with different cell cycle inhibitors. c, Representative proliferation plots of unstimulated human CD8+ T cells, or ex vivo-stimulated human CD8+ T cells that were left untreated (non-arrested), arrested in the cell cycle using RO-3306 or ribociclib (arrested) or released from cell cycle arrest (released). d, Representative proliferation plots of unstimulated and ex vivo-stimulated human and mouse CD8+ T cells under the same conditions as in c, treated with HU. e, Percentage of proliferating cells and division index (mean ± s.e.m.) of ex vivo-stimulated human (n = 8) and mouse (n = 7) CD8+ T cells that were left untreated (non-arrested) or released after HU arrest. f, Expression (geometric mean fluorescence intensity (gMFI) ± s.e.m.) of ID2 (left, n = 4 mice) and granzyme B (right, n = 6 mice) in unstimulated and ex vivo-stimulated mouse CD8+ T cells that were left untreated (non-arrested), arrested with HU or released from HU-induced arrest. g, Representative histograms of CD69, CD62L, CD127, CXCR3, EOMES, PD-1 and LAG-3 expression in ex vivo-stimulated mouse CD8+ T cells treated temporally with HU or left untreated. h, Naive mice were vaccinated with E7 SLP/CpG on day 0 and treated with HU for 4 consecutive days (n = 5) or left untreated (n = 6). Left, percentages of circulating E749–57-specific CD8+ T cells over time (mean ± s.e.m.). Middle, normalized response relative to the peak. Right, percentages of KLRG1+CD44+ CD8+ T cells over time (mean ± s.e.m.). i, Slope of the E749–57-specific CD8+ T cell response depicted in h. Statistical comparisons were performed with two-sided paired t-test (e), repeated-measures analysis of variance (ANOVA) with Sidak’s multiple-comparison test (f) or two-sided unpaired t-test (h and i); P values are shown on the graphs.
The enhanced proliferation after transient arrest suggested altered CD8+ T cell differentiation. Therefore, we examined key effector markers. ID2 expression was induced in both arrested and non-arrested cells and further increased after release (Fig. 1f). Arrested cells initially showed low granzyme B, but upregulated it strongly upon release, exceeding levels in non-arrested cells (Fig. 1f). While CD62L and CD127 were only modestly reduced, arrested cells upregulated CD69 (Fig. 1g and Extended Data Fig. 1c–e). EOMES was induced during arrest and further increased after release, paralleling granzyme B and CXCR3 expression. PD-1 and LAG-3 were moderately upregulated during arrest, with higher expression in non-arrested and released cells (Fig. 1g and Extended Data Fig. 1c,d). Arrested cells also exhibited blast formation, although less prominently than non-arrested or released cells (Extended Data Fig. 1f–h).
We next assessed the impact of temporal cell cycle arrest on CD8+ T cell responses in vivo by vaccinating mice with the HPV16 E743–63 long peptide in combination with HU or topotecan treatment. Although E7-specific CD8+ T cell responses were initially lower in cell cycle inhibitor-treated mice, the peak response exceeded that of untreated vaccinated mice (Fig. 1h, Extended Data Fig. 2a and Supplementary Fig. 1). This reflected a steeper expansion of vaccine-induced CD8⁺ T cells following the blockade (Fig. 1h,i and Extended Data Fig. 2a), suggesting that cell cycle arrest programmed cells for rapid proliferation. The expansion effect was also evident in circulating KLRG1+ CD8+ T cells, marking antigen-reactive effector cells (Fig. 1h and Extended Data Fig. 2a)20. Total CD8+ T cell numbers were unaffected, indicating a specific effect on proliferating antigen-specific cells (Extended Data Fig. 2b). Despite enhanced expansion, CD8+ T cells did not display traits of exhaustion, as PD-1 expression remained unaltered over time (Extended Data Fig. 2c). Together, these data indicate that enforced cell cycle arrest promotes differentiation of CD8+ T cells into effector cells with enhanced proliferative capacity.
Altered metabolism and differentiation during cell cycle arrest
To interrogate the mechanisms underlying enhanced cell cycle progression after temporal cell cycle arrest, we characterized the transcriptional activity in unstimulated, arrested, released and non-arrested CD8+ T cells. Gene expression profiling showed that all four conditions showed distinct transcriptomic profiles, indicated by their segregation in principal component analysis (q < 0.05; Fig. 2a). From the transcriptome dataset, significant differentially expressed genes were selected (q < 0.05) and ingenuity pathway analysis (IPA) was performed to characterize the underlying molecular pathways. Differentially regulated pathways included cell cycle regulation (G1/S checkpoint regulation), cellular metabolism (for example, glycolysis, cholesterol biosynthesis) and T cell-specific differentiation (for example, type 1/2 helper T (TH1/TH2) pathway; Fig. 2b and Extended Data Fig. 3a). Based on these results, we performed gene-set enrichment analysis (GSEA) of Molecular Signatures Database (MSigDB) hallmark gene sets including cell cycle regulation (G2M checkpoint), metabolic pathways (that is, glycolysis, cholesterol biosynthesis, oxidative phosphorylation, fatty acid metabolism) and signaling pathways (IL-2–STAT5, MTORC1, PI3–AKT–MTOR signaling; Fig. 2c,d and Extended Data Fig. 3b,c). The metabolism-related gene sets were particularly upregulated in released CD8+ T cells, indicating that released cells adjusted their cellular metabolism.

Transcriptomic analysis of unstimulated mouse CD8+ T cells, or ex vivo-stimulated mouse CD8+ T cells that were left untreated (non-arrested), arrested in the cell cycle using HU or released from HU-induced arrest (released; n = 4). a, Three-dimensional principal component analysis plot. b, IPA of differentially expressed genes (FDR < 0.05) comparing arrested to released cells. The top five significantly enriched pathways with the most positive and negative z-scores are shown. Statistical analysis was performed using two-sided unpaired t-test with Benjamini–Hochberg correction. c, Normalized enrichment scores (NES) of eight selected mouse hallmark gene sets (from MSigDB; FDR < 0.05) based on GSEA. d, GSEA enrichment plots after GSEA analysis of the same hallmark gene sets. Genes are ranked on the x axis by log2(fold change) in expression between released and non-arrested cells. Vertical bars represent individual genes within each gene set; the enrichment score is plotted on the y axis. e, Heat maps of differentially expressed genes associated with glycolysis (left) and the PI3K–AKT–mTOR-pathway (continued in Extended Data Fig. 3d). Each row represents an individual sample.
We next profiled individual differentially expressed genes. Notably, arrested CD8+ T cells already exhibited enhanced expression of glycolysis-related and cholesterol biosynthesis-related genes compared to unstimulated cells (Fig. 2e and Extended Data Fig. 3d), indicating activation of glucose metabolism and cholesterol biosynthesis despite their non-proliferative state. In addition, transcription of glycolysis-related genes, such as Pkm, Aldoa and Mtor, and certain cholesterol synthesis-related genes, such as Fdft1, Fdps and Mvd was increased in released CD8+ T cells compared to non-arrested and arrested cells (Fig. 2e and Extended Data Fig. 3d). Transcripts of genes implicated in PI3K–AKT–mTOR signaling were also increased in arrested CD8+ T cells compared to unstimulated conditions, and many of these genes elevated to higher levels in released cells compared to non-arrested cells (Fig. 2e and Extended Data Fig. 3d). Correspondingly, expression levels of genes from the mitogen-activated protein kinase (MAPK)–c-MYC pathway, a pathway interconnected with both mTOR signaling21 and regulation of glucose metabolism22, were elevated in released cells as well (for example, Map2k1, Map2k2, Mapk3 and Myc; Extended Data Fig. 3d).
We next examined TH1/TH2-related transcripts. Il2ra, Il2rb, Ccr4 and Ccr5 were upregulated in arrested CD8+ T cells relative to unstimulated cells, indicating induction of a differentiation program during arrest. Expression of these transcripts further increased in non-arrested and released cells (Extended Data Fig. 3d). Il2 mRNA was highest in arrested cells, whereas Runx3 and Havcr2 (Tim3) were most highly expressed in released cells, consistent with more advanced effector differentiation. The DNA damage response (DDR) pathway was not differentially regulated, reflecting the absence of key DDR transcripts in either arrested or released cells (Extended Data Fig. 4). Together, these data indicate that temporal cell cycle inhibition of activated CD8+ T cells enhances expression of genes involved in glycolysis, cholesterol biosynthesis and effector differentiation.
To assess whether the transcriptional programs of the arrested and released CD8+ T cells resemble those of resting and reactivated memory CD8+ T cells, we compared our mRNA-sequencing dataset to a recently published dataset profiling lymph node and tissue-resident memory CD8+ T cells in both resting and reactivated states23. Using the same EdgeR pipeline (false discovery rate (FDR) < 0.05), we identified 1,519 overlapping differentially expressed genes (Extended Data Fig. 5). While certain genes were similarly upregulated (such as Il2) or downregulated in both arrested and reactivated cells, many changes, including those in glycolytic and effector genes (Pkm, Aldoa, Pgam1, Gapdh, Eno1, Gzmb), were shared between the released and reactivated conditions. These findings indicate that arrested CD8+ T cells largely mirror the transcriptional profile of resting memory T cells, whereas released CD8+ T cells acquire gene expression patterns characteristic of reactivated memory T cells, suggesting that memory-like features including reactivation properties are already imprinted during the arrested state.
Arrested CD8+ T cells stockpile nutrients and increase glycolysis
To complement the transcriptomic analysis and further define metabolic adaptations induced by cell cycle inhibition and release, we performed intracellular metabolite profiling of CD8+ T cells by mass spectrometry. Arrested CD8+ T cells showed elevated levels of hexose (including glucose) and several amino acids, such as glutamine and aspartate (Fig. 3a), indicating active nutrient accumulation during arrest. Released CD8+ T cells also exhibited increased hexose levels, but their amino acid levels were reduced compared to non-arrested cells (Fig. 3a).

a, Heat map of differentially expressed metabolites extracted from unstimulated human CD8+ T cells, or ex vivo-stimulated human CD8+ T cells or ex vivo-stimulated mouse CD8+ T cells that were left untreated (non-arrested), cell cycle-arrested with HU (arrested) or released from HU-induced arrest (released; n = 3 donors). z-scores are color coded. b,c, Representative histograms (b) and gMFI (± s.e.m.; c) of PKM (n = 7), GLUT1 (n = 4), 2-NBDG (n = 4) and G6PD (n = 4) expression in unstimulated and ex vivo-stimulated human CD8+ T cells (HU arrested, non-arrested and released from HU arrest). Each symbol represents one healthy donor (n = 4). d, Heat map of CD98, G6PD and PKM expression in E749–57-specific CD8+ T cells at day 7 after E7 SLP/CpG vaccination in the blood and lymph nodes (LNs) of mice treated with HU on days 1–4. Geometric mean is color coded, and marker-specific ranges are indicated (n = 6 mice per group). e, gMFI (± s.e.m.) of GLUT1 on circulating E749–57-specific CD8+ T cells at day 7 after vaccination (n = 8 mice per group). f, Glycogen levels (mean ± s.e.m.) in unstimulated, and ex vivo-stimulated human CD8+ T cells (HU-arrested, non-arrested and released from HU arrest; n = 4 donors). g, Glycogen levels (mean ± s.e.m.) in HU-arrested human CD8+ T cells treated with WZB117 (n = 4 donors). h, Percentage of proliferating ex vivo-stimulated human CD8+ T cells (mean ± s.e.m.; n = 4 donors) that were either HU-arrested and subsequently released or left untreated (non-arrested), and the same conditions in which CP91149 was added during arrest or proliferation. i, Percentage of proliferating non-arrested and HU-released human CD8+ T cells (mean ± s.e.m., n = 5 donors) treated with WZB117. Statistical comparisons were performed using repeated-measures ANOVA with Sidak’s multiple-comparisons test (c, f and h) and two-sided unpaired (e) and paired (g and i) t-tests; P values are shown on the graphs.
The differences in intracellular glucose and amino acid levels prompted us to examine the underlying metabolic pathways. To link these changes to functional adaptations, we selected key nutrient transporters and metabolic enzymes for single-cell validation by spectral flow cytometry, focusing on molecules involved in amino acid uptake, glycolysis and the pentose phosphate pathway24,25. Expression of the amino acid transporter CD98 was upregulated in arrested cells and remained elevated in non-arrested and released cells, suggesting that arrested cells acquired the ability to take up and stockpile amino acids by upregulating transporter expression (Extended Data Fig. 6a,b). Expression of the glucose transporter GLUT1 was also upregulated in arrested cells, but further increased upon release, indicating enhancement of glucose metabolism. These higher levels coincided with the increased levels of PKM and ALDOA, key enzymes in glycolysis, and with enhanced uptake of the glucose analog 2-NBDG, and increased G6PD, the rate-limiting enzyme of the pentose phosphate pathway (Fig. 3b,c and Extended Data Fig. 6c). Notably, released cells exhibited the highest levels of GLUT1, PKM, ALDOA, G6PD and 2-NBDG uptake exceeding those of non-arrested cells, indicating superior glucose metabolic activity following release from arrest.
Increased PKM expression was specifically observed during the early S phase in HU-arrested cells, which displayed only low DNA content as determined by FxCycle staining (Extended Data Fig. 6d). Because HU blocks progression beyond the S phase, no cells advanced into G2/M under arrested conditions. Upon release from HU, however, cells progressed through the cell cycle and displayed elevated PKM levels in both early and late S phases as well as in G2/M. Notably, PKM expression remained low in the G0/G1 phase across arrested, non-arrested and released conditions, highlighting a cell cycle-linked regulation of PKM that is associated with DNA replication and mitotic entry. Consistent with our ex vivo findings, expression of CD98, G6PD, PKM and GLUT1 was enhanced in vaccine-elicited CD8+ T cells residing in blood and lymph nodes following transient cell cycle inhibition with either HU or palbociclib (Fig. 3d,e and Extended Data Fig. 6e).
As arrested cells do not undergo energy-intensive cell cycle progression yet continue to take up glucose, we interrogated whether glucose was stockpiled as glycogen rather than used for energy26. While unstimulated cells negligibly stored glycogen, arrested CD8+ T cells accumulated glycogen (Fig. 3f). This accumulation depended on glucose uptake, as GLUT1 inhibition with WZB117 prevented glycogen storage during arrest (Fig. 3g). Although non-arrested CD8+ T cells also stored glucose, released cells rapidly depleted their glycogen stores (Fig. 3f), consistent with their elevated proliferation and increased glycolytic activity. Restraining glycogen breakdown by selective inhibition of glycogen phosphorylase27 using CP91149 impaired proliferation in a dose-dependent manner, indicating that cell-intrinsic glycogenolysis and glycolytic activity supports proliferation following transient cell cycle arrest (Fig. 3h). In line with this, WZB117 reduced proliferation of both non-arrested and released cells, underscoring the critical role of glucose metabolism to support proliferation (Fig. 3i). Notably, a shorter period of cell cycle arrest (12 h), permitting less time for stockpiling nutrients such as glucose, enhanced proliferation upon release but to a lesser extent (as compared to 60 h), highlighting the functional relevance of metabolic preconditioning during arrest (Extended Data Fig. 6f).
Next, we investigated the impact of cell cycle arrest on energy production in the tricarboxylic acid (TCA) cycle in mitochondria by assessing levels of SDHA and ATP5a, and mitochondrial reactive oxygen species (by MitoSOX). Despite being non-proliferative, the activity of the TCA cycle and mitochondria increased in arrested CD8+ T cells. Compared to non-arrested cells, released cells displayed no substantial alterations in expression of the TCA cycle-related enzymes, but mitochondrial reactive oxygen species was further enhanced, indicating increased mitochondrial activity (Fig. 4a,b).

a,b, Representative histograms (a) and gMFI (± s.e.m.; b) of SDHA (n = 7 donors), ATP5a (n = 4 donors) and MitoSox Red (n = 4 donors) in unstimulated human CD8+ T cells or ex vivo-stimulated human CD8+ T cells that were left untreated (non-arrested), cell cycle-arrested with HU (arrested) or released from HU-induced arrest (released). c,d, Representative histograms (c) and gMFI (± s.e.m.; d) of CPT1a (n = 7 donors) and FDFT1 (n = 5 donors) under the same conditions. FDFT1 gMFI is indicated as fold change relative to unstimulated cells. e, Percentage (mean ± s.e.m.) of proliferating human CD8+ T cells that were ex vivo-stimulated (non-arrested and released after HU arrest) and treated with zaragozic acid (left graph, n = 5) or atorvastatin (right graph, n = 6) during proliferation to inhibit cholesterol biosynthesis. Lines indicate individual donors. Statistical comparisons were performed using repeated-measures ANOVA with Sidak’s multiple comparisons (b and d) and two-sided paired t-test (e); P values are shown on the graphs.
Based on our transcriptomic analysis, we next examined fatty acid metabolism and cholesterol biosynthesis. Fatty acid metabolism is linked to T cell differentiation and long-term function, whereas cholesterol biosynthesis is critical for proliferating CD8+ T cells by supporting membrane biogenesis and signaling28. BODIPY-labeled FL-C16 staining was similar between unstimulated and arrested cells (Extended Data Fig. 6g,h), suggesting no difference in uptake of palmitate fatty acids. However, arrested cells showed signs of enhanced fatty acid processing capacity compared to unstimulated cells, as CPT1a, an essential enzyme for beta oxidation of long-chain fatty acids, was increased and further elevated upon release (Fig. 4c,d). Consistent with the transcriptomic data, arrested CD8+ T cells also upregulated FDFT1 (squalene synthase), a key enzyme in cholesterol biosynthesis, both ex vivo and in vivo (Fig. 4c–e and Extended Data Fig. 6i). FDFT1 expression was further increased in released CD8+ T cells and exceeded levels observed in non-arrested cells. Restricting FDFT1 using zaragozic acid impaired the proliferation of non-arrested cells but not of released cells, which may be related to their higher FDFT1 levels (Fig. 4e). Inhibition of the rate-limiting enzyme HMG-CoA reductase with atorvastatin suppressed proliferation in both non-arrested cells and released CD8+ T cells (Fig. 4e).
Together, these data show that cell cycle-arrested CD8+ T cells display enhanced cholesterol metabolism, elevated glucose metabolism, increased mitochondrial activity and greater TCA cycle engagement. Moreover, when given sufficient time to accumulate nutrients during arrest, these cells become metabolically primed for enhanced proliferation upon release.
CD8+ T cell proliferation after cell cycle inhibition is partially mTOR independent
We next investigated the molecular mechanisms driving glucose metabolism in CD8+ T cells during temporal cell cycle arrest. Phosphoproteomic analysis of released and non-arrested human CD8+ T cells revealed clusters of phosphorylation sites linked to activated glycolysis, transcription factors, FOXK1 and FOXK2, which regulate glycolysis-related genes29, and activation of MAPK–c-MYC and JAK–STAT signaling (Fig. 5a). Consistent with the transcriptome data, DDR-associated phosphosites were detectable but did not exhibit the characteristic phosphorylation pattern indicative of DNA damage or replication stress, such as activation of core DDR proteins including ATM, ATR, PRKDC and CHEK1/CHEK2 and components of the FANC pathway (Extended Data Fig. 7a). Kinase phosphosite analysis revealed a coordinated cell cycle progression pattern concurrent with enhanced phosphorylation of multiple cell cycle-regulatory kinases (Extended Data Fig. 7b).

a, Heat map of hierarchical clustered z-scored phosphosite intensities measured by mass spectrometry in ex vivo-stimulated human CD8+ T cells that were either released from HU-induced arrest or left untreated (non-arrested; n = 3 donors). Coupled z-scores are based on normalized phosphosite intensities. The number of phospho groups per site is indicated in parentheses (3P indicates three or more phospho groups). b, Immunoblot of unstimulated human CD8+ T cells or ex vivo-stimulated human CD8+ T cells that were left untreated (non-arrested), cell cycle-arrested with HU (arrested) or released from HU-induced arrest (released). FOXK1 expression was assessed in the cytosolic (C) and nuclear (N) fractions. H3K9me3 was used as the loading control. c,d, Representative histograms (c) and gMFI (± s.e.m.; d) of phosphorylated S6 (pS6) in unstimulated and ex vivo-stimulated human CD8+ T cells (HU-arrested, non-arrested and released from HU arrest; n = 8). e, Representative CellTrace Violet plots of ex vivo-stimulated (non-arrested and released from HU arrest) CD8+ T cells derived from wild-type (WT) and mTORC1-deficient (Raptor−/−) mice. f, Percentage of proliferating ex vivo-stimulated CD8+ T cells (mean ± s.e.m.) from WT (n = 3) and Raptor−/− (n = 5) mice that were non-arrested or released from HU arrest. g, PKM expression (gMFI ± s.e.m.) in ex vivo-stimulated CD8+ T cells from WT and Raptor−/− mice (n = 4) under the same conditions as in f. h, Percentage of proliferating ex vivo-stimulated mouse and human CD8+ T cells (mean ± s.e.m.) that were either released from HU arrest (released) or non-arrested, and treated with rapamycin either only during proliferation or during both HU arrest and release. Lines indicate individual mice or donors (n = 4). Statistical comparisons were performed using repeated-measures ANOVA with Sidak’s multiple comparisons (d, f, g and h); P values are shown on the graphs. FC, fold change.
Source data
To evaluate directly whether transient cell cycle inhibition induces DNA damage, we assessed γ-H2AX expression, a marker of DNA double-strand breaks, in CD8+ T cells30. HU-arrested cells showed elevated γ-H2AX at 60 h, consistent with replication of stress-associated DNA damage caused by stalled replication forks31, an effect that is exacerbated by prolonged HU exposure. Upon release from HU, γ-H2AX levels were reduced, likely reflecting DNA repair. In contrast, treatment with palbociclib or ribociclib did not induce detectable DNA damage, and released cells exhibited only a modest increase in γ-H2AX expression (Extended Data Fig. 8a,b). Non-arrested cells displayed low γ-H2AX expression at 24 h, which increased after 60 h of stimulation, consistent with replication-associated stress during continuous proliferation. Together, these data show that transient cell cycle inhibition and subsequent release do not cause substantial or lasting DNA damage.
FOXK1 and FOXK2 were differentially phosphorylated in released and non-arrested cells (Fig. 5a). Phosphorylation of FOXK1 at the C-terminal sites Ser441, Thr436, Ser445, Ser472 and Ser416 was observed in released cells, while non-arrested cells showed phosphorylation of the N-terminal sites Ser213 and Ser223. In accordance with the enhanced glycolytic state, FOXK1 nuclear translocation was increased in arrested and released CD8+ T cells compared to non-arrested (Fig. 5b).
The nutrient-sensitive mammalian target of rapamycin complex 1 (mTORC1) signaling pathway is important for the translocation of FOXK1/FOXK2 (ref. 32). To determine the role of this pathway, we assessed the activity of mTOR by measuring the phosphorylation of the downstream target ribosomal protein S6 (ref. 33; RPS6, S6). Arrested cells showed activation of mTOR by increased levels of pS6 compared to unstimulated cells (Fig. 5c,d). Released cells, however, showed decreased levels of pS6 compared to non-arrested cells (Fig. 5c,d), a finding in agreement with the decreased RPS6 phosphorylation at Ser205 (Fig. 5a). Kinetic analysis showed that non-arrested cells remained high in pS6 levels (up to at least 120 h after stimulation), while after cell cycle arrest the released cells showed decreased levels, already noticeable 24 h after release (Extended Data Fig. 8c).
To investigate mTORC1 directly, we used CD8+ T cells lacking Raptor, a binding protein of mTORC1 and critical for its activity, obtained from CD8-Cre-Rptor (Raptor) mice. While non-arrested Raptor-deficient CD8+ T cells were substantially blocked in their proliferation, released Raptor-deficient CD8+ T cells still proliferated considerably (Fig. 5e,f). Notably, released Raptor-deficient CD8+ T cells showed higher PKM expression as non-arrested Raptor-deficient cells, indicating that after cell cycle blockade CD8+ T cells maintain a high glycolytic activity independent of mTOR signaling (Fig. 5g). Decreased mTORC1 dependency was further evident when CD8+ T cells were treated with the mTOR inhibitor rapamycin during proliferation. Proliferation of released mouse and human CD8+ T cells was modestly reduced (1.5-fold and 1.2-fold, respectively), whereas non-arrested cells were more sensitive to mTOR inhibition, showing 3.4-fold and 7.8-fold reductions, respectively (Fig. 5h). Rapamycin treatment during both arrest and release still allowed proliferation of mouse and human CD8+ T cells, with only 2.3-fold and 1.8-fold reductions, respectively. These results indicate that, while mTOR is critical for proliferation of non-arrested cells, released CD8+ T cells are only partially mTOR dependent, suggesting activation of alternative pathways driving cell cycle progression after transient arrest.
IL-2-mediated cell cycle progression after cell cycle arrest
To identify pathways that could potentially bypass the mTORC1 pathway, we investigated the role of the activated MAPK–c-MYC pathway, known to be implicated in the induction of T cell proliferation and glycolysis34. Our transcriptomic analysis showed enhanced expression of genes of the MAPK pathway, including Myc, in released cells compared to non-arrested cells (Extended Data Fig. 3d). Moreover, the phosphoproteomics analysis confirmed that MAPK–c-MYC signaling is more activated in released CD8+ T cells compared to non-arrested cells (Extended Data Fig. 8d). MYC inhibition during proliferation, however, only partially inhibited the proliferation (1.2-fold) of released CD8+ T cells (Extended Data Fig. 8e), indicating involvement of MYC-driven and MYC-independent pathways.
The partial mTORC1 and MYC independence of released cells to proliferate prompted us to assess the role of IL-2, given its importance for CD8+ T proliferation2,4, and signaling capacity via the alternate STAT5–PI3K pathway35. Consistent with our transcriptomic data, the percentage of IL-2-producing cells was increased in cell cycle-arrested CD8+ T cells as compared to unstimulated and non-arrested cells (Fig. 6a and Extended Data Fig. 9a). Moreover, the IL-2 production on a per-cell basis was enhanced in arrested cells (Fig. 6b), which coincided with high amounts of IL-2 in the supernatant (Fig. 6c and Extended Data Fig. 9b). Arrested cells also produced more IL-2 compared to released cells, indicating that IL-2 is consumed during proliferation, with production returning to levels comparable to those in non-arrested CD8+ T cells (Fig. 6a–c and Extended Data Fig. 9a,b). To corroborate these findings, we tracked IL-2 expression in CD8+ T cells from IL-2GFP reporter mice. Cell cycle arrest ex vivo led to an increased frequency of GFPhi CD8+ T cells compared to non-arrested settings, and this percentage decreased upon release from arrest (Fig. 6d,e). To determine whether the enhanced IL-2 production observed during ex vivo cell cycle arrest also occurred in vivo, we vaccinated IL-2GFP reporter mice with E7 peptide in the presence or absence of HU treatment. IL-2GFP expression was markedly increased in E7-specific CD8+ T cells during HU treatment compared to their counterparts in untreated mice or after HU withdrawal (Fig. 6f), confirming our ex vivo findings. The frequency of IFNγ-producing CD8+ T cells also increased during arrest but remained lower than in non-arrested or released CD8+ T cells (Extended Data Fig. 9c). A substantial fraction of IL-2-producing CD8+ T cells coexpressed TNF (Extended Data Fig. 9d,e), indicating enhanced cytokine polyfunctionality, which together with elevated autocrine IL-2 levels on a per-cell basis are hallmarks of memory T cells with superior expansion potential2.

a, Percentage of IL-2-producing cells (mean ± s.e.m.) among unstimulated IFNγ+ mouse CD8+ T cells, or ex vivo-stimulated IFNγ+ mouse CD8+ T cells that were left untreated (non-arrested), arrested in the cell cycle using HU or released from HU-induced arrest (n = 5 mice). b, gMFI (± s.e.m.) of IL-2 in IL-2+IFNγ+ mouse CD8+ T cells under the same conditions as in a (n = 5 mice). c, IL-2 concentration (mean ± s.e.m.) in supernatants of unstimulated mouse CD8+ T cells, or ex vivo-stimulated mouse CD8+ T cells that were non-arrested, HU-arrested or released from HU-induced arrest (n = 5 mice). d, Representative flow cytometry plots of ex vivo-stimulated IL-2GFP+ CD8+ T cells from IL-2GFP reporter mice under ex vivo-stimulated conditions (HU-arrested, non-arrested and released). e, Percentage of IL-2GFP+ CD8+ T cells (mean ± s.e.m.) under the same conditions as in d and in unstimulated conditions (n = 3 mice). f, IL-2GFP reporter mice were vaccinated with E7 SLP/CpG and treated with HU for 4 consecutive days (days 1–4). IL-2GFP expression (gMFI ± s.e.m.) was measured in E749–57-specific CD8+ T cells from spleens at days 5 and 8 after vaccination (n = 3 mice). g, Representative histograms of CD25 expression in mouse and human CD8+ T cells that were unstimulated or ex vivo-stimulated and non-arrested, HU-arrested or released. h, Representative flow cytometry plots of CellTrace Violet versus CD25 expression of HU-arrested, non-arrested and released mouse and human CD8+ T cells ex vivo. i, Representative CellTrace Violet plots of mouse CD8+ T cells under the same conditions as in g, with IL-2-neutralizing antibodies (S4B6 and JES6.1) added during proliferation. j, Percentage of proliferating CD8+ T cells (mean ± s.e.m.) from WT and IL-2fl/fl mice that were ex vivo stimulated and released from HU arrest. IL-2 was supplemented during proliferation (n = 5 WT mice, n = 4 IL-2fl/fl mice). k, pSTAT5 levels (gMFI ± s.e.m.) in mouse CD8+ T cells under the same conditions as in i (n = 5 mice). l, Percentage of proliferating cells (left) and CD25 expression (right; gMFI ± s.e.m.) of ex vivo-stimulated human CD8+ T cells (non-arrested and HU-released) with or without addition of STAT5-IN-1 supplemented during proliferation (n = 3 donors). Statistical comparisons were determined by repeated-measures ANOVA with Sidak’s multiple comparisons (a–c, e, f, j and k); P values are shown on the graphs.
Consistent with enhanced IL-2 transcription, expression of cREL, a key IL-2-regulating transcription factor36, was substantially increased in arrested cells compared to unstimulated cells, and remained higher compared to non-arrested and released cells (Extended Data Fig. 9f). NFAT, another critical regulator of IL-2 expression37, was also increased in arrested cells compared to unstimulated cells, but its expression was comparable to non-arrested cells and lower than in released cells (Extended Data Fig. 9f).
Next, we assessed the capacity of CD8+ T cells to respond to IL-2 by examining expression of the high-affinity IL-2 receptor CD25 (IL-2Rα). Notably, a substantial fraction of the arrested cells already showed expression of CD25, indicating that IL-2 responsiveness is established during arrest (Fig. 6g,h and Extended Data Fig. 9g). While CD25 expression on non-arrested cells increased with each cell division, the faster-cycling released cells started to down-modulate CD25 proliferation, and this down-modulation was profoundly evident for human CD8+ T cells (Fig. 6g,h).
We then examined the extent to which enhanced IL-2 production and signaling contribute to the increased proliferation observed in released CD8+ T cells. Abrogation of IL-2 signaling with neutralizing antibodies (S4B6 and JES6.1) inhibited proliferation in both released and non-arrested CD8+ T cells (Fig. 6i), indicating a requirement for IL-2-driven proliferation. Furthermore, IL-2-deficient CD8+ T cells showed limited proliferation upon release, which was restored by exogenous IL-2 supplementation (Fig. 6j). IL-2 downstream signaling as determined by quantification of phosphorylated STAT5 (pSTAT5) levels was already induced in arrested CD8+ T cells compared to nonresponding unstimulated cells (Fig. 6k). pSTAT5 levels further increased during release in an IL-2-dependent manner to levels exceeding those in the non-arrested cells, indicating that IL-2 downstream signaling is increased after cell cycle blockade (Fig. 6k). Pharmacological inhibition of IL-2 signaling by STAT5-IN-1, a potent and selective STAT5 inhibitor (IC50 47 µM) at a concentration of 50 µM or 100 µM, resulted in stronger inhibition of non-arrested than released mouse and human CD8+ T cells (Fig. 6l and Extended Data Fig. 9h–j). These data indicate that while both cell populations rely on IL-2 signaling, released CD8+ T cells exhibit stronger IL-2 signaling. Collectively, these findings demonstrate that cell cycle-arrested CD8+ T cells produce elevated levels of IL-2, both ex vivo and in vivo, leading to enhanced downstream IL-2 signaling and supporting of IL-2-dependent proliferation upon release from arrest.
Temporal cell cycle blockade improves immunotherapy
To evaluate the potential therapeutic relevance of our findings, we assessed the impact of transient cell cycle arrest in the immunogenic MC-38 tumor model. HU treatment induced increased expression of GLUT1, PKM, G6PD and CD98 in blood-circulating memory/effector CD8+ T cells of MC-38 tumor-bearing mice (Fig. 7a–c). Phenotypically, these cells exhibited high KLRG1 and CD431B11 expression (Extended Data Fig. 10a,b), and these cells were also increased in the tumor, which is shown to correlate with improved tumor control38 (Fig. 7d).

a,b, Uniform manifold approximation and projection (UMAP) analysis of blood CD44+CD8+ T cells from untreated (n = 8) and HU-treated (day 4–7, n = 15) MC-38 tumor-bearing mice (day 11 after challenge). After downsampling to 40,000 cells per group, UMAP embedding was performed. a, Contour plots (blue indicates low density; red indicates high density). b, Expression overlays of CD98, GLUT1, PKM and G6PD. c, Expression levels (mean ± s.e.m.) of CD98, GLUT1, PKM and G6PD in blood-derived KLRG1+CD8+ T cells from untreated (n = 8) and HU-treated (days 4–7, n = 15) MC-38 tumor-bearing mice on day 7 and 11 after tumor challenge. d, Frequency (mean ± s.e.m.) of intratumoral KLRG1+CD431B11+ CD8+ T cells in untreated (n = 5) and HU-treated (days 4–7, n = 6) MC-38 tumor-bearing mice at day 15 after tumor challenge. e, Percentage (mean ± s.e.m.) of M8-specific CD8+ T cells (left) and Ki-67 expression (gMFI, right) in blood from untreated and HU-treated (days 4–7) MC-38 tumor-bearing mice (n = 5). f, Heat map of metabolic markers and Ki-67 in M8-specific CD8+ T cells from lymph nodes of untreated (n = 5) and HU-treated (days 4–7, n = 6) MC-38 tumor-bearing mice. Color scale reflects geometric mean expression; individual marker ranges are indicated. g–i, GLUT1 expression in human tumor biopsy samples. g, Clinical treatment scheme. h, Representative image illustrating multiplex immunofluorescence post-treatment samples (CD8, blue; CD3, red; keratin, green; GLUT1, yellow). i, Quantification of GLUT+CD8+ T cells (as a percentage of total CD8+ T cells) in paired baseline (letrozole) tumor biopsy samples and post-ribociclib surgical resections, collected 3–12 days after the last ribociclib dose. Individual participants are connected by lines. Box plots show the median (center) and 25th–75th percentiles (box), whiskers extend to the minimum/maximum values, and all individual points are displayed (n = 11). j, Tumor volume (mean ± s.e.m.) over time in EG7 tumor-bearing mice receiving untreated or HU-pretreated OT-I cells, followed by vaccination with OVA SLP/CpG one day after transfer (untreated, n = 8; OT-I groups, n = 11). k, Kaplan–Meier survival plot of MC-38 tumor-bearing mice left untreated (n = 18), treated with HU (days 4–7; n = 22), treated with αPD-L1 (day 10/14/17; n = 9) or treated with a combination of HU and αPD-L1 (n = 10). l, Top, schematic of TC-1 tumor challenge with therapeutic vaccination and HU. Bottom, Kaplan–Meier survival plot of TC-1 tumor-bearing mice either untreated (n = 6) or treated with E7 SLP/CpG (n = 8), HU (n = 7) or both (n = 7 per group). Statistical analysis included a two-sided unpaired t-test (c–e), two-sided paired t-test (h), Kruskal–Wallis and Dunn’s multiple-comparisons test (j) and log-rank Mantel-Cox test (k and l); P values are shown on the graphs. TILs, tumor-infiltrating lymphocytes.
Tumor-specific CD8+ T cell responses, detected by reactivity to the MuLV p15E (M8) tumor antigen using major histocompatibility complex class I tetramers, increased to higher levels over time in the blood of HU-treated mice compared to non-treated mice (Fig. 7a,e). During arrest, these tumor-specific CD8+ T cells exhibited a Ki-67lo profile, but Ki-67 expression rapidly increased upon HU withdrawal, and this correlated with increased GLUT1, PKM, G6PD and CD98 expression (Fig. 7a,e and Extended Data Fig. 10a). A similar increase in Ki-67hi CD8+ T cells was observed in the lymph nodes after treatment (Fig. 7f). Furthermore, metabolic profiling of M8-specific CD8+ T cells in the lymph nodes revealed enhanced glucose uptake (GLUT1), glucose metabolism (PKM, G6PD) and cholesterol biosynthesis (FDFT1) after HU treatment compared to M8-specific CD8+ T cells of untreated mice (Fig. 7f).
Next, we evaluated whether transient cell cycle blockade affects CD8+ T cell metabolism in a clinical setting39. In biopsy samples from individuals with stage II/III breast cancer, the frequency of GLUT1-expressing CD8+ T cells increased in the majority of individuals following intermittent ribociclib treatment compared to baseline levels during letrozole monotherapy (Fig. 7g–i). To further explore therapeutic implications, we assessed the impact of transient cell cycle arrest across multiple in vivo immunotherapy models, including adoptive T cell transfer, immune checkpoint blockade and therapeutic vaccination.
To assess efficacy of transient cell cycle arrest in the context of adoptive T cell transfer, we transferred ex vivo HU-treated or untreated OT-I cells into EG7 tumor-bearing mice. While mice that did not receive OT-I cells succumbed to tumor challenge, transfer of untreated OT-I cells delayed tumor outgrowth. Notably, transfer of OT-I cells treated with HU ex vivo (60 h before transfer) resulted in complete EG7 tumor regression (Fig. 7j).
In the MC-38 model, provision of HU in vivo delayed tumor progression in a CD8+ T cell-dependent manner (Fig. 7k and Extended Data Fig. 10c). Furthermore, combining transient HU treatment with αPD-L1 immune checkpoint blockade led to greater inhibition of MC-38 tumor growth and prolonged survival compared to either treatment alone (Fig. 7k and Extended Data Fig. 10d). Lastly, we assessed whether transient cell cycle blockade could enhance therapeutic vaccination. Administration of HPV E7 peptide vaccines together with HU treatment substantially improved survival in tumor-bearing mice, suggesting that transient cell cycle arrest augments the antitumor capacity of vaccine-elicited CD8+ T cells (Fig. 7l).