
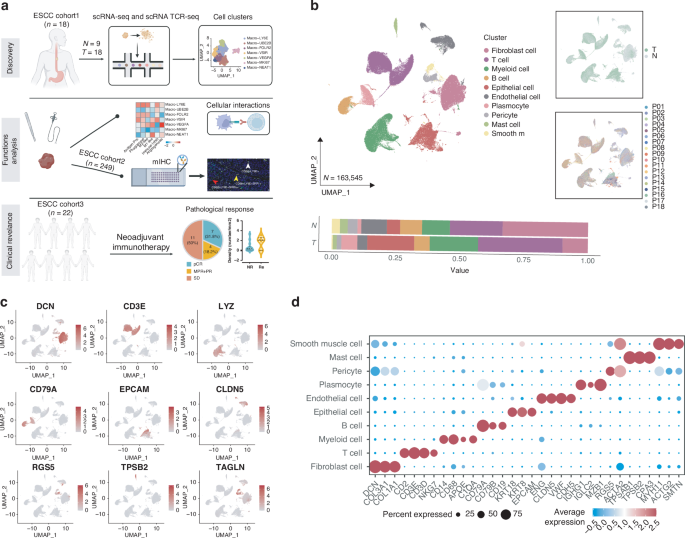
Generation of the ESCC single-cell transcriptomic atlas
To characterize the TME in ESCC, we performed scRNA-seq of 18 ESCC tumor tissues and 9 adjacent normal tissues (>3 cm apart) collected from our 18-patients cohort (Fig. 1a and Supplementary Table 1). After filtering to exclude dead cells and doublets, scRNA-seq data from a total of 163,545 live single cells were analyzed. UMAP plots were constructed of the cell clusters annotated with marker genes and the cells were classified into 10 clusters: fibroblasts (DCN, COL3A1, and COL1A1 positive), T cells (CD2, CD3D, and CD3E positive), myeloid cells (CD68, CD14, APOE, and C1QA positive), B cells (CD19, CD79A, and CD79B positive), epithelial cells (EPCAM, KRT8, and KRT18 positive), endothelial cells (VWF, CDH5, and CLDN5 positive), plasmocytes (MZB1, IGHG1, and IGLC2 positive), pericytes (RGS5 and ACTA2 positive), mast cells (TPSAB1, TPSB2, CPA3, and CTSG positive), and smooth muscle cells (MYH11, ACTG2, and SMTN positive) (Fig. 1b–d).

a Schematic overview of the experimental design. b UMAP plot of various cell subpopulations in 27 ESCC tissue samples identified by scRNA-seq. Lower panels show the proportions of each subpopulation in tumor (T) and adjacent normal (N) esophageal tissues, right panels show UMAP plot containing various tissues or samples. c UMAP plots showing marker gene expression of the cell subclusters. d Dotplot of the top differentially expressed genes in the indicated cell subpopulations.
Identification of LY6E+ macrophages in human ESCC
The heterogeneity of TAMs plays a vital role in tumor progression and treatment response. It is essential that TAMs subpopulations are carefully identified and characterized. Herein, a total of 14,524 macrophages were identified and further divided into 7 subclusters. All the clusters were detected in all ESCC tumor and normal tissue samples, regardless of the collection location (Fig. 2a). The Macro-LY6E subset expressed high levels of LY6E, APOE, and SPP1, and was additionally characterized by relatively high expression of gene signatures associated with immune inhibition, antigen presentation, and phagocytosis (Fig. 2b). The Macro-FOLR2 cluster expressed high levels of FOLR2, PLTP, and LYVE1 and was located mainly in para-cancerous tissue, indicating that the cells were tissue-resident macrophages [10]. Macro-MKI67 cluster was marked by high expression of proliferation-related genes, such as MKI67 and STMN1. Macro-VEGFA cells were enriched for expression of angiogenesis-related genes, such as VEGFA, and expressed the highest levels of those genes among the macrophage subclusters identified. Macro-VSIR cells were marked by high expression of VSIR and a strong immunoinhibitory profile consistent with the observed role of these cells in pancreatic cancer [17]. Macro-NEAT1 cells expressed high levels of NEAT1, CD83, and MCL1 and possessed the highest M1-like gene signature score, indicating a proinflammatory role. Finally, Macro-UBE2B cells expressed high levels of mitochondria-associated genes such as MT1X, but the role of this subcluster remains to be further elucidated (Fig. 2b, c and Supplementary Table 2).

a UMAP plot of various macrophages subpopulations. Lower panels show the proportions of each subpopulation in tumor and adjacent normal esophageal tissues. b Heatmap of the top differentially expressed genes in the indicated macrophages subpopulations. c UMAP plots showing marker gene expression of the macrophages subclusters. d Heatmap of the module scores of functional gene sets in the macrophage subpopulations. e Heatmap of the expression profiles of the feature functional gene sets in the macrophage subpopulations. f Volcano plot showing the differentially expressed genes in the Macro-LY6E cluster identified in this study and the Macro-C1QC cluster identified in the analysis of ESCC by Zhang et al. g Representative images of in situ immunofluorescent staining of ESCC samples for CD68, LY6E, SPP1, and SIRPα (n = 40). Scale bars, 10 μm. h GSEA showing significantly up-regulated pathways in Macro-LY6E compared with the findings in other macrophage subclusters. i UMAP plot of various macrophages subpopulations in ESCC datasets from GSE145370. j Vlnplot of the feature genes by the macrophages subpopulations in the ESCC dataset from GSE145370.
The Macro-LY6E cluster was the main macrophage subset located in ESCC tumor tissues (Supplementary Fig. 1a), and the gene signature was associated with not only relatively high M2-like and immunosuppressive activity but also high antigen-presenting and phagocytic potential, which are generally associated with anti-tumor activity (Fig. 2d, e). It is worth noting that Macro-LY6E clusters and Macro-MKI67 showed considerable overlap in their gene expression profiles. We then further compared the differentially expressed genes and the functional signatures between the two groups, The results indicated that, compared to the Macro-MKI67 cluster, the Macro-LY6E cluster exhibited elevated signatures associated with M2-like polarization, immune inhibition, phagocytosis, and antigen presentation (Supplementary Fig. 1b, c). The further cluster similarity analysis showed that the Macro-LY6E cluster was highly similar to the C1QC+ TAMs in the ESCC myeloid cell cluster from pan-cancer datasets (Supplementary Fig. 1d) [18]. However, the Macro-LY6E cluster identified here showed higher expression of SPP1, LY6E, SIRPA, IFI6, and HLA-DQB than C1QC+ TAMs, suggesting that these are distinct macrophage subpopulations (Fig. 2f). Besides, TREM2+/SPP1+macrophages have been well-characterized across multiple cancer types, including ESCC [12, 13]. To further highlight distinct features between Macro-LY6E and TREM2+/SPP1+ subsets, TREM2+/ SPP1+ macrophages derived from the GSE160269 ESCC dataset were compared with Macro-LY6E (Supplementary Fig. 1e, f) [15]. The Macro-LY6E cluster identified in this study exhibited higher expression levels of LY6E, CXCL9, IFI16, and HLA-DRB1 (Supplementary Fig. 1g). Furthermore, we compared functional signatures between the Macro-LY6E and TREM2+/SPP1+TAMs subsets. The analysis revealed that, compared to the TREM2+/SPP1+TAMs subset, the Macro-LY6E cluster displayed elevated signatures related to immunosuppression and antigen presentation, while the TREM2+/SPP1+TAMs subset exhibited stronger associations with M2 polarization and phagocytosis. (Supplementary Fig. 1h). To confirm the existence of LY6E+ macrophages in ESCC, we performed in situ multi-color immunofluorescence staining of tissue sections for their representative or functional markers including CD68, LY6E, SIRPA, and SPP1. Indeed, LY6E+ macrophages co-localized with SPP1+ and SIRPα+ cells in ESCC tissues (Fig. 2g). When investigating the enrichment pathway in LY6E+ macrophages by GSEA, interferon response pathways were significantly up-regulated in LY6E+ macrophages (Fig. 2h). To further validate the presence of LY6E+ macrophages, we collected and reanalyzed the macrophages from another ESCC datasets consisting of 7 patients with normal and tumor tissues, the macrophages were divided into 5 clusters (Fig. 2i and Supplementary Fig. 1i–l). Remarkably, Macro-C1 selectively expresses the characteristic genes of LY6E+ macrophages and is characterized by relatively high M2-like and immunosuppressive activity, as well as strong antigen-presenting and phagocytic potential, mirroring the traits of LY6E+ macrophages (Fig. 2j and Supplementary Fig. 1m). Collectively, LY6E+ macrophages with distinct characteristics were identified in human ESCC.
LY6E+ macrophages abundance correlates with poor prognosis but well response to ICB in ESCC
To investigate the clinical significance of LY6E+ macrophages in ESCC, we conduct multiplexed immunohistochemistry regarding LY6E+ macrophages in our in-house ESCC cohort 2 (n = 249). The results showed the density of LY6E+ macrophages correlated positively with both tumor stage and node invasion (Fig. 3a). The GSVA score analysis demonstrated that LY6E+ macrophages were more enriched in ESCC tumor tissues than adjacent normal esophageal tissues (Fig. 3b). The overall survival analysis showed significant correlations between high expression of the LY6E+ macrophages gene signature and unfavorable prognosis, both in the TCGA ESCC cohort and our in-house ESCC cohort (Fig. 3c, d). Multivariate Cox regression (Fig. 3e) also identified LY6E+ macrophages to be an independent unfavorable factor for ESCC. Taken together, these results demonstrate that high infiltration of LY6E+ TAMs is an unfavorable prognostic biomarker in ESCC.

a LY6E+ macrophages density in ESCC tumors according to pathological stage (left) and node stage (right). p-value by Mann–Whitney test. b GSVA scores of Macro-LY6E in normal (N) and tumor (T) tissues from the TCGA ESCC dataset (n = 80). p-value by Mann–Whitney test. c Overall survival analysis of the ESCC validation cohort 2 (n = 249) stratified by the ratio of the Macro-LY6E. p-value was determined by the log-rank test. d Overall survival analysis of the TCGA ESCC cohort stratified by tumor expression of the Macro-LY6E signature (n = 80). p-value was determined by the log-rank test. e Forest plot depicting multivariate Cox regression analysis of clinical factors and LY6E+ macrophages in relation to overall survival in ESCC validation cohort 2. f Pathological evaluation of patients from the ESCC cohort 3 receiving neoadjuvant immunotherapy (n = 22). Detailed information is provided in Supplementary Table 1. g Representative images of in situ immunofluorescent staining of LY6E+ macrophages before immunotherapy in ESCC patients who reached pCR and non-pCR in ESCC cohort 3. h Density of Macro-LY6E in pre-treatment tumor samples of responding and non-responding ESCC patients receiving neoadjuvant immunotherapy (n = 22). p-value by Mann–Whitney test. i Correlation between immunotherapy response and the Macro-LY6E infiltration level in ESCC patients undergoing neoadjuvant anti-PD-1 therapy (n = 22). p-value by Fisher’s exact test.
Subsequently, we investigated the relationship between response to ICB and the abundance of LY6E+ macrophages by performing in situ multi-color immunofluorescence staining of tissues from 22 ESCC patients who received neoadjuvant anti-PD-1 therapy (Fig. 3f). This analysis found a higher abundance of LY6E+ macrophages infiltration in the pre-treatment samples from responders than non-responders to neoadjuvant immunotherapy (Fig. 3g, h). Besides, an increased abundance of LY6E+macrophages correlates with an elevated response ratio in ESCC patients undergoing neoadjuvant anti-PD-1 therapy (Fig. 3i).
High infiltration of LY6E+ macrophages is associated with exhausted CD8+ T cells
The predictive role of LY6E+ macrophages in ESCC patients receiving neoadjuvant immunotherapy indicated their involvement in adaptive immunity. Given the crucial role of macrophage-T cell interactions in immune response orchestration, we next focused on characterizing the interplay between LY6E+ macrophages and T cells. Using our ESCC scRNA-seq dataset, we conducted unsupervised clustering of T cells and identified 12 clusters: six CD8+ T cell, four CD4+ T cell, and one NKT cell cluster (Fig. 4a and Supplementary Fig. 2a–c). The CD8-GZMK cluster highly expressed GZMK and CST7. The CD8-PROG-EXH subset selectively expressed progenitor exhaustion markers, identifying it as progenitor exhausted CD8⁺ T cells (CD8+ Tpex)— a classification further supported by its elevated progenitor exhaustion signature score (Supplementary Fig. 2d). The CD8-CX3CR1 cluster was considered as terminal effector memory T cells (CD8+ Temra cells), due to its high expression of effector T cells markers. The CD8-TER-EXH cluster selectively expressed exhausted markers, such as PDCD1, LAG3, HAVCR2, and TOX, suggesting it to be terminal exhausted CD8+ T cells (CD8+ Tex) [19, 20]. This classification was further supported by elevated terminal-exhaustion signature scores in the CD8-TER-EXH subcluster (Supplementary Fig. 2d). CD8-ISG15 highly expressed the progenitor exhaustion markers. The CD8-PROLIF-EXH cluster highly expressed proliferating markers and terminal exhausted markers, such as MKI67, STMN1, PDCD1, LAG3, and HAVCR2, suggesting it to be proliferating exhausted CD8+ T cells [20] (Fig. 4b).

a UMAP plot of various T cells subpopulations. b Heatmap of the expression profiles of the feature functional gene sets in the T cells subpopulations. c Heatmap showing the activity (left) and regulatory potential (right) of the ligands in LY6E+ macrophages cells driving the CD8+ T cells. d Relationship between the proportion of Macro-LY6E among total macrophages and the proportion of the indicated T cells subsets among total T cells. e Scatter plot showing the Pearson correlation between the proportion of Macro-LY6E among total macrophages and CD8-TER-EXH clonality in our ESCC scRNA-seq dataset (n = 27). f Pearson correlation between Macro-LY6E and CD8-TER-EXH signature scores in the TCGA ESCC cohort (n = 80). g The significant interaction numbers between Macro-LY6E and various CD8+ T cells subclusters. h Heatmap showing the activity (left) and regulatory potential (right) of the ligands in CD8-TER-EXH cells driving the phenotype of Macro-LY6E cells.
To elucidate the potential interactions between LY6E+ macrophages and CD8+ T cells, we first examined the regulatory effects of LY6E+ macrophages on CD8+ T cell populations. This analysis revealed significant enrichment of immunoinhibitory molecules in LY6E+ macrophages, particularly CD274 (PD-L1), which exhibited potent immunosuppressive effects on CD8+ T cells (Fig. 4c). These findings were further supported by data from the GSE145370 dataset, where the homologous Macro-C1 population similarly mediated immunosuppression through CD274 (Supplementary Fig. 3a–d). Building on these observations, we subsequently investigated the correlation of LY6E+ macrophages with CD8+ T cells subclusters. Strikingly, LY6E+ macrophage abundance showed the strongest correlation with CD8+ Tex cells (Fig. 4d and Supplementary Fig. 2e). Single-cell sequencing of T cell receptors showed expansion (clone size ≥3) of several subsets, mainly CD8+ Tex cells and CD8+ effector memory T cells (Supplementary Fig. 2f, g). Therefore, we next analyzed the relationship between the expanded CD8+ Tex cells subset and LY6E+ macrophages in more detail. Evaluation of the clonality of CD8+ Tex cells with STARTRAC showed that CD8+ Tex clonality correlated positively with the relative frequency of LY6E+ macrophages in our ESCC dataset (r = 0.61, p = 0.001; Fig. 4e). The correlation between CD8+ Tex cells and LY6E+ macrophages was independently confirmed in TCGA ESCC datasets, showing strong positive correlation between the gene signature scores of LY6E+ macrophages and CD8+ Tex cells (r = 0.65, p < 0.001) (Fig. 4f). The GSE145370 dataset similarly demonstrated a positive relationship between Macro-C1 and CD8+ Tex cells (Supplementary Fig. 3e). These results demonstrated a positive correlation between LY6E+ macrophages and CD8+ Tex cells.
Additionally, LY6E+ macrophages exhibited preferential interactions with CD8+ Tex cells compared with other CD8+ T cells subpopulations (Fig. 4g). Our regulatory network analysis identified significant upregulation of macrophage-related cytokines (CSF-1, CCL3, CCL4) in CD8+ Tex cells, indicating their capacity to both recruit and phenotypically modulate LY6E+ macrophages (Fig. 4h). To further substantiate the specificity of this signaling axis, we then investigated the expression of CSF1R (receptor for CSF-1), CCR1 (receptor for CCL3), and CCR5 (receptor for CCL4) across the macrophage subclusters. As a result, CSF1R was highly expressed in the Macro-LY6E cluster, and CCR1 showed the most pronounced upregulation in this population (Supplementary Fig. 2j). Cellular interactions between TAMs and exhausted CD8+ T cell subsets are pivotal in shaping the immunosuppressive tumor microenvironment. To investigate whether CD8+ Tpex cells exhibit similar interactions with Macro-LY6E, we then also compared the cellular communication between Macro-LY6E and CD8+ Tex cells versus CD8+ Tpex cells (Supplementary Fig. 2h, i). The results indicated that, in contrast to CD8+ Tpex cells, Macro-LY6E communicates with CD8+ Tex cells via inhibitory signaling axes such as LGALS9–HAVCR2, CD80/86–CTLA4, and NECTIN2–TIGIT. Furthermore, CD8+ Tex cells appear to recruit Macro-LY6E through ligands such as CCL3 and CSF1 [6]. In addition, in the GSE145370 dataset, the CD8+ Tex cells also showed both increased interactions with Macro-C1 and elevated expression of the same macrophage-attracting factors [6] (Supplementary Fig. 3f, g). These results suggest the specific role of the CD8+ Tex cells in attracting Macro-LY6E. Interestingly, the CD8+ Tex cells selectively exhibited high expression of both CXCL13 and ENTPD1 (Supplementary Fig. 2k), suggesting their potential tumor-reactive role [21, 22]. Correspondingly, the CD8+ Tex cells exhibited the most robust IFN-γ production among all T cell subsets (Fig. 4b), providing a mechanistic explanation for the observed interferon response pathway activation in LY6E+ macrophages. These results suggested the vital role of CD8+ Tex cells in attracting and polarizing LY6E+ macrophages.
Formation of the possible niche of LY6E+ macrophages, CD8+ Tex cells and ICAM2+ tumor cells correlates with immunotherapy response
Considering the enrichment of LY6E+ macrophages in tumor tissues compared with the adjacent normal tissues, the tumor cells might play a vital role in attracting or retaining LY6E+ macrophages. Indeed, epithelial cells demonstrated the most frequent interactions with LY6E+ macrophages compared to other macrophage subpopulations (Fig. 5a). Further analysis revealed enhanced ICAM2-(ITGB2 + ITGAM/ITGAL)-mediated intercellular adhesion between epithelial cells and LY6E+ macrophages (Fig. 5b). Notably, in the GSE145370 dataset, Macro-C1 exhibited significantly elevated expression of ITGB2 and ITGAM relative to other macrophage subclusters (Supplementary Fig. 4a). These findings collectively suggest that tumor epithelial cells may preferentially retain LY6E+ macrophages through specific adhesion molecule interactions, particularly the ICAM2-(ITGB2 + ITGAM/ITGAL) axis.

a Heatmap showing the significant interaction numbers between epithelial cells and various macrophages subclusters. b Summary of intercellular adhesion molecular interactions between epithelial cells and macrophages subpopulations. c Representative images of in situ immunofluorescent staining of CD68, LY6E, PD1, CD8, ICAM2, and panCK in ESCC samples (n = 39). Scale bars, 300 μm. d Scatter plot showing the Pearson correlation between the density of Macro-LY6E and ICAM2+ panCK+ cells in ESCC samples (n = 39). e Scatter plot showing the Pearson correlation between the density of Macro-LY6E and CD8+ Tex cells in ESCC samples (n = 39). f Distribution of distances between LY6E+ or LY6E− macrophages and ICAM2+ panCK+ cells. p-value by Mann–Whitney test. g Distribution of distances between LY6E+ or LY6E− macrophages and CD8+ Tex cells. p-value by Mann–Whitney test. h Progression-free survival of ESCC patients receiving Sintilimab in the ORIENT-2 studies stratified by low or high score of the niche gene signature (n = 64). p-value by log-rank test.
Having characterized these functional interactions among LY6E+ macrophages, CD8+ Tex cells, and ICAM2+ tumor cells, we proceeded to investigate their spatial organization in human ESCC tissues by in situ multi-color immunofluorescence staining (Fig. 5c). Herein, the CD8+ Tex were determined by CD8+PD1+ T cells based on their selective and high-level expression of PDCD1 (Fig. 4b). Quantitative analysis revealed significant positive correlations between LY6E+ macrophages density with both PD1+CD8+ Tex cells and ICAM2+ tumor cells densities (Fig. 5d, e). Spatial mapping further demonstrated that LY6E+ macrophages were preferentially localized in closer proximity to both PD1+CD8+ Tex cells and ICAM2+ tumor cells compared to their LY6E– counterparts (Fig. 5f, g). These results suggested that a functional niche comprising LY6E+ macrophages, CD8+ Tex cells, and ICAM2+ tumor cells within the TME.
We next investigated the clinical implications of the existence of such a niche by constructing a combined ‘niche’ signature from the LY6E+ macrophage, CD8+ Tex cell, and ICAM2+ tumor cell gene signatures. The relationship between tumor expression of the niche signature and response to ICB treatment was then evaluated by comparing survival of cancer patients with high and low signature expression in various clinical studies. In the ESCC patients receiving Sintilimab (anti-PD-1 Ab) from the ORIENT-2 clinical trial [23], patients with high niche signature score correlated with longer progression-free survival (Fig. 5h). Besides, similar results were found in several other solid tumors in independent external datasets (Supplementary Fig. 4b–e) [24,25,26]. These results suggest the formation of a niche composed of LY6E+ macrophages, CD8+ Tex cells, and ICAM2+ tumor cells, which is associated with immunotherapy response (Fig. 6).

The niche formation by LY6E+ macrophages, CD8+ Tex cells, and ICAM2+ tumor cells within the TME of ESCC.