
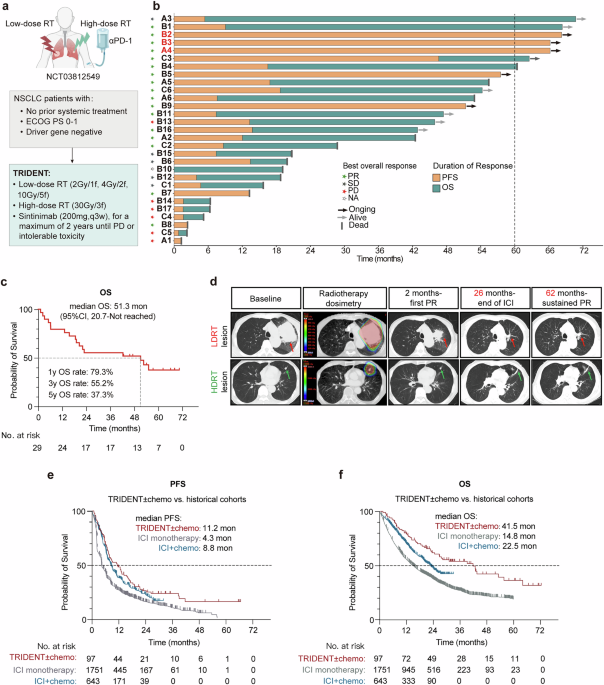
Durable survival with TRIDENT in treatment-naïve advanced NSCLC
In our prospective phase I clinical trial (NCT03812549), treatment-naïve, PD-L1+ patients with advanced NSCLC were treated with the TRIDENT regimen, integrating LDRT to large lesion(s), focal HDRT to small lesion(s), and concurrent systemic PD-1 blockade with sintilimab, without chemotherapy. Detailed information on the number of irradiated lesions per patient is provided in Supplementary Table 1. Twenty-nine NSCLC patients were enrolled (Fig. 1a, b). Most patients were male (n = 26, 89.7%) and former smokers (n = 24, 82.8%), and 19 patients (65.6%) had PD-L1 tumor proportion score (TPS) < 50%. All patients had an ECOG performance status of 0-1. Histologic subtypes included adenocarcinoma (n = 16), squamous cell carcinoma (n = 12), and NSCLC not otherwise specified (n = 1). Brain metastases were present in 5 patients (17.2%), and no patients had liver metastases. Exploratory univariable Cox analyses showed that no baseline clinical variables were associated with OS or progression-free survival (PFS) (Supplementary Fig. 1a, b). The B10 patient was excluded from the efficacy evaluation due to anaphylaxis during the first sintilimab infusion.

Durable Survival with TRIDENT in treatment-naïve advanced NSCLC. a Schematic diagram of the clinical trial study design. b Swimmer plot showing treatment duration and best response for 29 enrolled patients treated with TRIDENT. Partial response (PR), stable disease (SD), progressive disease (PD), not applicable (NA). c Kaplan–Meier curves of overall survival (OS). d Representative CT images from a patient with a durable response, displayed from baseline to most recent follow-up; corresponding radiotherapy dosimetry is shown. Kaplan–Meier curves comparing progression-free survival (e) and OS (f) between the retrospective cohort and historical cohorts from pooled analysis. Statistical significance was assessed by log-rank test for survival (c). *, P < 0.05; **, P < 0.01; ***, P < 0.001; ****, P < 0.0001
As of April 1, 2025, with a median follow-up of 62.5 months (range, 54.6–70.3), the median OS was 51.3 months (95% confidence interval [CI], 20.7-not reached) (Fig. 1c), numerically exceeding historical outcomes for pembrolizumab alone (14.8 months)39 or with chemotherapy (22.5 months).40 The objective response rate (ORR) was 60.7% and median PFS was 8.6 months (95% CI, 3.7–16.5).41 Five patients remained progression-free, including three with PFS exceeding 5 years (Fig. 1b). As all five progression-free patients received only PD-1 blockade for 24 months, their sustained disease control likely reflects a long-term antitumor immune memory driven by TRIDENT.
As an illustrative case, a 71-year-old man presented with stage IV (cT4N3M1) poorly differentiated lung adenocarcinoma with pulmonary, mediastinal, axillary, and intracranial involvement (PD-L1 26–49%). He received TRIDENT: HDRT 30 Gy in 3 fractions to a left lower-lobe lesion, LDRT 4 Gy in 2 fractions to a bulky left hilar tumor, and systemic αPD-1 (sintilimab). After two cycles, he achieved a partial response (PR), which has been maintained for 62 months. Asymptomatic radiation-induced pneumonitis was observed following HDRT (Fig. 1d).
To extend the clinical evidence beyond the prospective trial setting, we conducted a retrospective real-world analysis of 97 patients with advanced NSCLC treated with first-line TRIDENT-based radioimmunotherapy. This cohort had a mean age of 64.4 years, 85.6% were male, 71.1% had a smoking history, 46.3% had adenocarcinoma histology, and 25.8% had high PD-L1 expression (Supplementary Table 2). The median PFS and OS were 11.2 months (95% CI, 8.2–16.5) and 41.5 months (95% CI, 26.3–63.7), respectively. These estimates are numerically higher than historical benchmarks from pooled analyses of pembrolizumab monotherapy (PFS, 4.3 months; OS, 14.8 months)39 and pembrolizumab plus platinum-based chemotherapy (PFS, 8.8 months; OS, 22.5 months)40(Fig. 1e, f), suggesting a clinically meaningful signal despite the inherent limitations of cross-trial comparisons.
Collectively, these findings suggest that TRIDENT may represent a clinically active regimen capable of inducing durable benefit in advanced NSCLC, warranting further investigation of the underlying immunological mechanisms.
TRIDENT drives neutrophil-dependent systemic antitumor immunity in mice
An immunologically optimal LDRT regimen for mechanistic studies was identified by reanalyzing bulk RNA-seq data from our previous work,12 in which mice bearing a single CT26 tumor received 1, 3, or 5 fractions of 2 Gy each (i.e., 2 Gy × 1, 2 Gy × 3, or 2 Gy × 5). Among these, a single 2 Gy fraction induced the strongest immune response, with increased infiltration of CD4⁺ and CD8⁺ T cells, B cells, and dendritic cells, along with a significantly higher immune diversity index (Shannon entropy) (Fig. 2a, b). These findings provided the mechanistic rationale for selecting 2 Gy × 1 as the LDRT regimen for subsequent dual-tumor experiments examining TRIDENT efficacy. Dual-tumor mouse models were used to recapitulate the multi-lesion setting of metastatic disease and to evaluate the systemic antitumor immunity induced by TRIDENT.

TRIDENT drives neutrophil-dependent systemic antitumor immunity in mice. a Heatmap showing changes in immune cell subset densities and overall infiltration scores in tumors following LDRT, based on ImmuCellAI analysis (n = 4–5 per group). b Shannon diversity index of tumor-infiltrating immune cells across treatment groups (n = 4–5 per group). Box plots represent the interquartile range (IQR), with the horizontal line indicating the median; whiskers extend to the minimum and maximum values within 1.5 × IQR. c Treatment schema for mice bearing bilateral subcutaneous tumors (LLC or CT26). The primary tumor (T1) received HDRT (8 Gy × 3 f), the second abscopal tumor (T2) received LDRT (2 Gy × 1 f), and αPD-1 antibody was administered systemically. Tumor growth curves for primary (T1, d) and second (T2, e) tumors, and survival (f) analysis in the LLC model following different treatments (n = 7 per group). Tumor growth curves for primary (T1, g) and second (T2, h) tumors, and survival (i) analysis in the CT26 model across treatments (n = 7 per group). j t-SNE plot of all single cells from second tumors based on scRNA-seq, colored by six major cell lineages. k Bubble plot showing expression of representative marker genes across the six major lineages. Dot size denotes the fraction of expressing cells and color intensity the mean expression level. l Quantification of the six cell subsets identified in (j) across different groups. Flow cytometric analysis of neutrophil (CD11b⁺Ly-6G⁺) infiltration in second tumors in the LLC model: m representative flow cytometry plots gated from CD45⁺ immune cells; n absolute neutrophil counts per milligram tumor (n = 7 per group). o–q Tumor growth curves and survival analysis of LLC-bearing mice treated with TRIDENT or TRIDENT plus neutrophil-depleting antibodies (n = 7 per group). Data are mean ± SEM. Statistical significance was assessed by Wilcoxon test (b), two-way ANOVA (d, e, g, h, o, p), or log-rank test for survival (f, i, q). *, P < 0.05; **, P < 0.01; ***, P < 0.001; ****, P < 0.0001
TRIDENT was implemented by delivering immunogenic HDRT (8 Gy × 3) to the primary tumor (T1) and immunomodulatory LDRT (2 Gy × 1) to the second tumor (T2), together with concurrent systemic PD-1 blockade in bilateral LLC or CT26 models (Fig. 2c). As expected for focal HDRT, the HDRT-containing regimens, including HDRT + αPD-1, HDRT + LDRT, and HDRT + LDRT + αPD-1 (TRIDENT), achieved nearly complete eradication of the primary tumors in the LLC model (Fig. 2d and Supplementary Fig. 2a–f), with similar results in the CT26 model (Fig. 2g and Supplementary Fig. 2g–l). Thus, primary-tumor control did not discriminate among regimens. In contrast, the second tumor provided the critical readout of systemic immunity, as LDRT alone is non-cytotoxic. None of the two-component regimens (HDRT + αPD-1, HDRT + LDRT, or LDRT + αPD-1) exerted substantial effects on second tumor growth, indicating that they were insufficient to elicit a systemic antitumor response in mice bearing bilateral tumors (Fig. 2e, h). Only the TRIDENT regimen significantly inhibited growth of both primary and second tumors in both the LLC and CT26 models (Fig. 2e, h), demonstrating a robust systemic immune response that required integration of all three components. Consistently, TRIDENT significantly prolonged survival in both models (Fig. 2f, i). These results demonstrate that TRIDENT elicits a potent antitumor response, suppressing both local and abscopal tumor growth and extending survival in two bilateral mouse tumor models.
To investigate how TRIDENT modulates the TME, we performed single-cell RNA-seq on second tumors in the LLC model. T-distributed Stochastic Neighbor Embedding (t-SNE) analysis of pooled samples (Fig. 2j) delineated major subsets based on canonical markers (Fig. 2k). Comparison of treatment arms revealed a marked increase in tumor-infiltrating neutrophils in second tumors of TRIDENT-treated mice (Fig. 2l). Flow cytometry confirmed increased neutrophil infiltration at the second site after TRIDENT in the LLC model (Fig. 2m, n, gating strategies shown in Supplementary Fig. 3), with similar results in the CT26 model (Supplementary Fig. 4a). Immunofluorescence further corroborated the increased presence of Ly6G⁺ cells (Supplementary Fig. 4k). In vivo depletion of neutrophils using αLy6G antibodies (Supplementary Fig. 4f) caused only modest impairment of primary-tumor control (Fig. 2o) but led to pronounced loss of control at the second site (Fig. 2p) and significantly reduced survival (Fig. 2q). Depletion efficiency was verified by flow cytometry of peripheral blood (Supplementary Fig. 4g).
Together, these data demonstrate that TRIDENT elicits robust, neutrophil-dependent systemic tumor control in bilateral mouse models, with particularly effective suppression of distant (second) tumors.
TRIDENT expands TNF-α⁺ neutrophils and effector CD8⁺ T cells in second tumors
Single-cell analysis with Uniform Manifold Approximation and Projection (UMAP) visualization of tumor-infiltrating neutrophils identified four distinct subsets across all groups (Fig. 3a, b). Based on response-signature scoring adapted from a prior study,42 the N1 neutrophil cluster aligned with ICI-responsive states (Fig. 3c). Notably, the N1 cluster showed an upward trend in frequency in second tumors from TRIDENT-treated mice, suggesting involvement in the enhanced therapeutic efficacy (Fig. 3d). Differential gene expression analysis revealed marked upregulation of Tnf and Cd14 in N1 versus other clusters (Fig. 3b and Supplementary Fig. 4h), consistent with a previously described neutrophil subset with T-cell-stimulatory features43; accordingly, we refer to N1 as TNF-α⁺ neutrophils. Flow cytometry confirmed a significant expansion of TNF-α⁺ (Fig. 3e) and TNF-α⁺CD14⁺ neutrophils (Fig. 3f) in second tumors following TRIDENT in the LLC model, with similar results in the CT26 model (Supplementary Fig. 4b, c). We further assessed neutrophil maturation and activation states and observed significant increases in CD14⁺CD101⁻ (Fig. 3g) and CD14⁺CD62L+ neutrophils (Fig. 3h) after TRIDENT in the LLC model, with consistent results in the CT26 model (Supplementary Fig. 4d, e). Gene Ontology (GO) and Kyoto Encyclopedia of Genes and Genomes (KEGG) enrichment analyses of N1 highlighted cytokine-related pathways, including cytokine activity, cytokine-cytokine receptor interaction, and TNF-α signaling via NF-κB (Supplementary Fig. 4i).

TRIDENT expands TNF-α⁺ neutrophils and effector CD8⁺ T cells in second tumors. a UMAP visualization of intratumoral neutrophils from scRNA-seq. b Bubble plot showing representative marker gene expression across neutrophil subsets. Dot size indicates the fraction of expressing cells and color intensity the mean expression. c UMAP plot highlighting neutrophils scored by response-associated (left) and non-response-associated (right) gene signatures. d Box-and-violin plots showing the proportion of N1 neutrophils in second tumors across treatment groups. Boxes denote the interquartile range (IQR), with the horizontal line indicating the median; whiskers extend to the minimum and maximum values within 1.5 × IQR. Violins depict kernel-density distribution with individual points overlaid. Flow-cytometric quantification of TNF-α⁺ (e), TNF-α⁺CD14⁺ (f), CD14⁺CD101− (g), and CD14⁺CD62L⁺ (h) neutrophils per milligram tumor in second tumors in the LLC model (n = 7 per group). Flow cytometric analysis of CD8⁺ T cell infiltration in second tumors in the LLC model: i representative plots gated from CD45⁺CD3⁺ T cells; j absolute CD8⁺ T-cell counts per milligram tumor (n = 7 per group) k UMAP plot of tumor-infiltrating T/NK cells from scRNA-seq. l Proportion of seven T/NK cell subsets across treatment groups. m Violin plots of cytotoxicity scores across different T/NK cell subsets derived from gene expression profiles. Embedded box plots indicate IQR (box), median value (horizontal line within the box), and whiskers extending to 1.5× IQR; outliers are shown as individual points. n Heatmap showing enrichment of functionally relevant pathways in CD8_Effector T cells under different treatments. Flow-cytometric counts of perforin⁺ (o), IFN-γ⁺ (p), TNF-α⁺ (q), and granzyme B⁺ (r) CD8+ T cells per milligram tumor in second tumors in the LLC model (n = 7 per group). s–u Tumor growth curves and survival of LLC-bearing mice treated with TRIDENT or TRIDENT plus CD8⁺ T-cell-depleting antibodies (n = 7 per group). Data are mean ± SEM. Statistical significance was assessed by one-way ANOVA (e–h, j and o–r), two-way ANOVA (s, t) or log-rank test for survival (u). *, P < 0.05; **, P < 0.01; ***, P < 0.001; ****, P < 0.0001
Given the central role of CD8⁺ T cells as effectors of antitumor immunity and the established capacity of activated myeloid cells to shape T-cell responses,29,44 we next examined the impact of TRIDENT on CD8⁺ T cells within the TME in second tumors. Flow cytometry showed higher infiltration of CD8+ T cells within the TME in both tumor models (Fig. 3i, j and Supplementary Fig. 4l). Immunofluorescence also corroborated the increased presence of CD8⁺ cells in the second tumor (Supplementary Fig. 4k). To further characterize tumor-infiltrating T cells, unsupervised clustering of tumor-infiltrating T/NK cells resolved six transcriptionally distinct T-cell subsets (Fig. 3k). Among these, the CD8_Effector T subset was enriched in the TRIDENT group (Fig. 3l) and exhibited the highest cytotoxicity score (Fig. 3m). In TRIDENT-treated tumors, the CD8_Effector T subset showed enhanced functional programs, including increased IFN response, cytotoxicity, cytokine/cytokine receptor signaling, activation/effector function, and anti-apoptotic capacity (Fig. 3n). Flow cytometry corroborated increased infiltration of CD8⁺ T cells expressing perforin (Fig. 3o), IFN-γ (Fig. 3p), TNF-α (Fig. 3q), and granzyme B (Fig. 3r) in second tumors of the LLC model, with concordant findings in the CT26 model (Supplementary Fig. 4m–p). Marker genes for T/NK cell sub-clustering are provided in Supplementary Fig. 4j. In vivo depletion of CD8⁺ T cells using αCD8 antibodies (Supplementary Fig. 4q) caused only modest impairment of primary-tumor control (Fig. 3s) but led to pronounced loss of control at the second site (Fig. 3t) and significantly reduced survival (Fig. 3u). Depletion efficiency was verified by flow cytometry of peripheral blood (Supplementary Fig. 4r).
Together, these findings show that TRIDENT induces a TNF-α⁺ neutrophil subset and enhances cytotoxic CD8⁺ T-cell infiltration in second tumors, motivating further study of coordinated neutrophil-T-cell interactions in mediating systemic antitumor immunity.
TNF-α⁺ neutrophils exhibit antitumor properties and activate CD8⁺ T cells
We observed a strong positive correlation between intratumoral TNF-α⁺ neutrophils and CD8⁺ T-cell abundance in second tumors (Fig. 4a), suggesting a potential functional interplay between these two immune populations. Pathway enrichment analysis of N1_TNF-α⁺ neutrophils demonstrated upregulation of the cellular response to IFN-γ and antigen processing and presentation pathways in the TRIDENT group (Fig. 4b). To investigate how neutrophils functionally support CD8⁺ T-cell responses in the second tumor, we performed receptor-ligand interaction analysis on single-cell transcriptomes. This analysis revealed that N1_TNF-α⁺ neutrophils displayed enhanced antigen presentation interactions, with MHC molecules (H2-k1 and H2-d1) engaging CD8 receptors (Cd8a/Cd8b1) on CD8_Effector T subsets (Fig. 4c). Flow cytometry confirmed that TRIDENT significantly increased MHC-I+, MHC-II+, CD86+, CCR7+ neutrophils (Fig. 4d–g), and 4-1BBL+ neutrophils (Fig. 4h), in second tumors in the LLC model, with similar findings in the CT26 model (Supplementary Fig. 5a–g). Concordantly, intratumoral CD8⁺ T cells upregulated the corresponding receptor, 4-1BB (Fig. 4i), supporting a potential bidirectional costimulatory interaction.

TNF-α⁺ neutrophils exhibit antitumor properties and activate CD8⁺ T cells. a Spearman correlation between TNF-α+ neutrophils and CD8+ T-cell abundance, with significance assessed by least-squares linear regression (n = 7/group, 4 groups). b Pathway enrichment analysis of N1_TNF-α+ neutrophils across treatment groups. c Cell–cell communication analysis between N1_TNF-α+ neutrophils and CD8 _Effector T cells in second tumors across treatment groups. Flow-cytometric counts of MHC-I+ (d), MHC-II+ (e), CD86+ (f), CCR7+ (g), and 4-1BBL+ (h) neutrophils per milligram tumor in second tumors in the LLC model (n = 7 per group). (i) Flow-cytometric counts of 4-1BB+ CD8+ T cells per milligram tumor in second tumors in the LLC model (n = 7 per group). (j) Percentage of H-2Kb-SIINFEKL (OVA) MHC-I complexes on Con- or N1_TNF-α⁺ neutrophils (n = 3 per group). k Schematic of the in vitro study evaluating co-culture of control or N1_TNF-α⁺ neutrophils with CD8⁺ T cells, treated with or without αPD-1. Percentages of T-cell activation markers 4-1BB (l), CD69 (m), and CD25 (n) under co-culture conditions as in (k) (n = 6 per group). o CD8⁺ T-cell proliferation in co-culture with N1_TNF-α⁺ neutrophils or control (untreated) neutrophils, with or without αPD-1 (n = 8 per group). p Tumor-cell death assessed by propidium iodide (PI) staining after co-culture with CD8⁺ T cells, and N1_TNF-α⁺ or control neutrophils in the presence of αPD-1 (n = 3 per group). q Experimental schematic of in vivo study evaluating the therapeutic efficacy of adoptively transferred N1_TNF-α⁺ neutrophils in combination with αPD-1. Tumor growth curves (r) and survival (s) of LLC-bearing mice treated with adoptive neutrophil transfer with or without αPD-1 (n = 6 per group). Data are mean ± SEM. Statistical significance was assessed by one-way ANOVA (d–i, l–o, p), Student’s t test (j), two-way ANOVA (r), or log-rank test for survival (s). *, P < 0.05; **, P < 0.01; ***, P < 0.001; ****, P < 0.0001
To further probe their T-cell-stimulatory features, neutrophils were stimulated with GM-CSF and IFN-γ as described previously.43 These neutrophils exhibited upregulation of CD14, MHC-I, MHC-II, CD86, CD206, and CCR7 (Supplementary Fig. 5h–m), along with a distinctive “donut-shaped” nuclear morphology (Supplementary Fig. 5o). PD-L1 was also upregulated on N1_TNF-α⁺ neutrophils, motivating inclusion of PD-1 blockade in subsequent co-culture and adoptive transfer assays (Supplementary Fig. 5n). Bulk RNA-seq of N1_TNF-α⁺ neutrophils showed enrichment in TNF signaling and antigen processing and presentation pathways (Supplementary Fig. 5p, q). Pulsing N1_TNF-α⁺ neutrophils with ovalbumin showed enhanced cross-presentation of ovalbumin via H-2Kb MHC-I complexes (Fig. 4j). In co-culture with CD8⁺ T cells (Fig. 4k), N1_TNF-α⁺ neutrophils significantly increased activation markers (4-1BB, CD69 and CD25; Fig. 4l–n) and T cell proliferation (Fig. 4o), with further augmentation upon PD-1 blockade. In tri-culture (CD8⁺ T cells, tumor cells, and neutrophils), N1_TNF-α⁺ neutrophils markedly increased tumor cell apoptosis (PI⁺) compared with untreated neutrophils (Fig. 4p), demonstrating their capacity to enhance CD8⁺ T cell cytotoxicity in the presence of αPD-1. Finally, adoptive transfer of N1_TNF-α⁺ neutrophils into tumor-bearing mice, in combination with αPD-1, delayed tumor growth (Fig. 4r) and prolonged survival (Fig. 4s), as schematized in Fig. 4q.
Together, these data indicate that TRIDENT-induced N1_TNF-α⁺ neutrophils exhibit antitumor properties, possibly activating CD8⁺ T cells via antigen presentation and costimulation in vitro, and exert antitumor effects in vivo following adoptive transfer into tumor-bearing mice.
ICAM-1-LFA-1 interactions drive neutrophil-T cell engagement and cytotoxicity in TRIDENT-induced responses
Given that effective neutrophil-T cell engagement may depend on adhesion-mediated immune synapse formation,20 we next investigated the molecular basis of this interaction in TRIDENT. To probe ligand-receptor interactions between N1_TNF-α⁺ neutrophils and CD8⁺ T cells, we analyzed single-cell transcriptomes from second tumors and found TRIDENT-specific enrichment of the Icam1-Itgal (encoding LFA-1α; the α subunit of LFA-1) interaction between N1_TNF-α⁺ neutrophils and CD8_Effector T cells, compared with αPD-1 or HDRT + αPD-1 treatment (Fig. 5a, b). ICAM-1, an Ig-superfamily adhesion molecule, interacts with the T-cell integrin LFA-1 to promote recruitment and adhesion and to stabilize antigen-specific T cell contacts.45,46,47,48,49 The interaction between ICAM-1 and LFA-1 is crucial for immune synapse formation.20 Flow cytometry showed that TRIDENT significantly upregulated ICAM-1 on neutrophils and LFA-1α on CD8⁺ T cells in second tumors from TRIDENT-treated mice (Fig. 5d, e). Immunofluorescence confirmed increased LFA-1α expression in second tumors from TRIDENT-treated mice (Fig. 5c). N1_TNF-α⁺ antitumor neutrophils expressed markedly elevated ICAM-1 (Fig. 5f, g). Based on the hypothesis that an immune synapse could form between CD8+ T cells and antitumor neutrophils, we co-cultured these cells and subsequently analyzed them using imaging flow cytometry. Analysis of the CD8 and Ly-6G double-positive cell population revealed two distinct subpopulations. A subpopulation with low eccentricity, representing true doublets, was identified. Notably, within these true doublets, ICAM-1 (red) and LFA-1α (green) fluorescence showed partial overlap, generating a yellow signal, suggesting potential active synapse formation. In contrast, a subpopulation with high eccentricity was classified as coincident doublets. Intriguingly, N1_TNF-α⁺ neutrophils exhibited a significantly higher proportion of low-eccentricity cells compared to the control group. This finding implies that N1_TNF-α⁺ neutrophils may form immune synapse-like interactions with CD8+ T cells more than their control counterparts (Fig. 5h).

ICAM-1-LFA-1 interactions drive neutrophil-T cell engagement and cytotoxicity in TRIDENT-induced responses. a Comparison of ligand-receptor crosstalk between N1_TNF-α⁺ neutrophils and CD8_Effector T cells in second tumors across treatment groups, inferred from scRNA-seq. b Contribution scores of key ligand-receptor pairs within the ICAM signaling pathway between N1_TNF-α⁺ neutrophils and CD8_Effector T cells under TRIDENT. c Representative immunofluorescence (IF) images showing LFA-1α expression in second tumors in the LLC model across different groups. Scale bars, 50 µm. Flow-cytometric counts of ICAM1⁺ neutrophils (d) and LFA-1α⁺ CD8⁺ T cells (e) per milligram tumor in second tumors in the LLC model (n = 7 per group). f Representative IF images showing ICAM-1 expression in control neutrophils versus N1_TNF-α⁺ neutrophils. g Percentage of ICAM-1+ neutrophils in control versus N1_TNF-α⁺ neutrophils, as determined by flow cytometry (n = 10 per group). h Experimental schematic of in vitro study evaluating the potential active synapse formation between neutrophils and CD8+ T cells. i T-cell proliferation in co-culture with N1_TNF-α⁺ neutrophils and αPD-1, with or without anti-LFA-1α (n = 9 per group). j–m T-cell activation under the co-culture conditions in (h): expression of 4-1BB, CD69, and CD25; representative flow-cytometry plots are shown in (m, red, T + αPD-1 + N1_TNF-α⁺-Neu; gray, T + αPD-1 + N1_TNF-α⁺-Neu + anti-LFA-1α; n = 10 per group). Tumor growth curves (n, o) and survival (p) of LLC-bearing mice treated with TRIDENT with or without anti-LFA-1α antibody (n = 8–9 per group). Data are mean ± SEM. Statistical significance was assessed by one-way ANOVA (d, e, i–l), Student’s t test (g, h), two-way ANOVA (n, o), or log-rank test for survival (p). *, P < 0.05; **, P < 0.01; ***, P < 0.001; ****, P < 0.0001
To test functional relevance, we co-cultured N1_TNF-α⁺ neutrophils with CD8⁺ T cells with or without LFA-1α-blocking antibody. LFA-1α inhibition reduced T cell proliferation (Fig. 5i) and activation (4-1BB, CD69, CD25) (Fig. 5j–m). Consistently, in vivo LFA-1α blockade in TRIDENT-treated tumor-bearing mice reduced second-tumor control and significantly shortened overall survival (Fig. 5n–p).
Together, these data establish ICAM-1-LFA-1 as a key molecular bridge mediating neutrophil-T-cell crosstalk in TRIDENT and supporting adhesion-dependent interactions consistent with immune synapse-like formation, particularly in LDRT-treated second tumors.
TRIDENT induces chemotactic and polarizing signals that recruit and program neutrophils toward an antitumor phenotype
To investigate how TRIDENT promotes the accumulation of antitumor neutrophils, we examined mechanisms of their recruitment (chemotaxis) and phenotypic programming (polarization) in the TME.
Tumors were harvested after no treatment, LDRT, or HDRT and cultured ex vivo to generate conditioned medium (Fig. 6a). Transwell migration assays showed that conditioned medium from LDRT-treated tumors significantly enhanced neutrophil migration versus medium from untreated or HDRT-treated tumors (Fig. 6b). Neutrophil recruitment by LDRT was validated in vivo in a bilateral tumor model in which only one tumor received LDRT. Twelve hours after adoptive transfer of CD45.1⁺ neutrophils, the LDRT-treated tumors contained significantly more transferred CD45.1⁺ neutrophils than the contralateral non-irradiated tumors (Fig. 6c, d). We next sought to delineate the chemotactic mechanisms underlying neutrophil accumulation in second tumors after TRIDENT. Single-cell transcriptomics showed consistent upregulation of Cxcr2 in neutrophils in the TRIDENT group compared with αPD-1 monotherapy and HDRT + αPD-1 (Fig. 6e). Flow cytometry likewise demonstrated increased frequencies of CXCR2⁺ neutrophils in second tumors from TRIDENT-treated mice (Fig. 6f). Assessing CXCR2 ligands after RT, qPCR revealed that LDRT markedly induced Cxcl1, Cxcl2, and Cxcl3 expression (Fig. 6g). Functionally, in vivo CXCR2 blockade (αCXCR2) significantly diminished abscopal tumor control conferred by TRIDENT (Fig. 6h– j), establishing the CXCL-CXCR2 axis as a key driver of neutrophil trafficking and systemic efficacy.

TRIDENT induces chemotactic and polarizing signals that recruit and program neutrophils toward an antitumor phenotype. a Schematic of the in vitro Transwell assay evaluating neutrophil migration toward tumor-conditioned medium derived from the indicated treatments. b Quantification of neutrophil migration across Transwell membranes (n = 4 per group). c Experimental design of the in vivo neutrophil-trafficking assay in a dual-tumor model after indicated therapy. d Representative flow cytometry plots and quantification of transferred CD45.1⁺ neutrophils in tumors (n = 7 per group). e Single-cell RNA-seq showing Cxcr2 upregulation in neutrophils from TRIDENT-treated tumors. Genes were classified as upregulated if increased in both comparisons, downregulated if decreased in both, oppositely regulated if significant in both but with opposite direction, and unchanged if non-significant in ≥1 comparison or showed minimal change. f Flow cytometric quantification of CXCR2⁺ neutrophils in second tumors in the LLC model across treatment groups (n = 7 per group). g Heatmap comparing relative mRNA expression of Cxcl1, Cxcl2, Cxcl3, and Cxcl5 from averaged qPCR values in tumor tissues after the indicated treatment (n = 4 per group). Tumor growth curves (h, i) and survival curve (j) of LLC-bearing mice treated with TRIDENT alone or with CXCR2 blockade (n = 9 per group). k, l qPCR analysis showing increased expression of Csf2 and Ifng in tumor tissues after indicated treatment (n = 4 per group). m–p Flow cytometric analysis of antigen presentation and co-stimulatory molecules (CD14, ICAM-1, MHC-I, and CD86) on neutrophils cultured with tumor-conditioned medium derived from control, LDRT-, or HDRT-treated tumors (n = 10 per group). Tumor growth curves (q, r) and survival curve (s) of LLC-bearing mice treated with TRIDENT alone or with GM-CSF/IFN-γ blockade (n = 6 per group). Data are mean ± SEM. Statistical significance was assessed by one-way ANOVA (b, f, g, k–p), Student’s t test (d), two-way ANOVA (h, i, q, r) or log-rank test for survival (j, s). *, P < 0.05; **, P < 0.01; ***, P < 0.001; ****, P < 0.0001
To identify signals driving polarization toward an antitumor state, tumors collected after LDRT or HDRT were analyzed by qPCR. Csf2 (encoding GM-CSF) and Ifng (encoding IFN-γ) were significantly upregulated after LDRT (Fig. 6k, l), suggesting upstream roles in neutrophil polarization. Consistently, when conditioned medium from irradiated tumors was applied to naïve neutrophils in vitro, flow cytometry showed increased expression of antigen presentation-related markers, including CD14, ICAM-1, MHC-I, and CD86, with strong induction observed with LDRT-conditioned medium (Fig. 6m–p). Notably, the functional capacity of N1_TNF-α⁺ neutrophils to activate CD8⁺ T cells was demonstrated in co-culture assays (Fig. 4l–n), underscoring the relevance of this polarization. Consistently, in vivo neutralization of GM-CSF and IFN-γ during TRIDENT treatment markedly impaired second tumor control and significantly shortened survival, establishing these cytokines as functionally required mediators of neutrophil polarization and systemic antitumor efficacy (Fig. 6q–s).
Together, these findings demonstrate that TRIDENT recruits neutrophils through a CXCL-CXCR2 axis and programs them toward an antitumor phenotype through GM-CSF and IFN-γ, thereby promoting their intratumoral accumulation and augmenting T cell-mediated antitumor immunity.
High-resolution spatial mapping corroborates N1_TNF-α+-mediated immune activation
To validate the in situ mechanisms underlying TRIDENT therapy in NSCLC, we analyzed paired baseline and post-treatment tumor samples from three NSCLC patients treated with TRIDENT using Visium HD spatial transcriptomics on FFPE sections (Fig. 7a).

High-resolution spatial mapping corroborates N1-mediated immune activation. a Study design and spatial profiling of NSCLC tumors before and after TRIDENT therapy. b Representative spatial transcriptomic maps showing spatial annotations deconvolved by RCTD. c Pathway enrichment analysis comparing post-treatment with baseline tumor tissues. d Dot plot showing log-fold changes (logFC) of major cell types across 11 niches defined by CellCharter. e Representative spatial niche map of a post-treatment tumor sample (patient #2). f Proportions of CD8⁺ T cells, neutrophils, and epithelial cells across the 11 identified niches. g Spatial diversity analysis. Left, heatmaps of the Shannon diversity index across tumor sections. Right, paired comparison of log2 fold changes (log2FC) in Shannon index between baseline and post-treatment samples. Center lines denote medians, boxes indicate interquartile ranges (IQR), and whiskers extend to 1.5×IQR. Paired comparisons were performed using paired t tests. (h–j) Pathway enrichment analyses of Niche 9 (h), Niche 8 (i), and Niche 5 (j). k Representative multiplex immunohistochemistry (mIHC) images showing MPO, CD14, ICAM-1, TNF-α, and CD8. Scale bars, 20 μm (left); 10 μm (right). l Schematic summarizing N1_TNF-α+ neutrophil-driven immune remodeling after TRIDENT therapy
Robust Cell Type Decomposition (RCTD) was applied to infer cell-type composition across spatial domains. Compared with baseline, post-treatment samples exhibited a pronounced shift toward an inflamed immune phenotype, with increased immune infiltration and activation (Fig. 7b and Supplementary Fig. 6a). Furthermore, pathway enrichment analysis revealed upregulation of antigen processing and presentation pathways, indicating a central role for these processes in TRIDENT-induced antitumor immunity (Fig. 7c).
To delineate the spatial organization of N1_TNF-α+ neutrophils within the TME following TRIDENT, we applied CellCharter to define niches based on transcriptional similarity and local cellular context. This analysis identified 11 spatial niches across all samples (Fig. 7d, e and Supplementary Fig. 6b). N1_TNF-α+ neutrophils localized predominantly in niches 5, 8, and 9; epithelial cells in niches 0 and 9, and CD8⁺ effector T cells in niches 1, 2, 5, and 10 (Fig. 7f). These niches exhibited distinct spatial distributions. Niche 9, enriched for epithelial cells and N1_TNF-α+ neutrophils, localized in tumor core regions corresponding to cancer nests. Following TRIDENT treatment, this niche displayed coordinated upregulation of antigen processing and transport pathways, suggesting enhanced processing of dying/dead tumor cells, potentially mediated by N1_TNF-α⁺ neutrophils (Fig. 7h). Niche 8, dominated by N1_TNF-α+ neutrophils with modest CD8⁺ T cell presence, aligned with tumor margins. It exhibited elevated chemokine and antigen presentation signaling, suggesting a role in immune cell recruitment at the tumor boundary, potentially facilitating immune infiltration toward the tumor core (Fig. 7i). Niche 5, shared by N1_TNF-α+ neutrophils, CD8⁺ effector T cells, and other immune populations, exhibited a marked increase in cellular diversity (Fig. 7d). This niche displayed neutrophil chemotaxis, activation of IFN-γ, and CD8⁺ T cell effector programs, positioning it as a key immunological hub that facilitates interactions between N1_TNF-α⁺ neutrophils and CD8⁺ effector T cells and potentially provides costimulatory support to CD8⁺ T cells (Fig. 7g, j).
Spatial co-localization analyses revealed preferential proximity between niche 8 and niche 9 (Supplementary Fig. 6c). Moreover, compared with baseline, TRIDENT-treated tumors showed increased co-localization of niche 5 with niches 8 and 9, indicating strengthened spatial coupling among inflammatory, neutrophil-rich, and epithelial regions (Supplementary Fig. 6d). Multiplex immunohistochemistry analysis of post-treatment tumor tissues further confirmed increased infiltration of MPO⁺TNF-α⁺CD14+ICAM-1⁺ neutrophils that spatially co-localized with CD8⁺ T cells (Fig. 7k).
Collectively, though from a limited cohort of three paired patient samples, these findings provide exploratory translational support for a working model in which TRIDENT remodels the TME through an N1_TNF-α⁺ neutrophil-associated cascade: N1_TNF-α+ neutrophils infiltrate tumor nests to sample dying/dead tumor cells and process antigens, form a chemotactic frontier at the tumor margin to guide CD8⁺ T cells, and subsequently converge with effector populations in inflammatory hubs, orchestrating local immune activation and cytotoxic responses that drive tumor regression (Fig. 7l).
N1_TNF-α⁺ neutrophil activation correlates with clinical outcomes
We next examined the association between neutrophil activation and treatment outcomes across several patient cohorts. First, we explored the prognostic significance of peripheral blood neutrophils in our retrospective cohort of NSCLC patients treated with TRIDENT-based therapy. Patients were stratified by changes in absolute neutrophil counts pre- and post-treatment. Kaplan–Meier analysis showed significantly longer PFS in the Neu_high group (16.5 months) compared with the Neu_low group (7.7 months) (Supplementary Fig. 7a, b). To extend these findings, tumor transcriptomic data from four NSCLC datasets (GSE135222, GSE136961, GSE190265, and GSE190266) in the Gene Expression Omnibus (GEO) database were analyzed. Across cohorts, higher intratumoral N1_TNF-α⁺ neutrophil-associated gene signature scores were consistently associated with longer PFS, underscoring the clinical relevance of neutrophil activation (Fig. 8a–d). Finally, the association between N1_TNF-α⁺ neutrophils and clinical outcomes was evaluated in our observational cohort of 12 patients with advanced lung cancer receiving radioimmunotherapy (Fig. 8e and Supplementary Table 3). Responders (n = 8 patients with partial response, PR) showed significant post-treatment increases in TNF-α⁺, CD14⁺, TNF-α⁺CD14⁺, and TNF-α⁺ICAM-1⁺ neutrophils, whereas no such increases were observed in non-responders (n = 4 patients with stable or progressive disease, SD/PD) (Fig. 8f–i). These findings indicate that higher levels of N1_TNF-α⁺ neutrophils are associated with improved clinical responses.

TNF-α⁺ neutrophil activation correlates with clinical outcomes. a–d Survival analyses of NSCLC patients across four independent GEO cohorts stratified by N1_TNF-α+ neutrophil gene signature scores derived from our scRNA-seq data. e Schematic of an observational study evaluating the predictive role of N1_TNF-α⁺ neutrophils in patients with advanced lung cancer receiving RT plus anti-PD-1 therapy. A total of 12 patients were included (PR = 8; SD/PD = 4). f–i Flow cytometric quantification of TNF-α⁺ (f), CD14⁺ (g), TNF-α⁺CD14⁺ (h), and TNF-α⁺ICAM-1⁺ (i) neutrophils before and after treatment, stratified by response status. j Graphical abstract. Created in BioRender (Zhou, L. (2026) https://BioRender.com/9qrob03). Data are mean ± SEM. Statistical significance was assessed by log-rank test for survival (a–d) or paired t test (f–i). *, P < 0.05; **, P < 0.01; ***, P < 0.001; ****, P < 0.0001
In summary, treatment-associated increases in neutrophils, particularly N1_TNF-α⁺ subsets, correlated with improved clinical outcomes across cohorts. This clinical association aligns with the mechanistic role of N1_TNF-α⁺ neutrophils in antitumor immunity identified in this study and highlights their potential as biomarkers of therapeutic response.