
Tubule-specific deletion of Ninj1 protects against AKI-CKD progression
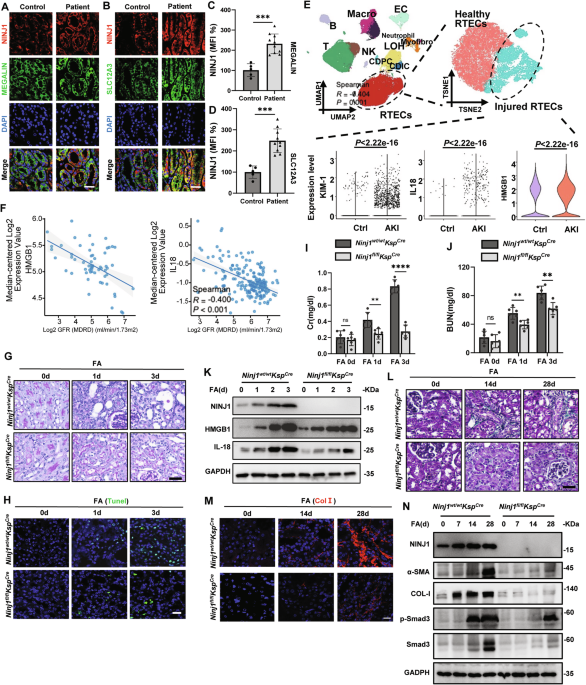
In human patients with Acute Kidney Injury (AKI) (Supplementary Table 1 and Supplementary Fig. 1A), we observed NINJ1 upregulation in both proximal and distal tubules (Fig. 1A–D). In addition, single-cell sequencing revealed significantly increased expression of Interleukin-18 (IL-18), High Mobility Group Box 1 (HMGB1) and Kidney injury molecule 1 (KIM-1) in human AKI proximal renal tubular epithelial cells (RTECs) (Fig. 1E). What’s more, IL-18 and HMGB1 were negatively correlated with AKI prognosis, as judged by Glomerular Filtration Rate (GFR) (Fig. 1F). Hence, we interpreted that NINJ1 contributed to the development from AKI to CKD.

A Immunofluorescence staining of NINJ1 of renal biopsy sections from human patient. NINJ1(red), Megalin (green), DAPI (blue). Scale bar = 60 μm. (B) Immunofluorescence staining of NINJ1 of renal biopsy sections from human patient. NINJ1(red), SLC12A3 (green), DAPI (blue). Scale bar = 60 μm. C-D Quantification of NINJ1 Immunofluorescence intensity presented in (A) and (B). Data were normalized to the mean intensity of the Health group to generate relative expression values (MFI 100%). Results are presented as mean ± standard deviation (SD). *p < 0.05, **p < 0.01, ***p < 0.001, ****p < 0.0001. ns indicates non-significant results. E (Top left) UMAP projection of single-cell transcriptomes from 8 human kidney samples, including 3 paracancerous kidney tissues (GSE131685) and 5 acute kidney injury (AKI) renal biopsy specimens. Major parenchymal and immune cell populations are annotated: T cells, B cells, NK (NK cells), Macro (Macrophage), Neutropgil, PTC (proximal tubular cells), CDIC (collecting duct intercalated cells), CDPC (collecting duct principal cells), LOH (loop of Henle cells), EC (endothelial cells), and Myofibro(myofibroblasts). (Top right) Reclustering of the PTC subset from panel A using t-SNE identified two transcriptional states: healthy PTCs and injured PTCs. (Bottom) Expression of HMGB1, IL1B, and HAVCR1 genes within the injured PTC cluster. Two-sided Wilcoxon rank-sum p values. F Data derived from the Nephroseq database. (Left) HMGB1 expression in renal cortical biopsy samples from kidney transplant patients is negatively correlated with GFR. (Right) IL18 expression in renal tubular epithelial cells (RTECs) from CKD patients is negatively correlated with GFR. G Representative images of PAS-stained kidney sections after intraperitoneal injection of folic acid (FA), Scale bar = 100 μm. H Representative images of TUNEL staining in kidney sections after FA administration. Scale bar = 50 μm. I Concentration of Serum creatinine (Cr) in Ninj1fl/fl and Ninj1wt/wt mice at the indicated time points. J Concentration of Blood urea nitrogen (BUN) in Ninj1fl/fl and Ninj1wt/wt mice at the indicated time points. K Western blot analysis examining the expression of NINJ1 and the indicated DAMPs (IL-18, HMGB1). GAPDH was used as a loading control. L Representative images of Masson trichrome staining of kidney sections after FA administration. Scale bar = 60 μm. M Representative images of immunofluorescence staining of collagen Ⅰ (Col I) in kidney sections. Scale bar = 50 μm. N Western blot analysis examining the expression of Ninj1, the indicated DAMPs (IL-18, HMGB1), renal fibrosis-associated protein (α-SMA, ColⅠ, Smad and p-Smad) in kidney tissue lysates. GAPDH was used as control.
To investigate the role of NINJ1 in Kidney Injury, we induced AKI-CKD in mice via intraperitoneal injection of 200 mg/kg folic acid (FA). Immunofluorescence staining showed a substantial upregulation of NINJ1 expression in RTECs following FA administration (Supplementary Fig. 1B, C), supporting the observation we had in human samples. We subsequently asked whether specific deletion of Ninj1 in renal tubules (Ninj1fl/flKspcre) (Supplementary Fig. 1D–I) would ameliorate kidney injury. Three days post-FA injection, Ninj1fl/flKspcre mice exhibited markedly less tubular dilation, reduced tubular damage, decreased nuclear fragmentation, and attenuated interstitial inflammatory cell infiltration, compared with their wild-type (WT) littermates (Ninj1wt/wtKspcre) (Fig. 1G and Supplementary Fig. 1J). Furthermore, a reduction in cell death was confirmed by TUNEL staining in the Ninj1fl/flKspcre group (Fig. 1H and Supplementary Fig. 1K), accompanied with the mitigated upregulation of creatinine (Cr), blood urea nitrogen (BUN), IL-18 and HMGB1 level, suggesting an NINJ1-dependent cell damage upon FA administration (Fig. 1I–K, Supplementary Fig. 1L–1N). These data shed light on the idea that NINJ1 contributes to renal tubular cell damage and the subsequent inflammatory response that drives the progression of FA-induced AKI.
Beyond mitigating the acute injury features, Ninj1 deletion in renal tubules also prevented the progression to Chronic Kidney Disease (CKD). Overall, renal fibrosis quantified by Masson trichrome staining, and the deposition of Collagen I (COL-I) quantified by immunofluorescence, were significantly reduced in the Ninj1fl/flKspcre group (Fig. 1L, M, Supplementary Fig. 1O, P). Consistent with these pathological observations, the expression of key fibrosis markers, including α-smooth muscle actin (α-SMA), COL-I, and phospho-Smad3 (p-Smad3), was also downregulated following Ninj1 deletion (Fig. 1N, Supplementary Fig. 1Q–U).
These findings collectively demonstrate that tubule-specific deletion of Ninj1 significantly mitigates the progression from AKI to CKD by preventing renal tubular cell death and inhibiting the subsequent inflammatory cascade.
Tubule-specific deletion of Ninj1 attenuates NETs formation and MMT
Inflammatory responses are major sequelae of kidney injury. We therefore examine the role of Ninj1 in modulating the inflammation in renal tubules. In WT mice, the infiltration of neutrophils and macrophages—identified by the cell-specific markers Ly6G+ and F4/80+, respectively—was elevated on post-FA administration day 3 and continued to increase steadily through day 14. Of note, the deletion of Ninj1 significantly decreased the numbers of both infiltrated cell types (Fig. 2A–D, Supplementary Fig. 2).

A–D Flow cytometry showing the percentage of neutrophil (Ly6G+) and macrophage (F4/80+) infiltrated in the kidney on day 0, 3, 14, and 28 after FA treatment. E Representative immunofluorescence co-staining of DNA (Hochest), CiH3 (citrullinated histone-3) and MPO (myeloperoxidase) to assess NETs formation after FA treatment. Samples were collected on day 14 after FA administration. F Percentage of NETs positive area presented in (E). n = 6. G Representative immunofluorescence co-staining of α-SMA and F4/80 to estimate the degree of macrophage-myofibroblast transition (MMT). Scale bar = 50 μm. H Percentage of α-SMA+F4/80+ cells presented in (G). n = 6. I ELISA measurement of TGF-β1 after FA treatment. n = 6. *p < 0.05, **p < 0.01, ***p < 0.001, ****p < 0.0001. ns indicates non-significant results.
Inflammatory-activated neutrophils can release citrullinated histones (CiH3)-containing chromatin fibers, and other intracellular molecules, such as myeloperoxidase (MPO), to form neutrophil extracellular traps (NETs), which participating renal fibrosis. Following FA administration, WT mice showed pronounced NETs deposition localized in the renal intersitium. In contrast, the specific deletion of Ninj1 in renal tubules markedly attenuated NET formation (Fig. 2E, F). In line with the reduced neutrophil activation observed in the Ninj1fl/flKspcre group, the lessened expression of α- smooth muscle actin (α-SMA) and Transforming Growth Factor-β1 (TGF-β1) suggests a reduction in macrophage-myofibroblast transition (MMT), a process critical to AKI-CKD progression (Fig. 2G–I). These findings demonstrate the upregulation of NINJ1 in renal tubulars facilitated inflammation, NETs release and MMT, leading to renal fibrosis during AKI-CKD progression.
NINJ1-dependent renal tubular cell membrane rupture drove NETs formation and MMT
The in vivo results pinpoint that the presence of NINJ1 facilitates RTECs death, leading to inflammatory responses. The damaged cells releasing Damage-Associated Molecular Patterns (DAMPs), including Lactate Dehydrogenase (LDH) and HMGB1, depends on NINJ1-mediated membrane rupture. Subsequently, DAMPs trigger more inflammatory reactions. We leveraged the well-established in vitro Calcium Oxalate (CaOx) injury model to determine whether RTECs death could induce inflammation in the context of renal tubule injury [39,40,41]. After 10 h of CaOx incubation, we observed increased RTEC death, which was significantly suppressed by the deletion of Ninj1 (Fig. 3A). Consistent with this observation, the concentrations of LDH and HMGB1—two canonical markers for plasma membrane rupture—in the supernatant were markedly elevated. Notably, such CaOx-induced cell death and membrane rupture were NINJ1-dependent as Ninj1 deletion significantly reduced both LDH and HMGB1 release (Fig. 3B–D).

A Microscopic images of PI-stained proximal tubule epithelial cells (RTECs) treated with or without CaOx. PI (Red). Scale bar = 100 μm. B Assessment of LDH release of Ninj1−/− RTECs after CaOx treatment. n = 6. C ELISA determining the concentration of HMGB1 in the supernatant of Ninj1−/−RTEC after CaOx treatment. n = 6. D Western blot analysis of HMGB1 released in the supernatant of RTECs after CaOx treatment. GAPDH was used as the loading control. E Schematic illustration of MMT experimental design. F Western blot analysis of MMT-associated proteins in Bone Marrow-Derived Macrophages (BMDM) supplemented with CaOx and RTEC supernatants for the indicated duration of time. GAPDH was used as the loading control. G Western blot analysis of Smad proteins in Bone Marrow-Derived Macrophages (BMDM) supplemented with CaOx and RTEC supernatants for 48 h. TGF-β served as a positive control. GAPDH was used as the loading control. H Immunofluorescence analysis of BMDM incubated with CaOx-treated Ninj1wt/wtKspCre or Ninj1fl/flKspCre RTEC supernatant. α-SMA (green), p-Smad (red) and nuclei (DAPI, blue) were visualized. Scale bar = 20 μm. I Quantitative analysis of MMT positive area in (H). n = 6. J Schematic illustration of NETs formation experimental design. K Immunofluorescence analysis of BMDNs incubated with CaOx-treated Ninj1wt/wtKspCre or Ninj1fl/flKspCre RTEC supernatants, showing colocalization of CitH3 (red), MPO (green), and DNA (blue). Scale bar = 10 μm. n = 6. L Quantification of NETs positive area in (K). n = 6. *p < 0.05, **p < 0.01, ***p < 0.001, ****p < 0.0001. ns indicates non-significant results.
Primary RTECs were isolated and cultured with or without CaOx, and the resulting supernatant was then collected and applied to Bone Marrow-Derived Macrophages (BMDMs) (Fig. 3E). After being incubated with the supernatant from the CaOx-treated WT RTEC culture, BMDMs exhibited elevated expression of the fibrotic markers α-smooth muscle actin (α-SMA) and Collagen I (Col-I), alongside increased Smad3 phosphorylation (Fig. 3F, G), implying an activation of fibrosis. Immunofluorescence staining further confirmed that α-SMA was overexpressed and phospho-Smad3 (p-Smad3) was translocated to the nucleus, collectively indicating macrophages undergoing MMT (Fig. 3H, I). In contrast, when BMDMs were treated with the supernatant from the Ninj1-deleted RTECs (Ninj1fl/flKspcre) culture post-CaOx injury, the upregulation of all MMT-related markers, and MMT itself, was significantly suppressed (Fig. 3F–I).
Similarly, the supernatant from the CaOx-incubated WT RTECs culture induced NETs (Fig. 3J), as characterized by MPO staining and CiH3 staining. Evidently, this process was mitigated when Ninj1 was deleted in RTECs (Fig. 3K, L). Together, these data demonstrate that NINJ1-dependent DAMPs released by injured RTECs promote both MMT and NETs formation.
NINJ1 oligomerization is required for plasma membrane rupture and HMGB1 release from RTECs
We next investigated the mechanism governing the release of pro-inflammatory molecules from RTECs and the subsequent activation of immune cells. Immunofluorescence staining validated that NINJ1 underwent oligomerization to mediate the membrane rupture under the CaOx condition, evidenced by the characteristic spot-like aggregates of NINJ1 (Fig. 4A–C). In contrast, the NINJ1 oligomerization mutant NINJ1K45Q exhibited a different pattern where monomeric population was predominant (Fig. 4C–F).

A Representative images of immunofluorescence staining of RTECs to detect localization of NINJ1 after CaOX treatment, NINJ1 (Red), cytomembrane (WGA, green) and nucleus (Hoechst, blue). Scale bar = 10 μm. B Structural illustration of NINJ1. C Representative images of immunofluorescence staining of Ninj1fl/flKspcre RTEC transinfected with NINJ1WT (Red) and NINJ1K45Q (Red) after CaOX treatment. Scale bar = 10 μm. D Quantitively analysis of oligomerized NINJ1 in (C). E The oligomerized NINJ1 was detected by blue native PAGE and the transfection efficiency of NINJ1 was detected by SDS-PAGE. GAPDH was used as control. F Quantification of NINJ1 oligomerization. NINJ1 oligomeric bands (1mer, 2mer, 4mer, 6mer) were quantified by densitometric analysis. The relative abundance of each oligomer was determined as the percentage of its band intensity relative to the total intensity of all oligomeric bands (1mer+2mer+ 4mer+6mer) in the lane. Data are expressed as mean ± SD (or SEM) and compared between experimental groups. G (upper panel) Microscopic images of PI stained Ninj1fl/flKspcre RTEC transinfected with NINJ1WT and NINJ1K45Q after CaOX treatment. (lower panel) the quantification of percentage of PI positive cells. H ELISA determining the concentration of HMGB1 in the supernatant of Ninj1fl/flKspcre RTEC transinfected with NINJ1WT and NINJ1K45Q after CaOX treatment. I Western blot to detect the levels of HMGB1 and NINJ1. GAPDH was used as control. n = 6. *p < 0.05, **p < 0.01, ***p < 0.001, ****p < 0.0001. ns indicates non-significant results.
Previously, we showed that FA-induced HMGB1 upregulation in vivo was suppressed by Ninj1 deletion in RTECs (Fig. 1K). CaOx exposure recapitulated the FA phenotype in vitro (Fig. 3D). We further asked whether the HMGB1 release is facilitated by the NINJ1 oligomerization, which is crucial for NINJ1-mediated membrane disruption. To test this, we expressed either Ninj1 or Ninj1K45Q in Ninj1fl/flKspcre RTECs. Under CaOx condition, the cells expressing NINJ1 exhibited noticeable cell death, while those expressing NINJ1K45Q showed less cell death that was comparable to the Ninj1 null group (Fig. 4G). Consistently, HMGB1 release from Ninj1K45Q cells was significantly reduced compared with that from Ninj1 cells (Fig. 4H, I). Collectively, these results establish that the oligomerization of NINJ1 is required to promote plasma membrane rupture and the subsequent release of DAMPs upon kidney injury.
Tubule-specific deletion of Hmgb1 mitigates AKI-CKD progression
Given the observed upregulation and release of the DAMP HMGB1 following NINJ1-mediated cell death (Figs. 1K and 3D), we hypothesized that the tissue-specific deletion of Hmgb1 would mitigate the progression from AKI to CKD. To investigate this, we first treated RTECs with recombinant HMGB1 (rHMGB1) in the presence of CaOx. However, renal tubular cells displayed no reduction in cell viability (Supplementary Fig. 3A, B). We then subjected Hmgb1fl/flKspcre mice (Supplementary Fig. 4A) to FA administration. During the acute kidney injury (AKI) stage (up to 3 days post-FA exposure), tubule-specific Hmgb1-deleted mice exhibited no significant differences of Cr and BUN levels compared with their WT littermates (Hmgb1wt/wtKspcre) (Fig. 5A, B). Consistently, tubular damage, assessed by PAS, was also comparable between groups (Fig. 5C, D). By contrast, deleting Hmgb1 significantly prevented AKI-CKD transition, with alleviating renal fibrosis. This was evidenced by reduced Masson Trichrome staining and diminished signals for α-SMA, F4/80, MPO, CiH3 and Col I in kidney sections collected at 14 and 28 days post-FA exposure (Fig. 5E–H, Supplementary Fig. 4B–D). Consistently, in vitro, MMT and NETs formation were significantly ameliorated with the supernatant stimulation from CaOx -treated Hmgb1−/− RTECs (Fig. 5I–L).

A Concentration of Serum creatinine (Cr) in Hmgb1fl/fl and Hmgb1wt/wt mice at the indicated time points. n = 6. B Concentration of Blood urea nitrogen (BUN) in Hmgb1 wildtype or Hmgb1 KO mice at the indicated time points. n = 6. C Representative images of PAS-stained kidney sections after intraperitoneal injection of FA, Scale bar = 60 μM. D Tubular injury score measured on PAS-stained kidney sections. n = 6. E Representative images of Masson trichrome staining of kidney sections after FA treatment. Scale bar = 60 μm. F Quantitative analysis of Masson positive area. n = 6. G Representative immunofluorescence co-staining of α-SMA and F4/80 to estimate the degree of macrophage-myofibroblast transition (MMT) after FA treatment. Scale bar = 50 μm. H Representative immunofluorescence co-staining of DNA (Hochest), CiH3 (citrullinated histone-3) and MPO (myeloperoxidase) in kidney sections after FA treatment. Scale bar = 50 μm. I Representative immunofluorescence co-staining of α-SMA (green) and p-Smad (red) after Calcium Oxalate (CaOx) treatment. Scale bar = 50 μm. J Representative immunofluorescence co-staining of DNA (Hochest), CiH3 (citrullinated histone-3) and MPO (myeloperoxidase) to assess NETs formation after CaOx treatment. K Percentage of α-SMA+p-Smad+ cells in (I). n = 6. L Percentage of NETs positive area in (J). n = 6. *p < 0.05, **p < 0.01, ***p < 0.001, ****p < 0.0001. ns indicates non-significant results.
These findings strongly support the notion that RTEC-derived HMGB1 plays a critical role in AKI- CKD transition, primarily by mediating renal inflammation and promoting fibrosis rather than acute cell injury.
TRIM72 ubiquitinates and degrades NINJ1
As the renal injury-induced inflammatory response requires NINJ1 to releases HMGB1 from the RTECs, we sought to identify the mechanism to regulate NINJ1 degradation. Using mass spectrometry, we identified a key ubiquitination site at lysine 111 (K111) of NINJ1 (Fig. 6A and Supplementary Fig. 5).

A Mass spectrum (MS) result of NINJ1 with indicated amino acid sequence, in which K111 was shown to be ubiquitinated. B Western blot analysis examining the expression of TRIM72 in RTECs treated with CaOx. GAPDH was used as a loading control. C Immunofluorescence staining of TRIM72 of renal biopsy sections from human patient. TRIM72 (red), Megalin (green), DAPI (blue). Scale bar = 60 μm. D Immunofluorescence staining of TRIM72 of renal biopsy sections from human patient. TRIM72 (red), SLC12A3 (green), DAPI (blue). Scale bar = 60 μm. E Immunofluorescence staining of TRIM72 and NINJ1 of renal biopsy sections from human patient. TRIM72 (red), NINJ1 (green), DAPI (blue). Scale bar = 60 μm. F Western blot analysis examining the expression of NINJ1 in RTECs treated with CaOx in presence of MG132 and/or BAF A1. GAPDH was used as a loading control. G Quantification of NINJ1 presented in (F). H Immunofluorescence staining of TRIM72 and NINJ1 in CaOx-treated RTECs in presence of MG132 or BAF A1. Scale bar = 10 μm. I Co-IP analysis of NINJ1 ubiquitination and NINJ1-TRIM72 interaction in HEK293T cells with the presence of MG132 and/or BAF A1. GFP-TRIM72 was immobilized on protein A beads. Flag-NINJ1 was co-precipitated. J The oligomerized-NINJ1 was detected by blue native PAGE while TRIM72 was overexpressed. The transfection efficiency of NINJ1 and TRIM72 were detected by SDS-PAGE. GAPDH was used as a loading control. K The oligomerized-NINJ1 and -NINJ1K111A were detected by blue native PAGE while TRIM72 was overexpressed. The transfection efficiency of NINJ1 and TRIM72 were detected by SDS-PAGE. GAPDH was used as a loading control. L Microscopic images of PI stained Ninj1wt/wtKspcre RTEC transinfected with Flag-TRIM72 after CaOX treatment. M Percentage of PI positive cells. n = 6. *p < 0.05, **p < 0.01, ***p < 0.001, ****p < 0.0001. ns indicates non-significant results. N Western blot analysis of released HMGB1 and IL-18 in the supernatant of CaOx-treated RTECs culture. GAPDH was used as a loading control. O ELISA determining the concentration of HMGB1 in the supernatant of CaOx-treated NINJ1 WT or NINJ1K111A RTEC overexpressing TRIM72. n = 6. P Assessment of LDH release of CaOx-treated NINJ1 or NINJ1K111A RTECs overexpressing TRIM72. n = 6. *p < 0.05, **p < 0.01, ***p < 0.001, ****p < 0.0001. ns indicates non-significant results.
Among the E3 ligase candidates, serval TRIM family members are well-known that they are recruited on the inner leaflet of PM and repaired the damaged PM [23, 25, 26, 29, 32, 42]. We tested several TRIM members and found TRIM72 was downregulated in both proximal and distal tubules in CaOx and FA mouse model (Fig. 6B, Supplementary Fig. 6A–D). In line with the mouse models, we found similar reduction of TRIM72 in human AKI patients (Fig. 6C, D, Supplementary Fig. 6E, F), which negatively corelated with NINJ1 upregulation (Fig. 6E). Therefore, we surmised that TRIM72 ubiquitinates NINJ1, and overexpressing TRIM72 in injured RTECs could re-establish the ability to suppress NINJ1 protein level. As judged by immunoblotting, overexpressing TRIM72 significantly suppressed the CaOx-induced NINJ1 upregulation (Fig. 6F, G). To validate whether ubiquitination of NINJ1 leads to its protein degradation, we treated cells with the proteasome inhibitor (MG132) and/or lysosome inhibitor (Bafilomycin A1, BAF A1) to block NINIJ1 degradation. Single treatment with either MG132 or BAF A1 partially restored the CaOx-induced elevation in NINJ1 protein level, and the combinational effect of the inhibitors was even more profound (Fig. 6F, G). Consistent with the biochemistry data, NINJ1 protein accumulated and translocated onto the PM in the presence of the proteasomal/lysosomal inhibitors (Fig. 6H).
We subsequently used a biochemical approach to test if NINJ1 was directly ubiquitinated by NINJ1. Immunoprecipitation demonstrated that TRIM72 interacted with NINJ1, and this interaction resulted in the ubiquitination of NINJ1 in the presence of exogenous ubiquitin (Fig. 6I). Consistent with our mass spectrometry data, the NINJ1K111A mutant lost its susceptibility to ubiquitination, though its binding affinity for TRIM72 was retained (Supplementary Fig. 6G). Similarly, deleting the RING domain of TRIM72 to disrupt E2-E3 interactions resulted in a substantial reduction of NINJ1 ubiquitination (Supplementary Fig. 6H, I). These results demonstrate that TRIM72 is the E3 ligase for NINJ1.
To test if ubiquitination inhibits NINJ1 oligomerization independently of its degradation, we quantified the signal intensity of NINJ1 oligomer populations (monomer, dimer, tetramer, hexamer) according to their molecular weight. Our results showed that TRIM72 overexpression did not alter the percentage of each oligomer population (Fig. 6J, Supplementary Fig. 6J). In addition, when wild-type NINJ1 or the NINJ1-K111A mutant (which resists ubiquitination) was expressed with or without TRIM72 overexpression, we found the oligomerization profile of NINJ1-K111A was indistinguishable from that of wild-type NINJ1 (Fig. 6K, Supplementary Fig. 6K). Collectively, these data confirm that both enhanced and compromised NINJ1 ubiquitination do not affect its oligomerization.
Consistent with the NINJ1 decrease, we observed a reduced percentage of dead cells, as determined by propidium iodide (PI) staining (Fig. 6L, M). Meanwhile, the release of lactate dehydrogenase (LDH) and HMGB1 into the culture medium was significantly decreased when deleting NINJ1 (Fig. 6N–P). It is noteworthy that the NINJ1-K111A mutant, which is capable of forming oligomers and not ubiquitinated by TRIM72, restored the cell lytic function of NINJ1 (Fig. 6N–P). In sum, these findings confirm that TRIM72 recognizes, binds, and ubiquitinates NINJ1, targeting it for degradation.
Overexpressing TRIM72 mitigates NINJ1-mediated AKI-CKD progression
The demonstrated role of TRIM72 in ubiquitinating NINJ1, coupled with the upregulation of NINJ1 in injured RTECs in vitro and in vivo led us to investigate whether TRIM72 acts as a key regulator governing the NINJ1 stability to protect the cell from lytic death and, consequently, mitigate AKI-CKD progression.
We utilized an Adeno-Associated Virus (AAV) system to specifically overexpress TRIM72 in the kidney (Fig. 7A). The KSP-TRIM72-EGFP mice exhibited less severe tubular injury when subjected to FA administration, compared with the EGFP control (Fig. 7B, C). Consistent with the histological evidence, the serum creatinine (Scr) levels and blood urea nitrogen (BUN) were also significantly reduced upon TRIM72-EGFP overexpression, indicating a reduction in AKI (Fig. 7D, E). Furthermore, overexpressing TRIM72 in the 28-day FA-treated kidney mitigated overall renal fibrosis (Fig. 7F, G), and attenuated infiltration of immune cells, i.e. macrophages and neutrophils, as indicated by diminished F4/80 and Ly6G signal, respectively (Supplementary Fig. 7A–D).

A In vivo imaging revealed the efficiency of AAV administered via renal pelvic injection. B Representative images of PAS-stained kidney sections from AAV2/9-KSP-EGFP or AAV2/9-KSP-TRIM72-EGFP mice after intraperitoneal injection of FA, Scale bar = 100 μm. C Tubular injury score of PAS staining in (B). D Measurement of serum creatinine (Scr) levels in AAV2/9-KSP-EGFP or AAV2/9-KSP-TRIM72-EGFP mice at the indicated time points after FA treatment. E Measurement of blood urea nitrogen (BUN) levels in AAV2/9-KSP-EGFP or AAV2/9-KSP-TRIM72-EGFP mice at the indicated time points after FA treatment. F Representative images of Masson trichrome staining of kidney sections AAV2/9-KSP-EGFP or AAV2/9-KSP-TRIM72-EGFP mice at the indicated time points after FA treatment. Scale bar = 60 μm. G Quantitative analysis of Masson positive area in (F). H Schematic model illustrating NINJ1 degradation by TRIM72-mediated ubiquitination preserves plasma membrane integrity and mitigates AKI-CKD Progression.
In conclusion, these data strongly suggest the existence of a TRIM72-NINJ1-HMGB1 axis that regulates renal injury-induced inflammation and the subsequent progression from AKI to CKD (Fig. 7H).