
Exogenous DNA damage drives Cdkn1a (p21)+ senescence in macrophages in vitro
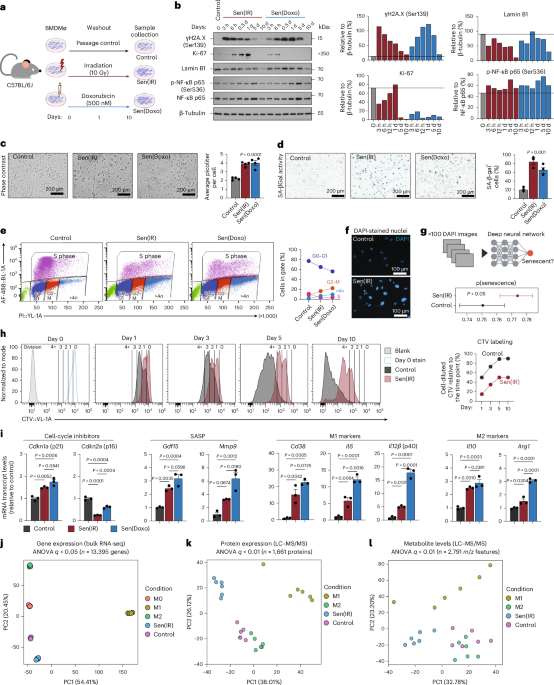
To test whether macrophages can undergo an irreversible and stable form of cellular senescence, mouse bone marrow-derived macrophages (BMDMs) were subjected to ionizing irradiation (IR) or doxorubicin (Doxo) (Fig. 1a). Ten days after DNA damage, we observed a decrease in the proliferation marker Ki-67 and Lamin B1, a nuclear protein whose expression decreases with senescence (Fig. 1b). We also observed increased pNF-κB, which likely results from the acquisition of cellular senescence and not activation of the acute DNA damage response, because it occurs post gain and loss of pH2A.X24. In support, we found that both IR and Doxo increased cell size and elevated SA-β-gal activity, leaving cells arrested in the G2–M phase, accompanied by >4 N genomes (Fig. 1c–e). DAPI imaging showed that control macrophages had a uniform nuclear size and shape, whereas IR- and Doxo-treated macrophages were larger and irregularly shaped (Fig. 1f). Machine learning and neural network tools have been deployed to identify senescent cells from nonsenescent cells using nuclear imaging derived from DAPI-stained cells25. Using this approach, we found that the probability of IR-treated macrophages being senescent is greater than that for control cells (Fig. 1g). To further examine this, macrophages were stained with a CellTrace Violet (CTV) dye before IR. Interestingly, ~20% of labeled cells divided 1 day post IR, but all cells stopped dividing between 5 and 10 days, suggesting a stable cell-cycle arrest phenotype (Fig. 1h). Collectively, our data show senescent macrophages acquire multiple hallmarks of senescence, including permanent cell-cycle arrest, 10 days post IR or Doxo, and they are referred to here as Sen(IR) or Sen(Doxo), respectively.

a, The in vitro model system using exogenous DNA damage with irradiation and Doxo from male C57BL/6J mice. b, SDS–PAGE gels and immunoblotting (western blot) with ImageJ quantification relative to loading control. c, Representative phase contrast images as well as cell volume quantification via flow cytometry. Average ± s.e.m. cell volume (pl) of n = 4 biological replicates. P value derived from ANOVA. d, SA-β-Gal images and average ± s.e.m. percent positive cell quantification by microscopy at ×20 magnification. n = 3 biological replicates. P value from ANOVA. e, Click-iT EdU labeling with propidium iodide (PI) labeling of cells to assess cell-cycle dynamics. Axes represent the percentage of cells positive for the stain, compared to the parental gate, as detected by flow cytometry. f, Representative images of control and senescent macrophages, DAPI-stained nuclei at ×20 magnification. g, Probabilistic deep-learning algorithm to generate a predicted senescence score. Average score ± 95% confidence interval, of 100 biologically independent DAPI images. P value derived from a two-sided t-test. h, CTV staining 24 h post IR. Dilution of CTV was performed at the represented time points via flow cytometry. Percent cells that diluted CTV from the previous day were quantified and trendlines are shown (right). i, Mean ± s.e. mRNA transcript levels (reverse transcription-quantitative polymerase chain reaction (RT–qPCR)) normalized to control. n = 3 biological replicates. P value derived from Tukey’s test post-ANOVA analysis. j, PCA on bulk RNA-seq samples from day 7 BMDMs either unactivated (M0), or treated with 12 h of 100 ng ml−1 LPS (M1) or 18 h of 10 ng ml−1 IL-4 (M2), compared to senescent macrophages (Sen(IR), 10 days post irradiation) and (control) unactivated macrophages cultured for 10 days alongside senescent macrophages. k, PCA projections from senescent macrophages (Sen(IR), 10 days post irradiation), passage control condition (control) and passage control plus LPS (M1) or IL-4 (M2). l, PCA analysis from senescent macrophages (Sen(IR), 10 days post irradiation), passage control condition (control) and passage control plus LPS (M1) or IL-4 (M2). BMDMø, bone marrow-derived macrophage; p(senecence), predicted senescence. Panel a created in BioRender; Salladay-Perez, I. https://biorender.com/6umuckd (2026).
Source data
Senescent cells are characterized by increased expression of cell-cycle inhibitor genes, such as Cdkn1a (p21) and Cdkn2a (p16), as well as SASP genes. Accordingly, we measured the expression levels of these genes in Sen(IR) and Sen(Doxo) macrophages. We found that Gdf15, Mmp9 and Cdkn1a, but not Cdkn2a, were upregulated in senescent macrophages relative to control (Fig. 1i). Of note, most studies investigating senescent macrophages have used expression of Cdkn2a (p16) as a positive indicator of macrophage senescence or p16 reporter mice to identify and target these cells for clearance13,14,17,18. To investigate whether p16 expression can be used to target senescent macrophages, we obtained BMDMs from a transgenic mouse model that contains a tri-modality reporter (3MR) on the p16 locus (p16-3MR)26. One of the three reporters drives apoptosis via ganciclovir (GCV) treatment. Interestingly, we found that p16-3MR senescent macrophages were resistant to cell death and apoptosis, while control macrophages were more sensitive to GCV (Extended Data Fig. 1a–c). These data suggest that senescent macrophages downregulate p16, relative to control cells, sparing them from apoptosis. In fact, in a previous study27, we found that in Doxo-treated p16-3MR mice, GCV reduced Cdkn2a mitochondrial RNA expression in the liver but not Cdkn1a. Therefore, p16+ and p21+ senescent cells can be distinct populations in aging tissues, as supported by recent studies showing divergent SASP programs and trajectories for p16⁺ versus p21⁺ senescent cells across tissues28,29. In addition to p21, we also discovered that senescent macrophages express canonical markers of M1 and M2 macrophages, which highlights the challenge of distinguishing senescent and nonsenescent macrophages (Fig. 1i). However, using transcriptomics, proteomics and metabolomics, we found senescent macrophages formed unique clusters from M0 (a naive state), M1 and M2 conditions suggesting that senescent macrophages are distinct from the classic M1 and M2 paradigm (Fig. 1j–l).
Using this model, we interrogated proposed mechanisms regulating senescence in macrophages. To start, interleukin-4 (IL-4), a type 2 (T helper 2) cytokine, is proposed to be protective against macrophage senescence through a DNA damage repair mechanism17 similar to the effects of lipopolysaccharide (LPS), which can protect against DNA damage27. To test whether LPS or IL-4 can protect against DNA damage-induced senescence, BMDMs were activated with LPS or IL-4 before IR (Extended Data Fig. 1d). Ten days post IR, IL-4 or LPS pretreatment did not significantly prevent Cdkn1a and Cdkn2a expression, prevent cell-cycle arrest or decrease SA-β-gal activity (Extended Data Fig. 1e–g). Next, CD38 has been reported to drive macrophage senescence through heightened NAD+ consumption18. Interestingly, we also observed heightened Cd38 mRNA expression and CD38-mediated NADase activity in senescent macrophages (Extended Data Fig. 1h,i). Therefore, we hypothesized that elevated CD38 activity may drive senescence as recently proposed18. To test this, Cd38 knockout (KO) BMDMs were subjected to the Sen(IR) and Sen(Doxo) models. However, we found no difference in SA-β-gal activity or SASP gene expression in Cd38 KO senescent macrophages compared to wild type (WT) (Extended Data Fig. 1j,k). Moreover, we did not observe any difference in SA-β-gal activity, senescent cell burden or inflammatory cytokine expression in visceral adipose tissue (VAT) from aged (24 months) WT versus Cd38 KO mice, suggesting that targeting CD38 does not protect against the induction of senescence or the natural aging senescent cell burden (Extended Data Fig. 1l,m).
Aging bone marrow has been shown to acquire cell-intrinsic epigenetic modifications that affect macrophage polarization30,31. Therefore, we next examined whether bone marrow age influences BMDM senescence. To test this, BMDMs from young and aged male mice were used in our Sen(IR) model. It was observed that the age of the bone marrow had no major influence in modulating the hallmark features of senescence (Extended Data Fig. 2a–c). Collectively, these data suggest that our macrophage senescence model is stable and reproducible, and that macrophage senescence cannot be prevented or reversed by T helper 2 cell signaling, LPS activation, CD38 NADase activity and the age of the bone marrow.
Senescent macrophages are characterized by a SASP and sterile type I interferon signaling
To identify the specific transcriptomic signature of senescent macrophages, we performed bulk RNA sequencing (RNA-seq). We found that both Sen(IR) and Sen(Doxo) macrophages share most of their transcriptomic phenotype (50%, 747 genes) (Fig. 2a,b and Extended Data Fig. 3a). Interestingly, the top upregulated genes are related to senescence, SASP and inflammation (Cdkn1a, Ccnd2, Ccr5, Cmpk2, Fn1, Mmp9, Mmp12, Mmp13, Pla2g7, Timp3, as well as interferon (IFN)-induced (Ifi) genes like Ifi44, Ifi209 and Ifi213) (Fig. 2c and Extended Data Fig. 3b). A set of downregulated genes was also identified that included Mki-67 and Cdkn2a (Fig. 2c and Extended Data Fig. 3b). Kyoto Encyclopedia of Genes and Genomes (KEGG) analysis revealed that senescence-related genes are associated with inflammation, whereas genes downregulated in senescence are linked to the cell cycle (Fig. 2d and Extended Data Fig. 3c). The occurrence of inflammation and IFN-signaling pathways led us to hypothesize that senescent macrophages also acquire a SASP. To test this, conditioned media were subjected to proteomics. Few secreted proteins differed between Sen(IR) and Sen(Doxo); however, both senescent conditions secreted markedly more SASP proteins than controls, with MMP12, APOE, LGALS3 and CMPK2 among the most abundant (Fig. 2e,f and Extended Data Fig. 3d). KEGG pathway enrichment also highlighted a signature related to inflammation and metabolism (Fig. 2g and Extended Data Fig. 3e) with 80% (293 proteins) of the total SASP proteome in common (Extended Data Fig. 3f). Both the transcriptome and SASP proteome analysis suggest senescent macrophages upregulate inflammatory pathways related to a type I IFN (Ifnα or Ifnβ) response and undergo metabolic reprogramming suggesting an active response toward pathogens despite being in sterile conditions.

a, PCA on bulk RNA-seq samples. b,c, Volcano plots of differentially expressed genes (log2(FC) > 1.3 and FDR < 0.05) between Sen(IR) versus Sen(Doxo) (b) and Sen(IR) versus control (c). Adjusted P values are derived from Fisher’s exact test followed by FDR adjustment. d, KEGG terms associated with proteins upregulated or downregulated by both treatments. The red font highlights pathways related to a type I IFN signal. The blue font highlights terms related to the cell cycle. e,f, Volcano plot of upregulated (red) and downregulated (blue) proteins by FDR-adjusted P value and FC from SASP-proteomics mass spectrometry between Sen(IR) versus Sen(Doxo) (e) and between control and senescent macrophages (f). g, KEGG terms associated with the proteins upregulated or downregulated by both treatments. The red font highlights terms related to an inflammatory pathway. Adjusted P values are derived from Fisher’s exact test followed by FDR adjustment. h, Mean ± s.e.m. mRNA transcript levels, relative to control, for type I IFN response genes in response to STING inhibitor (H-151). P value of ANOVA test of n = 3 biological replicates. i, Immunostaining for mitochondria (TOM20) and co-localized dsDNA (red). Average Pearson’s correlation coefficients ± s.e.m. were calculated for n = 5 biological replicates. j, SDS–PAGE gel immunoblotting (western blot) of macrophages in response to days post IR. ImageJ quantification relative to loading controls are shown to the right. k, Illustration of CRISPR–Cas9 gene editing of differentiating hematopoietic stem cells into macrophages. l, Sanger sequencing base calling results from CRISPR–Cas9 editing of CMPK2 locus exon 1. m, SDS–PAGE gels and immunostaining (western blot) for CMPK2 protein in response to edits sg_Rosa26 and sg_Cmpk2 edits via CRISPR–Cas9. n, Immunostaining for mitochondria (TOM20) and co-localized dsDNA (red). To the right is the quantification of cytosolic dsDNA corrected total cell fluorescence (CTCF) intensity. Box-and-whisker plots show the median (center line), interquartile range (25th to 75th percentiles; box), and minimum and maximum values (whiskers). n = 10 biological replicates, P values were calculated using a one-tailed t-test. o, Mean mRNA transcript levels ± s.e.m. relative to control of Ifnα and Ifnβ in Sen(Doxo) macrophages with edits on the Rosa or Cmpk2 locus. n = 3 biological replicates were used to derive the P value of the t-test. p, Volcano plots of differentially expressed genes (log2(FC) > 1.3 and FDR < 0.1) between sg_Rosa26 and sg_Cmpk2 edited Sen(Doxo) macrophages. Adjusted P values are derived from a two-sided t-test followed by FDR adjustment. q, KEGG pathway analysis on downregulated DEGs. Blue indicates downregulation. The size of the circles represents the odds ratio. Adjusted P values are derived from Fisher’s exact test followed by FDR adjustment. r, KEGG pathway analysis on upregulated DEGs. Red indicates upregulation. The size of the circles represents the odds ratio. Adjusted P values are derived from Fisher’s exact test followed by FDR adjustment.
Source data
Sterile chronic inflammation related to macrophage-specific IFN responses has been observed in aging tissues and liver failure32. The mechanisms underlying age-related type I IFN activation involve the cytosolic DNA-sensing pathway, cyclic GMP–AMP synthase-stimulator of interferon genes (cGAS-STING)33,34. To assess cGAS-STING signaling in senescent macrophages, cells were treated with the STING inhibitor (H-151). H-151 significantly reduced Ifnα and Ifnβ expression compared to DMSO controls (Fig. 2h). In addition, during senescence double-stranded DNA (dsDNA) re-localized from the mitochondria into the cytosol, suggesting mitochondrial DNA release as the source of cGAS-STING activation (Fig. 2i). To understand the mechanism, we interrogated the activity of CMPK2, a cytidine/uridine monophosphate kinase, that is upregulated in our omics datasets and a known regulator of inflammation via newly synthesized mtDNA (Fig. 2c,f)35,36,37. We found that Cmpk2 gene and protein expression was associated with senescence and not an acute DNA damage response (Fig. 2j and Extended Data Fig. 3g). Therefore, we hypothesized that elevated CMPK2 activity in senescent macrophages may help drive activation of the type I IFN response. To test this, CRISPR–Cas9-based genome editing was used to disrupt the Cmpk2 or Rosa26 locus as a control (Fig. 2k). Sanger sequencing confirmed disruption leading to loss of CMPK2 protein expression, as validated by western blot (Fig. 2l,m). Cmpk2– and Rosa26-edited macrophages were subjected to senescence, which resulted in reduced total mitochondrial and cytosolic dsDNA as well as downregulated Ifnα and Ifnβ mRNA expression in the Cmpk2-edited senescent macrophages (Fig. 2n,o). Next, we performed RNA-seq on Cmpk2- and Rosa26-edited senescent macrophages. In senescent macrophages, Cmpk2 loss reduced type I IFN-related genes (Irf7, Acod1, Ifit206) and decreased enrichment of KEGG pathways such as Influenza A, NOD-like receptor signaling and Epstein–Barr virus infection (Fig. 2p,q). By contrast, genes involved in lipid metabolism were upregulated (Fig. 2p,r).
Based on the elevated IFN signaling observed in senescent macrophages, we hypothesized that they are primed toward a proinflammatory phenotype. To test this, we exposed senescent macrophages to LPS and observed a heightened gene expression response as well as an increased capacity for phagocytosis (Extended Data Fig. 3h,i). Conversely, the ability to clear apoptotic cells via efferocytosis was significantly reduced compared to control macrophages (Extended Data Fig. 3j). Upon IL-4 treatment, senescent macrophages increased expression of Cd36 and Ym1, but reduced expression of other hallmark M2 genes, along with diminished arginase-1 (Arg1) expression and enzymatic activity (Extended Data Fig. 3k,l). Therefore, our data demonstrated that senescent macrophages exhibit elevated IFN signaling, via activation of a CMPK2–mtDNA–cGAS-STING-dependent mechanism, and although they can still integrate both M1 and M2 polarization signals, they are biased toward a proinflammatory activation state.
p21+ senescent macrophages accumulate in the aged liver
Next, we wanted to investigate whether macrophages naturally undergo senescence in vivo during the aging process. We focused on metabolic tissues, because these tissues acquired a high senescent cell burden during aging27. In fact, our analysis showed that among visceral tissues, the liver showed the largest increase in Cdkn1a (p21) expression, while the heart and VAT showed smaller but significant increases (Fig. 3a). The aged liver and VAT also displayed elevated SA-β-gal activity and an increase in the amount of p21⁺ F4/80+ macrophages relative to young liver and VAT (Extended Data Fig. 1l and Fig. 3b,c). Notably, Cdkn2a (p16) mRNA expression also increased across tissues tested, potentially reflecting inflammation or senescence in non-macrophage cell types (Extended Data Fig. 4a). To further investigate the relationship between p21 expression and increased SA-β-gal activity, we analyzed the Tabula Muris Senis dataset, which includes single-cell RNA-seq data from 23 tissues across the murine lifespan38. Interestingly, the liver also exhibited the greatest increase and highest proportion of Cdkn1a⁺ cells with age (Fig. 3d,e). Based on these findings, we focused our analysis on the liver.

a, Mean ± s.e. mRNA transcript levels (RT–qPCR) of Cdkn1a from n = 8, 2–4-month-old (Y) versus n = 8 21–24-month-old (O) male mice. P value derived from a two-sided t-test. b, SA-β-gal histology of Y and O liver sections. n = 2 male mice. Scale bar represents a 20 μm distance. c, Immunostaining for macrophages (F4/80) and p21 expression in Y and O male sections. Scale bar represents a 20 μm distance. d, Quantification of Cdkn1a+ cell accumulation with age in heart and liver datasets. P values represent significance from Pearson’s correlation test. e, Linear regression rates of tissue-specific Cdkn1a+ cell accumulation with age across six tissues in the TMS database. f, UMAP analysis of the Tabula Muris Senis dataset representing all cells in the liver annotated by cell type. g, UMAP analysis of the Tabula Muris Senis dataset representing all cells in the liver annotated by age. h, Percentage of cells positive for Cdkn1a (green), Cdkn2a (red) and double positive (blue) across liver Kupffer cells, hepatocytes and endothelial cells. i, Bubble map of genes grouped by hallmarks or macrophage senescence. Size represents the fraction of cells expressing each gene, and color reflects average expression for endothelial cells, hepatocytes and Kupffer cells. j, Venn diagram analysis using Fisher’s test with aged Kupffer cells and senescent IR macrophages. k, Bulk RNA-seq of 67 genes found enriched in senescence and aging. Conditions reflect different polarized states. Box outlines are manually placed, and highlighted clusters are generally downregulated compared to other conditions. The z-score reflects the FC of the condition over the control group. l, GSVA scoring of M1, M2 and Sen(IR) conditions using the SenMayo gene signature and the 67 genes identified in j as the MSen signature. Box-and-whisker plots display the median (center line), interquartile range (25th to 75th percentiles; box), and minimum and maximum values (whiskers). n = 4 biological replicates were analyzed. P values reflect post-hoc comparisons following one-way ANOVA. NS, not significant (P ≥ 0.05); *P < 0.05; **P < 0.001; ***P < 0.001. m, Distribution of cells expressing the MSen signature across all cell types in the Tabula Muris Senis dataset via a Seurat score. n, Distribution of MSen Seurat score across young and old Kupffer cells. P value represents results of a Student’s t-test. m, month; NK, natural killer.
Source data
Kupffer cells, resident macrophages in the liver, are the most abundant hepatic immune cell population and our analysis revealed that the transcriptomic profile of Kupffer cells undergoes profound aging-dependent changes (Fig. 3f,g). Unlike other liver cell types, such as hepatocytes, endothelial cells and other immune cell populations, Kupffer cells exhibited marked age-dependent upregulation of Cdkn1a expression (Fig. 3h and Extended Data Fig. 4b). We next explored the expression of key senescence-associated genes, including chemokines, matrix metalloproteinases (MMPs), IFN and lipid-handling genes, across all major liver cell types. Notably, among these populations, only Kupffer cells were consistently enriched for hallmark senescence genes with age, including a pronounced inflammaging signature (Fig. 3i and Extended Data Fig. 4c). By contrast, in aged cardiac tissue a similar pattern was observed in the myeloid leukocyte population, although increased Cdkn1a expression was not limited exclusively to myeloid cells (Extended Data Fig. 4d,e).
Comparative transcriptomic analysis of aged Kupffer cells and in vitro Sen(IR) and Sen(Doxo) macrophages identified 67 commonly expressed genes, defining a macrophage senescence (MSen) signature (Fig. 3j). While containing M1 and M2 genes, the set also includes senescence-specific genes that may distinguish senescent macrophages from other subsets (Fig. 3k). Using Gene Set Variation Analysis (GSVA), the MSen transcriptomic signature identified senescent macrophages among M1 and M2 macrophages in a manner that outperformed the SenMayo39, CellAge40 and Senescence Gene Ontology signatures (Fig. 3l and Extended Data Fig. 5a). The same MSen signature was applied across all cell populations and tissues in the Tabula Muris Senis and was highly selective for identifying aged, but not young, Kupffer cells, or other cell types (Fig. 3m,n). Collectively, the data indicate that tissue-resident macrophages, Kupffer cells, represent a major pool of senescent cells in aged livers and possibly other metabolic tissues.
Senescent macrophages form lipid droplets and express TREM2
To understand the physiological mechanisms driving macrophage senescence during aging, we analyzed transcriptomic and proteomic datasets from aged Kupffer cells and in vitro senescent macrophages. Both populations showed increased expression of genes involved in cholesterol metabolism, along with elevated levels of markers characteristic of lipid-laden, disease-associated macrophages, including Trem2 and Plin2 (Figs. 2d and 3i,k). These findings led us to hypothesize that senescent macrophages constitute a subset of lipid-laden macrophages implicated in metabolic diseases, including MASLD and atherosclerosis. To evaluate this, we analyzed five public datasets41,42,43,44,45 and observed a significant upregulation of the MSen gene signature in Kupffer cells from MASLD livers and in atherosclerotic plaques (Extended Data Fig. 5b–f). Furthermore, deep proteomic analysis revealed that senescent macrophages upregulate several proteins related to M2 (cluster 1), M1 (cluster 2) and exclusively in the C3 cluster (Fig. 4a). Investigation into the clusters reveals the upregulation of lipid-related proteins compared to control and M1 conditions (Fig. 4b). Pathway enrichment into the C3 cluster highlights lipid remodeling terms with 26.7% of proteins perturbed (Fig. 4c). Consistent with this, we found that senescent macrophages exhibited greater lipid droplet accumulation compared to control macrophages (Fig. 4d,e).

a, Protein expression (LC–MS/MS) projected as a z-score of log2(FC) over control conditions. Clustering represents the three major clades of a dendrogram. b, log2-transformed raw protein expression for selected lipid-laden proteins. Box-and-whisker plots display the median (center line), interquartile range (25th to 75th percentiles; box), and minimum and maximum values (whiskers). n = 6 biological replicates were analyzed. Statistical P values reflect results from a one-way ANOVA identifying differences in at least one group. c, KEGG pathway enrichment for all proteins upregulated in Sen(IR) conditions over control macrophages. d, Immunostaining by microscopy for lipid-body labeling (green-LipoTOX) in Sen(IR) conditions. Green arrows represent LipoTOX+ cells. e, Bodipy (lipid droplet) staining for represented conditions. Total histograms are normalized to mode. f, SDS–PAGE gels and immunoblotting (western blot) for TREM2 (both glycosylated and total), p21 and p16. ImageJ quantification for band intensity is shown to the right and represents relative intensity over the loading control. g, PCA on bulk RNA-seq samples from senescent macrophages (Sen(IR) (10 days post irradiation)) and passage control condition (Control) on a WT or Trem2−/− background. h, Gene Ontology analysis for statistically significant downregulated DEGs in senescence in response to the Trem2−/− background. The size of the data points represents the relative odds ratio. i, MSen scoring of bulk RNA-seq samples using GSVA methods. Box-and-whisker plots display the median (center line), interquartile range (25th to 75th percentiles; box), and minimum and maximum values (whiskers). n = 3 biological replicates were analyzed. P values represent results from Student’s t-test. j, Scaled transcriptomic expression of the 67 MSen genes broken into the four major clades of a dendrogram.
Source data
TREM2 macrophages have been implicated in several diseases like metabolic dysfunction, chronic inflammation and tissue degeneration, including metabolic dysfunction-associated steatohepatitis (MASH) and neurodegenerative diseases such as Alzheimer disease46,47,48,49. Interestingly, TREM2 is highly upregulated in Sen(IR) macrophages compared to M0, M1 and M2 macrophages, with glycosylated TREM2 suggesting membrane localization (Fig. 4f). In addition, we observed that the simultaneous activation of Trem2, p16 and p21 is associated with M2 anti-inflammatory macrophages, whereas the upregulation of p21, TREM2, and downregulation of p16 is a unique signature of senescent macrophages (Fig. 4f). Furthermore, Trem2−/− senescent macrophages had reduced p21 expression, suggesting that TREM2 plays an active role in regulating senescence (Fig. 4f).
To determine the functional role of TREM2, Trem2−/− mice were used to evaluate hallmark features of senescence. SA-β-gal activity and cell-cycle arrest phenotypes were unchanged in response to the loss of TREM2 (Extended Data Fig. 6a,b), but a profound change in morphology was observed, and proliferation rates were also attenuated in the Trem2−/− background (Extended Data Fig. 6b). Efferocytosis was reduced in WT senescent macrophages, consistent with reports that TREM2 shedding impairs TREM2-dependent efferocytosis in chronically activated macrophages48 (Extended Data Fig. 3j). To define the global impact of TREM2 on macrophage senescence, we performed unbiased transcriptomic analysis. Principal components analysis (PCA) revealed distinct clustering across all conditions, with the first principal component (PC1) separating control and senescent cells and the second principal component (PC2) reflecting genotype differences (Fig. 4g). Pathway analysis of downregulated genes in Trem2−/− senescent macrophages highlighted autophagy-related cellular compartments and cholesterol metabolism, while upregulated genes were enriched for focal adhesion, translation and actin cytoskeleton remodeling (Fig. 4h and Extended Data Fig. 6c). We next asked whether Trem2 regulates the MSen transcriptomic signature developed in Fig. 3k. Interestingly, the loss of TREM2 downregulates the MSen gene score and prevents the expression of key MSen-related genes, including Cdkn1a, p21 (Fig. 4i,j). Collectively, these data suggest that TREM2 plays a key role in regulating p21, SASP gene expression and lipid biology in senescent macrophages.
Excess cholesterol ester loading via acetylated low-density lipoprotein is a driver of macrophage senescence in vitro
To characterize the lipid species in senescent macrophages, we performed shotgun lipidomics and identified ceramides (Cer d18:0 and Cer d18:1) and cholesterol esters to be enriched in senescence as well as a subtle downregulation of hexosylceramides (Fig. 5a). In addition, the composition of fatty acids represents polyunsaturated fatty acids in senescence (Fig. 5b). Cholesterol was found to be esterified to the bulk of the polyunsaturated fatty acid pool with arachidonic acid (20:4) and dihomo-γ-linolenic acid (20:3), bioactive fatty acids implicated in cellular senescence and the SASP, being the highest ranked compared to other lipid species50 (Fig. 5c). The accumulation of cholesterol esters and lipid droplets suggests that senescent macrophages adopt a lipid-laden, foam cell-like phenotype that may contribute to chronic inflammation, metabolic dysfunction and tissue degeneration in aging and disease.

a, Heatmap representation of fold change differences of normalized lipid abundance (nmol lipid per 1 × 10⁶ cells per average cell size) for all lipid species via shotgun lipidomics (LC–MS/MS) in Sen(IR) macrophages relative to control macrophages. Asterisks represent the P value of the ANOVA: ns, ≥0.05; *P < 0.05; **P < 0.01; ***P < 0.001; ****P < 0.0001. b, Normalized fatty acid levels (nmol fatty acid per 1 × 10⁶ cells per average cell size) relative to control macrophages via shotgun lipidomics (LC–MS/MS). Bar: average ± s.e.m. of n = 3 biological replicates. Asterisks represent the P value of the t–test: ns, ≥ 0.05; *P < 0.05; **P < 0.01; ***P < 0.001; ****P < 0.0001. c, Volcano plot of the most enriched lipid species in senescence relative to control macrophages. The color and size of the data points represent the FC gradient. d, Model illustration hypothesizing cholesterol as a driver of macrophage senescence. e, Model illustration of an in vitro model system of Ac-LDL-induced macrophage senescence. f, SDS–PAGE gels and immunostaining (western blot) for TREM2 (both glycosylated and total), p21 and p16 in response to more time in Ac-LDL. ImageJ quantification for band intensity is shown to the right and represents the relative intensity over the loading control. g, SA-β-gal assay imaging at ×20 magnification. Scale bar: 10 μm. h, Click-iT EdU labeling of Ac-LDL-treated cells to assess cell-cycle dynamics. The average ± s.e.m. cell fraction in S phase (EdU+) is shown to the right. P value derived from an ANOVA. n = 3 biological replicates were used. i, Mean ± s.e.m. mRNA transcript levels relative to control for hallmark senescence genes. P value of paired t–tests from n = 4 biological independent experiments. Panel e created in BioRender; Salladay-Perez, I. https://biorender.com/6umuckd (2026). BMDMø, bone marrow-derived macrophage.
Source data
High serum levels of low-density lipoprotein (LDL) cholesterol is a major risk factor for metabolic disease and is known to increase intracellular cholesterol levels in macrophages. We hypothesized that excess cholesterol loading via LDL could serve as a driver of macrophage senescence in vitro (Fig. 5d). To test this, macrophages were treated with an acetylated form of LDL (Ac-LDL) which bypasses the LDL receptor, providing a pharmacological method to rapidly load macrophages with cholesterol (Fig. 5e). In response to Ac-LDL, we observed a time-dependent increase in TREM2 and p21 expression, while p16 was modestly decreased (Fig. 5f). Increased SA-β-gal activity and reduced cell proliferation were also observed during prolonged Ac-LDL exposure (Fig. 5g,h). To quantify changes in gene expression in response to Ac-LDL, macrophages were treated with four independent batches of Ac-LDL to embrace the natural variability of commercialized LDL. Under high-cholesterol conditions, both Cdkn1a (p21) and Trem2 were upregulated, whereas Cdkn2a (p16) did not vary significantly (Fig. 5i). In addition, we observed selective upregulation of SASP genes such as Gdf15, Mmp9 and Mmp12 (Fig. 5i). Collectively, these results demonstrate that cholesterol ester loading promotes a senescent, foam cell-like macrophage phenotype characterized by lipid accumulation and SASP activation.
It has recently been proposed that cholesterol accumulation, resulting from genetic deletion of the cholesterol efflux ATP-binding cassette, ABCA1, drives senescence through a mechanism involving CD38 activation and NAD⁺ decline18. CD38 expression was also increased during DNA damage-induced senescence (Fig. 1i), and a senescence-associated decline in NAD⁺ levels is a well-known feature of aging27. Furthermore, Cd38 mRNA was elevated during acute exposure to Ac-LDL and remained modestly elevated during later stages of senescence (Extended Data Fig. 7a). These findings suggest that cholesterol may contribute to macrophage senescence, at least in part, through a CD38-dependent mechanism. However, as we discussed earlier, our data suggest CD38 is not required for DNA damage and natural aging-induced senescence (Fig. 1i and Extended Data Fig. 1k–m). To test the role of CD38 in cholesterol-driven macrophage senescence, Cd38 KO mice were subjected to Ac-LDL loading. Across multiple assays, no significant differences in senescence gene expression (Cdkn1a, Mmp9, Gdf15), cholesterol sensing (Abca1) or SA-β-gal activity were observed compared to WT macrophages, suggesting CD38 is not necessary for cholesterol-induced senescence (Extended Data Fig. 7b,c), consistent with our earlier results.
ABT-263 efficiently and selectively targets senescent macrophages for apoptosis
We next hypothesized that Ac-LDL-induced senescent macrophages can contribute to diseases associated with hypercholesterolemia. To target these cells for apoptosis, we investigated a panel of pro- and anti-apoptotic genes and identified Bcl-2, a key gene involved in anti-apoptotic pathways, as well as pro-apoptotic mitochondrial genes such as Bak1 and Bax (Fig. 6a). BCL-2 is a direct inhibitor of mitochondrial BAX and BAK proteins and given this pattern in transcription, it was hypothesized that pharmacological inhibition of BCL-2 should allow mitochondrial BAX or BAK to drive apoptosis (Fig. 6b). To test this hypothesis, we used the known senolytics ABT-263 (Navitoclax), a BCL family inhibitor, and Dasatinib and Quercetin (D + Q). Selective elimination of senescent macrophages was observed in response to ABT-263, unlike D + Q, which induced cytotoxicity in both senescent and nonsenescent cells (Extended Data Fig. 8a,b). A dose- and time-dependent apoptotic effect was also observed with ABT-263, with a half maximal inhibitory concentration (IC50) value in the nanomolar range (Fig. 6c,d and Extended Data Fig. 8c). Next, we asked how effective ABT-263 is at targeting macrophage senescence across various polarized states. To test this, we treated M1 and M2 macrophages with ABT-263, along with Ac-LDL-induced senescent macrophages. After a 24-h exposure to ABT-263, apoptosis was only observed in senescent conditions, suggesting that ABT-263 is selective and effective at killing senescent macrophages, and not generally activated pro- or anti-inflammatory macrophages (Fig. 6e).

a, Average ± s.e.m. mRNA transcript levels (RT–qPCR) for a collection of pro- and anti-apoptotic genes relative to control. P value derived from an ANOVA test. n = 3 biological replicates. b, Model illustration hypothesizing that ABT-263 drives apoptosis in senescent cells via BCL-2. c, Dose response curve (±s.e.m.) identifying the IC50 for specific senescent macrophage killing. The R2 value represents the coefficient of correlation from n = 3 biological replicates. d, Flow cytometry quantification of dead cell gates via microscopy in response to ABT-263. P value of Tukey’s test from two-way ANOVA. Data points represent percentage propidium iodide positive (PI+) cells (±s.e.m.) for n = 384 biological replicates. e, Flow cytometry quantification of apoptotic cell gates (Annexin V (AV)+ and PI+), ± s.e.m., in response to ABT-263 across a spectrum of polarized macrophage phenotypes. M0 represents naive macrophages, PC represents passage control macrophages. P value of Tukey’s test from two-way ANOVA of n = 3 biological replicates. f, Model illustration of young (4 month) and aged (24 month) male mice treated with ABT-263 via oral gavage every day for 7 days on weeks 1 and 4. g, Immunofluorescence microscopy staining for macrophages (F4/80) and p21 in treated liver tissues. Images taken at ×40 magnification. Scale bar: 20 μm. h, Relative p21+ F4/80+ (senescent macrophages) abundance relative to total macrophages (±s.e.m.). n = 6 mice were used in each young condition, n = 5 aged male mice in the placebo control and n = 7 aged male mice on ABT-263. P value of Tukey’s test post ANOVA. i, Spleen to total mouse weight ratio (±s.e.m.) in n = 6 male mice used in each young condition, n = 5 aged male mice in the placebo control and n = 7 aged mice on ABT-263. P value of Tukey’s test post ANOVA. j, Average ± s.e.m. mRNA transcript levels (RT–qPCR) for a collection of proinflammatory genes relative to young control. P value of Tukey’s test post ANOVA. n = 6 male mice were used in each young condition, n = 5 aged mice in the placebo control and n = 7 aged mice on ABT-263. k, Oil Red O stain representative images of n = 6 male mice used in each young condition, n = 5 aged mice in the placebo control and n = 7 aged mice on ABT-263. Average ± s.e.m. lipid droplet area and volume were used in the statistics. P value of Tukey’s test post two-way ANOVA.
Source data
To assess the effects of ABT-263 on p21⁺ senescent macrophages in vivo, young and aged mice were treated by oral gavage using an intermittent ‘hit-and-run’ dosing strategy5 (Fig. 6f). The liver, VAT and spleen were collected to determine the effect of senescent macrophage clearance on systemic inflammation and MASLD. Using immunofluorescence microscopy, the number of p21+ and F4/80+ macrophages in the liver increased from ~5% to ~50% during aging and was significantly reduced to ~10% in response to ABT-263 (Fig. 6g,h). Interestingly macrophages represent 60%–80% of p21+ cells in young and aged livers (Extended Data Fig. 8d). Systemically, it was observed that the relative spleen weight was decreased, suggesting repression of splenomegaly and systemic inflammation (Fig. 6i). Lower SA-β-gal activity in the VAT was observed and ABT-263 had no effect on total mouse weight (Extended Data Fig. 8e,f). The effect of p21+ macrophage clearance on liver inflammation resulted in significant downregulation of multiple cytokines and chemokines (Fig. 6j). In addition, we observed reduced lipid droplet area in both the young and aged livers in response to ABT-263 (Fig. 6k). Overall, these results identify ABT-263 as a potent senolytic capable of selectively targeting macrophage senescence in vivo, and reducing inflammation and liver steatosis associated with aging.
ABT-263 targets a senescent macrophage signature in MASLD
To assess the pathological relevance of macrophage senescence, CETP–APOE*3-Leiden transgenic mice on a B6 background were placed on a high-fat high-cholesterol diet (HFHCD) to model MASLD and MASH. The mice were crossed with three genetic backgrounds (129/SvJ, C57BL/6J and BXD19/Tyj) that exhibit varying degrees of liver fibrosis (Fig. 7a,b). Of note, these mice only develop MASH when fed on HFHCD for 16 weeks, and not just a high-fat diet alone51. Liver samples were collected throughout the diet and pathology validated the genetic susceptibility to fibrosis, with the BXD19/Tyj strain being sensitive and the 129/SvJ strain resistant to fibrosis (Fig. 7b,c). Liver tissue samples were subjected to RNA-seq to identify MSen genes associated with macrophage senescence, such as Cdkn1a and Trem2. A strain- and time-dependent interaction was observed across all genotypes, with the highest expression of senescence markers in the BXD19/Tyj strain and the lowest in the 129/SvJ strain (Fig. 7d). Quantification of the MSen score revealed that the relationship between diet, time and macrophage senescence was strongest in the BXD19/Tyj strain compared to the 129/SvJ strain (Fig. 7e). These data suggest that strain-specific differences in fibrosis and senescent macrophage accumulation may influence the progression of liver MASLD. Based on these findings, we hypothesized that macrophages from these strains may exhibit varying intrinsic susceptibility to senescence. To test this, BMDMs were isolated from each strain and gene expression analysis revealed strain-specific upregulation of Cdkn1a (p21), Trem2 and SASP genes in Sen(IR) macrophages, with stronger effects in strains more prone to fibrosis, such as BXD19/Tyj and C57BL/6J, compared to 129/SvJ mice (Fig. 7f). Expression of Cdkn2a (p16) was also assessed; however, no significant differences were observed in each mouse strain (Extended Data Fig. 9a). These findings suggest that hypercholesterolemia drives macrophage senescence in vivo, and that the extent of fibrosis and senescent macrophage accumulation may be positively correlated and influenced by genetic determinants through cell-intrinsic mechanisms.

a, Model illustration of CETP–APOE* Leiden transgenic mice maintained on C57BL/6J then crossed to three additional genetic backgrounds susceptible (BXD19/TyJ and C57BL/6J) and resistant (129/SvJ) to developing to MASLD. b, Representative picrosirius red stain for liver fibrosis after 16 weeks on HFHCD. Scale bars represent a 20 μm distance. c, Pathology grades of fibrosis of n = 4–6 male liver sections stained with picrosirius red stain. Data represent median ± s.e.m. d, Bulk RNA-seq of transcript levels for MSen gene signature across weeks 0–16 on HFHCD. e, Mean ± s.e.m. MSen scores across weeks 0–16 on HFHCD for each genetic background. Best-fit line and P value derived from a simple linear regression model of n = 3–6 male mice per time point. f, Mean ± s.e.m. mRNA transcript levels (RT–qPCR) relative to control of BMDMs from CETP-APOE*Leiden mice crossed on different three backgrounds. P value from a two-way ANOVA. n = 3 biological replicates per strain and condition were used. g, Model illustration of CETP–APOE*Leiden transgenic mice crossed on the C57BL/6J genetic background. Mice were treated with ABT-263 via oral gavage every day for 7 days on weeks 12 and 15. h, Mean ± s.e.m. weight of n = 9 placebo mice and n = 10 ABT-263-treated mice at 17 weeks. P value derived from a two-sided t-test. i, Mean ± s.e. change in food intake for n = 6 placebo cages and n = 5 ABT-263-treated cages at 17 weeks. j, Mean ± s.e. spleen weight (in grams) relative to total weight of n = 9 placebo mice and n = 10 ABT-263-treated mice at 17 weeks. P value derived from a two-sided t-test. k, Enzyme-linked immunosorbent assay quantification for picograms of tumor necrosis factor found in every microliter of serum collected. P value derived from a one-sided t–test. Mean ± s.e.m. of n = 9 placebo mice and n = 10 ABT-263-treated mice at 17 weeks. l, Mean liver weight (in grams) relative to total weight ± s.e. of n = 9 placebo mice and n = 10 ABT-263-treated mice at 17 weeks. P value derived from a two-sided t–test. m, Representative liver photographs at 17 weeks immediately after tissue harvest. Scale rule: inches. n, Mean mRNA transcript levels (RT–qPCR) for SASP, senescent and macrophage genes in bulk liver samples relative to placebo control. P value derived from a two-sided t–test. Bar plots: average ± s.e.m. of n = 9 placebo mice and n = 10 ABT-263-treated mice at 17 weeks. o, Bulk RNA-seq of the MSen transcriptomic signature (genes derived from aged macrophages in vivo and senescent macrophages in vitro) in response to the senolytic drug, ABT-263. Scale bar: log2[TPM + 1] expression on a z-score axis. n = 6 vehicle and n = 5 ABT-263-treated mice used in this experiment. p, GSVA scoring of MSen genes in the livers of vehicle- or drug-treated mice. Box-and-whisker plots display the median (center line), interquartile range (25th to 75th percentiles; box), and minimum and maximum values (whiskers). P values were calculated using a nonparametric Wilcoxon test. n = 6 vehicle-treated and n = 5 ABT-263-treated mice were analyzed. q, Total NAD (pmol per mg of liver analyzed) quantified by LC–MS/MS. Mean ± s.e.m. of NAD distribution in response to ABT-263. n = 9 placebo mice and n = 10 ABT-263-treated mice at 17 weeks. P value derived from a two-sided t-test. r, Nonalcoholic fatty liver disease (NAFLD) activity score based on pathology grades for each condition. Bar: mean ± s.e. P value derived from Student’s t–test. s, Oil Red O stains are shown for three representative mice treated with vehicle or ABT-263. Scale bars represent a 20 μm distance. Mean ± s.e.m. lipid droplet size and area analyzed in eight images per liver section, and the average size (μm2) from eight slides for each mouse was used for statistical analysis. n = 6 vehicle and n = 5 ABT-263-treated mice used in this analysis. P value derived from Student’s t-test.
Source data
To test the contribution of macrophage senescence to fatty liver disease progression, we treated HFHCD-fed C57BL/6J APOE*CETP transgenic mice with ABT-263 or vehicle control. Treatment commenced at week 12 of the diet, because RNA-seq analysis indicated a strong increase in expression of our MSen genes in the liver at that time point (Fig. 7d–g). Interestingly, ABT-263-treated mice exhibited a significant reduction in body weight without changes in food intake (Fig. 7h,i). In the progression to MASH, splenomegaly is common because of systemic inflammation, and is reduced in ABT-263-treated mice, along with a decrease in serum tumor necrosis factor levels (Fig. 7j,k). Serum metabolites remained largely unchanged, aside from a modest effect on blood glucose, and circulating liver enzymes (alanine transaminase (ALT) and aspartate transaminase (AST)) were unaffected (Extended Data Fig. 9b–d). Notably, the liver improved dramatically, with treated livers appearing smaller and darker red compared to the enlarged, yellow-steatotic appearance typically observed in HFHCD-fed controls (Fig. 7l,m). Total liver gene expression revealed no effect on Cdkn2a (p16) and a reduction in Cdkn1a (p21), Trem2 and inflammatory macrophage markers like Cd68 and Cd38. (Fig. 7n). By contrast, we observed only modest decreases in Cdkn1a or Cd38 expression in other tissues such as the kidney or VAT (Extended Data Fig. 9e), suggesting that cholesterol-driven macrophage senescence primarily affects the liver. Furthermore, using unbiased transcriptomics, we observed reduced expression of M1 and M2 genes and a significant decrease in the MSen transcriptomic signature (Fig. 7o,p and Extended Data Fig. 9f).
High CD38 expression, linked to senescent cell burden, can lead to NAD+ degradation in the liver27. Given the reduction in liver Cd38 expression and reduction in the MSen signature following senolytic treatment, we hypothesized that liver NAD⁺ levels might be restored after targeting senescent macrophages. When measured, liver NAD⁺ levels in ABT-263-treated mice increased by 30%, suggesting that senescent macrophages regulate tissue NAD⁺ metabolism likely via a Cd38-dependent mechanism (Fig. 7q). Histological analysis of liver sections stained with picrosirius red revealed no significant change in fibrosis grade; however, a reduction in the nonalcoholic fatty liver disease activity score, driven by improvements in steatosis, was observed (Fig. 7r and Extended Data Fig. 9g). Oil Red O staining showed a significant decrease in lipid droplet size and area in ABT-263-treated mice (Fig. 7s). In addition, ABT-263 treatment reshaped the liver lipidome, reducing cholesterol esters and triglycerides while increasing lysophosphatidylethanolamine (Extended Data Fig. 9h). Together, these findings suggest that macrophage senescence occurs in cholesterol-driven liver disease and that targeting senescent macrophages reduces systemic inflammation and improves liver steatosis in MASLD, therefore preventing CD38-dependent NAD+ decline. These results complement a recent study showing that elimination of p21+ senescent cells during aging improves metabolic health and extends lifespan in mice52, and suggest this may be dependent in part on targeting p21+Trem2+ senescent macrophages.
TREM2
+ scar-associated macrophages express a human senescent macrophage gene signature
To determine whether human macrophages can undergo senescence, macrophages derived from peripheral blood mononuclear cells (PBMCs) were subjected to the Sen(IR) and Sen(Doxo) models, similar to the mouse BMDM protocols (Fig. 8a). We observed a significant increase in TREM2, CDKN1A (p21), GDF15 and CD38 expression in both Sen(IR) and Sen(Doxo) macrophages (Fig. 8b). The expression of CDKN2A, IFNα, IFNβ, MMP9 and MMP12 did not change significantly (Fig. 8b and Extended Data Fig. 10). Interestingly, the increased protein expression of p21 and reduced p16 expression were similar to that seen in mouse senescent macrophages (Fig. 8c). In addition, SA-β-gal activity and reduced proliferative capacity were observed in human Sen(IR) macrophages (Fig. 8d,e). Together, these findings suggest that the Sen(IR) model in human macrophages serves as a reliable system for investigating the mechanisms and biomarkers of human macrophage senescence.

a, Illustration of the in vitro model system using exogenous DNA damage with irradiation and Doxo on PBMC-derived macrophages from male and female human donors. b, Mean ± s.e. gene expression (RT–qPCR) normalized to control. n = 9 donors (mixed male and female) for control and Sen(IR) conditions. n = 8 for Sen(Doxo) conditions. P value from Tukey’s test post repeated measures ANOVA analysis. c, SDS–PAGE gels and immunostaining (western blot) for p21 and p16 in response to 10 days post DNA damage. ImageJ quantification for band intensity is shown to the right and represents relative intensity over the loading control. d, SA-β-gal images of human senescent macrophages. e, Click-iT EdU labeling of cells to assess proliferation dynamics. Axes represent the percentage of cells positive for the stain relative to the parental gate, as detected by flow cytometry. The bar plot represents the mean ± s.e. of n = 3 independent donors. P value derived from unpaired one-sided t-test. f, PCA on bulk RNA-seq samples from 10 days post DNA damage for three blood donors. g, Heatmap projection of all statistically significant DEGs compared to control conditions. h, KEGG pathway enrichment analysis for the top ten pathways downregulated in human senescent macrophages. i, KEGG pathway enrichment analysis for the top ten pathways upregulated in human senescent macrophages. j, Model illustration of running MSen score on publicly accessible single-cell dataset49 of human liver biopsy samples from five people with liver cirrhosis and five with a healthy liver. k, UMAP projection of all annotated CD45+ cell types and colored by human MSen Seurat score. l, UMAP projection of CD68+ cells (macrophages) in healthy and cirrhotic tissue samples. Color denotes human MSen Seurat score. m, Distribution of MSen Seurat score across resident macrophage (Kupffer cells) and non-resident monocyte and macrophage populations in healthy and cirrhotic conditions. P value represents the results of a two-sided t-test. n, Distribution of human MSen score across all CD45+ cell types in the dataset. ALD, alcohol-related liver disease; F, female; KC, Kupffer cell; IgA, immunoglobulin A; IL-C, innate lymphoid cell; M, male; MoMac, monocyte-derived macrophage; Mø, macrophage; PBC, primary biliary cholangitis; pDC, plasmacytoid dendritic cell. Panels a and j created in BioRender; Salladay-Perez, I. https://biorender.com/6umuckd (2026).
Source data
To further explore human senescent macrophage biology, an unbiased bulk RNA-seq approach was used to capture global transcriptomic changes. In this experiment, we observed a donor-specific response to IR and Doxo, suggesting that genetics has an influence on senescence susceptibility, similar to that we observed in senescent macrophages from varying strains of mice. Among donors, PCA demonstrated clear separation between senescent and control macrophages, with 1,200 DEGs identified (analysis of variance (ANOVA), with a modest q value <0.1) (Fig. 8f). This clustering indicated a distinct transcriptional phenotype in senescent macrophages, with 163 genes being differentially expressed (ANOVA, q < 0.05) across all donor conditions during senescence (Fig. 8g). Upregulated genes included redox and detoxification factors (MGST1, QSOX1, ALDH3B1), mitochondrial regulators (ISCU, NDUFA4, COX7A1) and lysosomal or vesicular components (ATP6V1D, ATP6V0E1, MAN2B1, SIDT1), reflecting increased lysosomal activity characteristic of senescence. Metabolic and lipid-handling genes (FABP4, GRAMD1B, APMAP) and canonical senescence markers (CDKN1A and CDKN1C) were elevated, alongside antigen presentation and immune-modulatory transcripts (HLA-DRA, HLA-DMA, FCN1, MS4A7, ADGRE1), indicating an inflammatory phenotype. By contrast, genes governing cell-cycle progression and DNA replication were markedly repressed, including CDK1, CDC20, CHEK1, MCM7 and TOP2A, consistent with irreversible proliferative arrest. DNA repair factors (EXO1, MSH6, BLM, RECQL4) and nuclear lamina components (LMNB1 and LMNA) were also reduced, reflecting deep senescence and impaired genome maintenance (Fig. 8g). KEGG analysis revealed that downregulated genes were primarily involved in cell proliferation pathways, while the upregulated genes were associated with inflammatory responses (Fig. 8h,i). Together, these transcriptional changes define a stable senescent macrophage phenotype characterized by heightened stress and lysosomal programs coupled with altered proliferative, metabolic and immune functions.
To evaluate whether senescent macrophages represent TREM2+ macrophages in liver disease, we analyzed a publicly available single-cell RNA-seq dataset of human liver cirrhosis that identified a TREM2+ scar-associated macrophage (SAM) population49 (Fig. 8j). Using the genes identified in our bulk human MSen transcriptomic analysis as a scoring method, we observed significant enrichment for senescence-associated genes in Cd45+ immune cells in both healthy and diseased livers, with macrophages being the most enriched (Fig. 8k,l). Further analysis into CD45⁺CD68⁺ macrophages revealed a pre-existing SAM population enriched for senescence in the human control samples (Fig. 8m). In the context of cirrhosis, Kupffer cells and monocytes and/or macrophages appear to transition into SAMs that score high for the human MSen signature and outrank all other immune cells in the liver (Fig. 8m,n). These results indicate that macrophage senescence is present in human chronic liver diseases, including MASLD and cirrhosis, and may represent a therapeutic target.