
Further information can be found in Supplemental Methods
Sex as a biological variable
Our study examined male and female animals, and similar findings are reported for both sexes.
Primary human PBMC inflammasome activation in the presence of TH5487, SU0268, TH10785, and MCC950
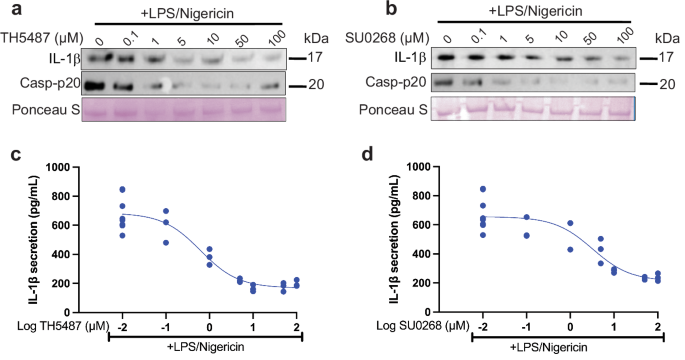
PBMCs from healthy individuals (OrganaBio) were seeded at 2 × 10⁶/mL in 96-well plates (200 µL/well) in Opti-MEM Reduced-Serum Media (Gibco). Cells were primed with 1.6 µg/mL LPS (Thermo Fisher) for 3 h. During the third hour, cells were treated with 0.1–100 µM TH5487 (Selleck Chemicals), SU0268 (MedChemExpress), TH10785 (MedChemExpress), MCC950 (Sigma), or vehicle for 1 h. After the 1 h drug treatment, the LPS-only samples were harvested, and 20 µM nigericin (Sigma) was added to the remaining samples for 45 min. Cells were then harvested by spinning the plates at 1000 x g for 5 minutes. The supernatant was removed and saved for IL-1β western blots and ELISAs, and the cells were washed 3 times with sterile pre-chilled PBS, lysed with 50 µL of RIPA buffer (Boston BioProducts) supplemented with an EDTA-free protease/phosphatase inhibitor cocktail (Roche) by rotating for 5 minutes at 4 °C. The lysed cells were spun at 14,000 × g for 15 min. Next, 40 µL of the clarified lysate was removed and saved for analysis. The protein concentration of each fraction (supernatant and lysate) was evaluated using a Bradford Assay (BioRad) for western blot and qPCR analysis.
FCAS PBMC inflammasome activation in the presence of TH5487 and MCC950
PBMCs from patients harboring the L353P FCAS mutation were a generous gift from Dr. Hal Hoffman (UCSD). Cells were seeded at 2 × 10⁶/ml in 96-well plates in Opti-MEM Reduced-Serum Media (Gibco). Cells were primed with 1.6 µg/ml LPS (Thermo Fisher) for 3 h. During the third hour, cells were treated with 0.1–100 µM TH5487 (Selleck Chemicals), MCC950 (Sigma), or vehicle for 1 h. After the 1 h drug treatment, all the cells were harvested by spinning the plates at 1000 × g for 5 min. The supernatant was removed and saved for IL-1β western blots and ELISAs, and the cells were washed 3 times with sterile pre-chilled PBS, then the pellet was lysed as described above for western blot and qPCR analysis
Bone marrow-derived mouse macrophage cell culture and inflammasome activation assay from WT and NLRP3LP351P/+Esr1cre mice
Bone marrow cells were flushed using DMEM supplemented with 10% FBS, 1% PSG, 1% NaPyruvate and 100 ng/mL M-CSF, and cultured overnight in tissue culture flasks at 37 °C and 5% CO₂ to allow fibroblast adherence. The following day, non-adherent cells were transferred to Petri dishes and differentiated in medium containing 100 ng/mL M-CSF. On day 4, adherent macrophages were washed with cold PBS, detached using pre-warmed 2 mM EDTA in HBSS, centrifuged (400 × g, 5 min, 4 °C), and were seeded at 5 × 10⁴ cells per well in 96-well plates with 20 ng/mL M-CSF and incubated overnight prior to 24 h treatment with 4-hydroxytamoxifen. Cells were subsequently primed with 20 ng/mL GM-CSF overnight, followed by stimulation with ultrapure LPS (InvivoGen) for 4 h. MCC950 was added 1 h prior to LPS; TH5487 and SU0268 were added 3 h post-LPS; and ATP (Sigma-Aldrich) was added to WT cells during the final 30 min of stimulation. Supernatants were collected at 4 h, and IL-1β concentrations were quantified using ELISA (R&D Systems, DY401).
THP1 NLRP3 inflammasome activation by Antimycin A in the presence of TH5487 and SU0268
The viability and concentration of a culture of immortalized human THP1 cells were checked as described above. On day 0, cells at viability >95% and 0.5 × 10⁶ cells/mL were split into 6-well TC-treated plates (Corning) with 2 mL of cells per well and allowed to double overnight. On day 1, 500× lipopolysaccharide (Thermo Fisher) was added to each well for 16 h for a final concentration of 500 ng/mL. On day 2, drugs TH5487 (Selleck Chemicals) or SU0268 (MedChemExpress) were serially diluted in DMSO (Fisher Scientific) such that the addition of any concentration of inhibitor was 1% of the final volume of cells. The inhibitors were added at concentrations ranging from 0.1–100 µM for 1 h, along with a vehicle control added to the 0 µM conditions LPS-only wells were harvested, and Antimycin A (ThermoFisher) was resuspended in DMSO and added to each well for a final concentration of 10 µM for two hours. The supernatant and cells were separated by spinning at 300 x g for 5 min at 4 °C. The supernatant fraction was removed from the cell pellet and clarified by spinning at 3000 x g for 5 min. The cell pellet was resuspended in 1 mL ice-cold PBS and re-pelleted by spinning at 1000 × g for 5 min at 4 °C. The PBS was removed, and the pellet was further processed to separate the cytosolic, mitochondrial, and whole cell fractions. One-third of the pellet was used for whole-cell lysis as described above. The rest of the pellet was resuspended in mitochondrial extraction buffer (220 mM mannitol, 70 mM Sucrose, 20 mM HEPES KOH pH 7.5, 1 mM EDTA, 2 mg/mL BSA) and passed through a 25-G syringe 20 times on ice. Samples were centrifuged at 1000 × g for 15 min at 4 °C, and the supernatant was saved in a new tube. These tubes were further centrifuged at 10,000 × g for 10 min at 4 °C to collect the mitochondria. The supernatant was saved as the cytosolic fraction, and the pelleted mitochondrial fraction was lysed using the whole cell lysis method. The protein concentration of each fraction (supernatant, whole cell, cytosolic, and mitochondrial) was evaluated using a Bradford Assay (BioRad) and western blots were run to quantify protein expression.
Co-immunoprecipitation of NLRP3 inflammasome components
Immortalized human THP1 cells were activated and treated with various small molecules as described above. Cells were lysed gently using 300 µL ice-cold 25 mM Tris pH 7.4, 0.15 M NaCl, 0.001 M EDTA, 1% NP40, 5% glycerol, and protease/phosphatase inhibitor and rotating at 4°C for 5 min. The lysate was clarified by spinning at 13,000 × g for 10 min and the supernatant was saved for protein concentration determination using Bradford assay (abcam ab102535) and co-immunoprecipitation. 100 µg of each sample was used for analysis, with the total volume normalized to 100 µL. An NLRP3 capture antibody (ABclonal A12694) was added to each sample at a 1:200 ratio. The samples were mixed at room temperature for 1 h. While mixing, 50 µL of protein G beads (Millipore Sigma LSKMAGG10) per sample were washed three times with 500 µL PBS + 0.01% Tween using a DynaMag-2 magnet. The beads were resuspended in PBS + 0.01% Tween such that an equal amount of bead suspension (100 µL) could be added to the antibody/sample mixture. This new mixture was rotated at room temperature for 1 h. After incubating, samples were pulled back onto the magnet, the supernatant/unbound fraction was removed, and the beads were washed three times again with 500 µL PBS + 0.01% Tween. Samples were eluted off the beads by adding 15 µL of 4× sample buffer (NuPage) + 6 µL of 10× Reducing agent (NuPAGE) + 39 µL DEPC water and heating for 5 min at 90 °C. The boiled samples were placed on a magnet to pull back the beads. The supernatant was loaded onto a NuPAGE™ 4 to 12%, Bis-Tris 1 mm 15-well mini-gels at 200 V for 30 min. Samples were transferred to PVDF membranes, blocked with 2.5% BSA in TBST, and probed with a primary antibody against NLRP3 (Adipogen), NEK7 (abcam), ASC (Adipogen), or pro-caspase-1 (Cell Signaling). Blots were incubated with an HRP-linked secondary antibody (either mouse, rabbit, or goat, depending on the species of the primary) and imaged using the iBright 1500 Imaging system. The intensities of the bands were quantified using the iBright Analysis Software, where the amount of each protein that co-immunoprecipitated with NLRP3 was quantified by comparing the intensity of the bands associated with pro-caspase-1, NEK7, and ASC to the corresponding NLRP3 band. The intensity values were plotted and analyzed using GraphPad Prism and a one-way ANOVA.
Immunofluorescence assays
Immortalized mouse BMDMs were plated into 12-well plates containing poly-l-lysine (NC9663893; Fisher Scientific) coated coverslips and left to adhere overnight. Cells were treated as previously described in the methods. After cell treatments, cells were washed with phosphate-buffered saline (PBS) to remove medium before cells were fixed with 4% paraformaldehyde (PFA) (sc-281692; Santa Cruz Technology) for 30 min. Coverslips were washed with PBS again and permeabilized with 0.2% Triton X-100 for 10 min while on ice. After blocking with 0.5% bovine serum albumin (BSA) blocking buffer for 30 min, coverslips were incubated with primary antibodies (diluted in 0.5% BSA blocking buffer) overnight at 4 °C. Primary antibodies used were for NLRP3 (AdipoGen, Cryo2 AG-20B-0014-C100) and ASC (AdipoGen AL177). The following day, coverslips were washed before being incubated with secondary antibodies (1:5000 dilution in 0.5% BSA blocking buffer) for 40 min at room temperature. Finally, coverslips were mounted onto glass slides with ProLong Gold antifade reagent with 4′,6-diamidino-2-phenylindole (DAPI) (P36931; Invitrogen) to stain cell nuclei. Images were acquired on a Zeiss LSM-900 microscope with Airyscan using ×20 magnification. The excitation lasers used to capture the images were 488, 568, 630, and 405 nm using Alexa 488–, Alexa 568–, and Alexa 647–conjugated secondary antibodies. The same brightness/contrast profile was applied to all images within the same experiment. Five to ten images were captured per condition, where each image was considered a field. Zeiss and ImageJ imaging software were used for image analyses (an average of 10 cells per field, depending on magnification and cell type). Roughly 1000–1800 total cells were quantified per condition. We performed a Pearson’s Correlation Coefficient analysis and a Manders’ Coefficient analysis with the JACoP Plugin using FIJI software. Our manual percentage ASC speck count of these images validated the automated quantification.
Isolation and quantification of iBMDM and primary human PBMC RNA by reverse transcription PCR (RT-PCR) and Real-Time PCR (qPCR)
Immortalized iBMDM cells or primary human PBMCs were treated in the presence of OGG1 small molecules as described above. Cells were washed with pre-chilled PBS and harvested at 1000 × g for 5 min. The total RNA was isolated from the cells using the RNeasy Mini RNA Purification kit (Qiagen) per the manufacturer’s instructions. The RNA concentration was checked via A260 absorbance, and 5 µg of each sample was used in the reverse transcription reaction using the iScript Advanced cDNA Synthesis Kit (Bio-Rad) per the manufacturer’s instructions. Real-time PCR reactions were prepared with primers against nlrp3, and asc, along with gapdh as a control. Reactions were run using the SsoAdvanced Universal SYBR® Green Supermix (Bio-Rad). The qPCR reactions were run on the CFX Duet Real-Time PCR machine using the following conditions: Initial denaturation at 98 °C for 3 min, then 40 cycles of denaturation at 98 °C for 15 s and annealing at 60 °C for 30 s. This was followed by a melt curve from 65 °C to 95 °C with 0.5 °C steps and 5 s per step. The readout was visualized using the BioRad CFX Maestro Software. The relative amounts of mRNA of either NLRP3 or ASC were calculated using GAPDH as a control. The final ΔΔCq values were plotted and analyzed using GraphPad Prism and a one-way ANOVA.
Isolation of THP1 and PBMC cytosolic, mitochondrial, and nuclear DNA
Wild-type human THP1s or primary human PBMCs were treated in the presence or absence of hOGG1 small molecules as described above. Cells were then washed with pre-chilled PBS and harvested at 1000 × g for 5 min. To isolate the nuclear fraction, the pellet was resuspended in a hypotonic lysis buffer (HLB) (10 mM Tris HCl, pH 7.5, 10 mM NaCl, 3 mM MgCl2, 0.3% NP-40, 10% glycerol) and incubated rotating at 4 °C for 10 min. The mixture was then centrifuged for 2 min at 200 x g. The supernatant was saved as the cytosolic fraction in new tubes, the remaining nuclear pellet was resuspended in HLB, and centrifuged again for 2 min at 200 x g to wash. This step was repeated two more times. The washed pellet was then resuspended in nuclear lysis buffer (NLB) (20 mM Tris HCL, pH 7.5, 150 mM KCL, 3 mM MgCl2, 0.3% NP-40, 10% glycerol), vortexed, and lysed with an 18-gauge needle syringe by pulling up and expelling the liquid 10 times on ice. Both the tube with the pre-saved cytosolic and the newly lysed nuclear fraction were centrifuged for 15 min at 20,000 × g. The supernatant from each was collected into new tubes and used for subsequent DNA purification.
To isolate the mitochondrial fraction, the pellet was resuspended in cold mitochondrial extraction buffer (22 mM mannitol, 70 mM sucrose, 20 mM Tris Base pH 7.5, 1 mM EDTA, 2 mg/mL BSA, and 1 tablet of protease and phosphatase inhibitor (Roche)), then passed through a 25-G syringe (Fisher #14-817-133) 20 times on ice. The mixture was spun at 1000 × g for 15 min at 4 °C, and the pellet was discarded. A second spin on the supernatant was performed at 10,000 × g for 10 min at 4 °C. The supernatant was saved for further purification as the cytosolic fraction, and the pellet was saved for further purification of the mitochondrial fraction.
Real-time PCR (qPCR) analysis of cytosolic, mitochondrial, and nuclear DNA
The cytosolic, mitochondrial, and nuclear fractions of DNA were purified using the AllPrep DNA/RNA Mini Kit (Qiagen) per the manufacturer’s instructions. After purification was completed, the DNA concentration was evaluated by reading the A260 on a nanodrop. qPCR reactions were set up with primers for hTert (nuclear DNA), D-loop (mitochondrial DNA), and GAPDH (control) using the SsoAdvanced Universal SYBR Green Supermix (BioRad # 1725270) per the manufacturer’s instructions. The qPCR reactions were run on the CFX Duet Real-Time PCR machine using the following conditions: Initial denaturation at 98 °C for 3 min, then 40 cycles of denaturation at 98 °C for 15 s and annealing at 60 °C for 30 s. This was followed by a melt curve from 65 °C to 95 °C with 0.5 °C steps and 5 s per step. The readout was visualized using the BioRad CFX Maestro Software. The Cq values obtained for GAPDH DNA abundance served as normalization controls for the DNA values obtained from the test genes. The final ΔΔCq from the cytosolic, mitochondrial, and nuclear fractions of hTert and D-loop were compared, plotted, and analyzed using GraphPad Prism and a one-way ANOVA.
Streptavidin-affinity grid preparation and NLRP3 complex visualization using cryoEM
NLRP3:TH5487 Decemer was mixed with and biotinylated non-oxDNA and incubated on ice for 1 h. The prepared grids are not glow-discharged. A total of 4 µL of sample was added to the non-glow-discharged grids containing a lipid-biotin layer. The grids were placed in the humidity chamber to make them hydrophilic for 5–10 min. The grids were then inverted and touched to wash buffer (50 mM Tris, 150 mM NaCl,10 mM MgCl2, 5% glycerol, 0.01 mM Th5487, 1 mM ADP, pH 7.5) 1–3 times. After touching the grid to buffer, the grid was then touched to 0.01% beta-octyl-glucopyranoside (BOG) in wash buffer. Then, the grid was released in a 20 µl 0.01% BOG drop, picked up with plunging tweezers, inserted into a Leica plunger, and blotted once only on the side with the sample. An additional 4 µL 0.01% BOG was added to the top of the grid. The sample was blotted again, plunged, clipped and loaded onto a Titan Krios microscope equipped with a Falcon 4i camera. A total of 26,390 movies were collected at 0.743 Å /pix at a total dose of 40 e/Å2, an exposure time of 3.25 s, and 37 frames per movie across a defocus range of −1.5 to −2.5 µm. After collection, the movies were motion corrected using RELION MotionCore2, and the streptavidin lattice was subtracted from all micrographs using MatLab43. Corrected micrographs and FFT were visualized using EMAN291.
Immortalized human THP1 cell culture
Immortalized wild-type THP1 cells were purchased from InvivoGen (THP1-Null). Frozen vials were thawed in a water bath and then resuspended in 50 mL of culture media (RPMI no phenol red (Gibco), 10% heat-inactivated FBS (Sigma), 1× Penicillin-Streptomycin-Glutamine (Gibco), 1× non-essential amino acids (Gibco), 1× Sodium Pyruvate (Gibco)). The cells were spun down at 300 × g for 5 min at 4 °C, and the pellet was resuspended in 5 mL of culture media. The cells were counted using a CountesS4 (Invitrogen) and resuspended at 0.3 × 10⁶ cells/mL, doubling every 24–48 h, and maintained according to the manufacturer’s instructions. The cells were counted by diluting 10 µL of cells with 10 µL of Trypan Blue Stain (Thermo Fisher), loading that dilution onto a CountessTM Cell Counting Chamber Slide (Thermo Fisher), and evaluating using a CountessTM 3 FL Automated Cell Counter (Thermo Fisher).
THP1 inflammasome activation in the presence of TH5487, SU0268, and TH10785
The viability and concentration of a culture of immortalized human THP1 cells were checked as described above. On day 0, cells at viability >95% and 0.5 × 10⁶ cells/mL were split into 6-well TC-treated plates (Corning) with 2 mL of cells per well and allowed to double overnight. On day 1, 500× lipopolysaccharide (Thermo Fisher) was added to each well for 16 h for a final concentration of 500 ng/mL. On day 2, LPS-only wells were harvested, and drugs TH5487 (Selleck Chemicals), SU0268 (MedChemExpress), TH10785, or OLT1177 (MedChemExpress) were serially diluted in DMSO (Fisher Scientific) such that the addition of any concentration of inhibitor was 1% of the final volume of cells, along with a vehicle control added to the 0 µM conditions. Then the inhibitors were added at concentrations ranging from 0.001 to 100 µM for 1 h. Next, LPS-only wells were harvested. To activate NLRP3, 20 µM nigericin (Sigma), 20 µM imiquimod (MedChemExpress) or 4 mM ATP was added to each well for 1 h. To activate AIM2, cells were transfected with snon-ox-mtDNA in the presence of Lipofectamine 2000 (ThermoFisher). Cells and supernatant fractions could then be isolated for viability and western blot analysis. The supernatant and cells were separated by spinning at 300 × g for 5 minutes at 4 °C. The supernatant fraction was removed from the cell pellet and clarified by spinning at 3000 × g for 5 min. The cell pellet was resuspended in 1 mL ice-cold PBS and re-pelleted by spinning at 1000 × g for 5 min at 4 °C. The PBS was removed from the pellet, and the cells were lysed with 300 µL of RIPA buffer (Boston BioProducts) supplemented with an EDTA-free protease/phosphatase inhibitor cocktail (Roche) by rotating for 5 min at 4 °C. The lysed cells were spun at 14,000 × g for 15 min. Two hundred microliter of the clarified lysate was removed and saved for analysis. The protein concentration of each fraction (supernatant and whole cell) was evaluated using a Bradford Assay (BioRad), and western blots were run to quantify protein expression.
Immortalized bone marrow-derived mouse macrophage cell culture
Immortalized wild-type and NLRP3-knockout bone marrow-derived mouse macrophages were generously provided to us by Michael Karin at the University of California, San Diego. A frozen vial of cells at 1 × 10⁷ cells/mL was thawed in a water bath and then resuspended in 50 mL of culture media DMEM (Thermo Fisher) supplemented with 10% heat-inactivated FBS (Sigma) and 1% Penicillin-Streptomycin (Thermo Fisher). The cells were spun down at 300 × g for 5 min at 4 °C, and the pellet was resuspended in 5 mL of culture media. The cells were counted as described above. Cells typically doubled in 24–48 h, where they were then scraped from the bottom of the plate using Bio-One Cell Scrapers (Fisher Scientific) and then spun down, counted, and expanded.
Macrophage NLRP3 inflammasome activation in the presence of TH5487, SU0268, and TH10785
The viability and concentration of a culture of immortalized mouse macrophages were checked as described above. Cells at viability >95% and 0.5 × 10⁶ cells/mL were split into 6-well TC-treated plates (Corning) with 2 mL of cells per well and allowed to adhere and double overnight. The next day, 500× lipopolysaccharide (Thermo Fisher) was added to each well for 1 h for a final concentration of 500 ng/µL. Next, drugs TH5487 (Selleck Chemicals), SU0268 (MedChemExpress), or TH10785 were serially diluted in DMSO (Fisher Scientific) such that the addition of any concentration of inhibitor was 1% of the final volume of cells. The inhibitors were added at concentrations ranging from 0.1–100 µM for 1 h, along with a vehicle control added to the 0 µM conditions. Next, LPS-only wells were harvested and 20 µM nigericin (Sigma) or 4 mM ATP was added to each well for 1 h. Cells and supernatant fractions could then be isolated for viability and western blot analysis. To collect samples for western blot analysis, the supernatant was removed from each well and clarified by spinning at 3000 × g for 5 min. The cells left on the plate were washed with ice-cold PBS and then lysed with 300 µL of RIPA buffer (Boston BioProducts) supplemented with an EDTA-free protease/phosphatase inhibitor cocktail (Roche). The lysis took place for 5 min, rocking at 4 °C. The lysed cells were then collected into 1.5 mL tubes and spun at 14,000 × g for 15 min. Next, 200 µL of the clarified lysate was removed and saved for western blot analysis. The protein concentration of each fraction (supernatant and whole cell) was evaluated using a Bradford Assay (BioRad), and western blots were run to quantify protein expression.
IL-1β secretion quantification by ELISA
Inflammasome activation was measured by an enzyme-linked immunosorbent assay (ELISA) against human or mouse IL-1β, depending on whether the samples were from primary human PBMCs, THP1 cells, or iBMDMs. Both human and mouse IL-1β kits were purchased from Abcam and used according to the manufacturer’s instructions. Each assay was performed the same, with specific reagents for each kit. Briefly, Standards were reconstituted in Standard Diluent Buffer and serially diluted 5 times from 500–15.6 pg/mL (human) or 6 times from 100–1.56 pg/mL (mouse). A buffer alone blank control was also included for both. Included antibody-coated microplate strips were removed, and 50–100 µL of each standard, blank, and sample was added to the appropriate cells. Antibody was added to the wells for 1 h (mouse) or 3 h (human). Sample wells were washed with the included wash buffer 3 times. Specifically for the human ELISA, a secondary streptavidin-HRP antibody was added to the wells for 30 min, and then washed. TMB solution was added to each well of both ELISAs for 10 min shaking at 400 rpm in the dark. Stop solution was added to each well, and the absorbance at 450 nm was read immediately using a Synergy H1 plate reader (BioTek). The data were plotted and analyzed using GraphPad Prism and a one-way ANOVA.
Protein quantification and analysis by Western Blot
Total protein concentration was determined and normalized using a Bradford Assay (abcam #ab102535). To evaluate proteins secreted from the cells (Caspase-1 and IL-1β), the supernatant fractions were run on Western blots. To evaluate proteins expressed inside the cell (NLRP3, Caspase-1, FEN1, hOGG1, and Actin), the lysate fraction was run. Samples were diluted with LDS sample loading buffer and reducing agent (Invitrogen), each at a final concentration of 1×. The samples were boiled at 90 °C for 5 min and run on NuPAGE™ 4 to 12%, Bis-Tris 1 mm 15-well mini-gels at 200 V for 30 min at 4 °C. Samples were transferred to PVDF membranes at 4 °C using an Invitrogen mini blot module for 1 h at 25 volts. Membranes were then blocked with 2.5% BSA (Geminibio) in TBST, and probed with a primary antibody against the specific protein diluted to the manufacturer’s recommendation in 2.5% BSA in TBST. Blots were incubated with an HRP-linked secondary antibody (either mouse, rabbit, or goat, depending on the species of the primary) and imaged using the iBright 1500 Imaging system (Thermo Fisher). Western blot band intensities were quantified using iBright image analysis software. For each blot, a region of interest (ROI) was drawn around each band, and an identically sized ROI was placed in a nearby area lacking signal to determine local background. Background intensity was subtracted from the raw band intensity to obtain background-corrected values. The background-corrected intensity of the positive control band (LPS/ATP or LPS/nigericin) was measured for each blot and defined as 100%. To normalize all other samples relative to this control, the background-corrected intensity of each sample was divided by the intensity of the corresponding positive control and multiplied by 100, yielding values expressed as a percentage of the control. When applicable, the target protein signal was further normalized to the loading control (β-actin or GAPDH, or total protein) by dividing the background-corrected target band intensity by the background-corrected loading control intensity for the same lane prior to normalization to the positive control. Quantification was performed on independent biological replicates, and normalized values were used for downstream statistical analysis using GraphPad Prism
Ponceau staining
To verify consistent loading in the supernatant samples, Ponceau staining was performed per the manufacturer’s instructions (Sigma, #P7170). After western blot analysis as described above, membranes were incubated with 30 mL of Ponceau S solution for at least 15 min while rocking. To destain the membrane, the Ponceau S solution was removed, and the membrane was incubated with 30 mL of DI H2O for 1 min, then imaged using the iBright 1500 Imaging system (Thermo Fisher).
Cell death quantification by LDH measurement
To quantify the viability of cells pre/post-treatment, the amount of lactate dehydrogenase (LDH) secreted into the media was measured. This was done using the CytoTox 96 Non-Radioactive Cytotoxicity Assay (Promega) per the manufacturer’s instructions92. A 50 µL aliquot of all cell samples and a no-cell control were added to a 96-well plate and incubated with 50 µL CyTox 96 Reagent in the dark for 30 min at room temperature. After the incubation, 50 µL of Stop Solution was added to each well, and the absorbance was read at 490 nm using a Synergy H1 plate reader (BioTek). The percentage of toxicity was calculated based on the Maximum LDH release controls and plotted and analyzed using GraphPad Prism and a one-way ANOVA.
Purification of full-length NLRP3 decamer bound to TH5487
Wild-type NLRP3 was cloned into the mammalian expression vector pcDNA3.1HisB. The plasmid was expressed in DH5α cells (New England Biolabs) and purified using the PureLink HiPure Plasmid Maxiprep Kit (Thermo Fisher). The protein was expressed using the Expi293 Expression System (Thermo Fisher) in the presence of 0.01 mM TH5487 in DMSO. Cells were grown in Expi293 expression media until they reached a concentration of 3 × 10⁶ cells per milliliter and sustained viability of ≥95% live cells. At that time, 1 μg of expression vector was transfected per every 1 mL of cells with Expifectamine reagent. Once the cells reached viability of ≤80% live cells, they were harvested by spinning at 300 rpm for 5 min. The supernatant/dead cells were aspirated from the top, and the pellet was washed with cold PBS. Cells were resuspended in lysis buffer containing 50 mM Tris, 150 mM NaCl, 0.5 mM TCEP, 10 mM MgCl2, 0.01 mM TH5487, 1 mM ADP, 0.1 mM PMSF pH 7.5. The suspension was lysed by sonication with 5 s on, 10 s off, for a total of 4 min at 40%. The soluble lysate fraction was isolated by centrifuging at 100,000 × g for 1 h and further clarified by filtering through a 0.45 µm syringe filter. A HisTrap FF crude 5 mL column was equilibrated in binding buffer (50 mM Tris, 150 mM NaCl, 10 mM MgCl2, 5% glycerol, 0.01 mM Th5487, 1 mM ADP, pH 7.5). After the sample was loaded onto the column, it was washed with 10 column volumes (CV) of the wash buffer above, then eluted with 250 mM imidazole using a 50% gradient of the buffer 50 mM Tris, 150 mM NaCl, 10 mM MgCl2, 5% glycerol, 500 mM imidazole, 0.01 mM TH5487, 1 mM ADP, pH 7.5. Peak fractions were pooled, and the affinity-purified protein was crosslinked using 0.5 mM bis(sulfosuccinimidyl)-suberate (BS3) for 30 minutes at 4 °C. BS3 is a short, amine-reactive cross-linker used primarily stabilize pre-existing interactions. This cross-linking was used as a mild stabilization strategy to capture structurally relevant assemblies in the presence of the drug. The reaction was quenched by the addition of 100 mM ammonium hydrogen carbonate for 15 min at 4 °C. The cross-linked protein was further purified by size exclusion using a HiLoad 16/600 Superose 6 pg size exclusion column equilibrated in binding buffer. Peak fractions were concentrated to ~10 mg/mL and visualized by SDS and Native gels, and western blots against NLRP3.
AlphaFold structural modeling of NLRP3 bound to DNA
AlphaFold simulations were performed using the AlphaFold3 Google server on the NLRP3 sequence alone in combination with the DNA template. For these simulations, we used the pyrin domain of NLRP3 (residues 1–85) or a full monomer (residues 1–1036) from PDB 7PZC (PMID: 35114687). The DNA sequence used was the DNA sequence published in PDB 1EBM (PMID: 10706276), which is the oxDNA used in the structure of hOGG1 bound to DNA. Predicted complexes were evaluated using AlphaFold confidence metrics, including per-residue pLDDT and predicted aligned error (PAE), and the highest confidence models were selected. Structural visualization and figure preparation were performed using ChimeraX.
NLRP3 bound to TH10785 model generation using SWISS-MODEL
The amino acid sequence of hOGG1 that aligned with the NLRP3 pyrin domain (249-325) was saved as a “.pdb” file from the published structure of hOGG1 bound to ox-DNA (PDBID: 1EBM)14. The sequence was uploaded to SWISS-MODEL as the User Template Modeling template file93. Then, various truncations of the NLRP3 pyrin domain were loaded as test target files to see which generated a viable model. Empirically, NLRP3 amino acids 1–85 were chosen. The SWISS-MODEL projection produced one model of NLRP3 based on the template hOGG1 structure. This model was further analyzed using ChimeraX to compare it to the published structures of wild-type NLRP3 (PDB1D: 7PZC) and hOGG1 bound to activator TH10785 (PDBID: 7AYY)94,95.
Quantification and statistical analysis
A one-way ANOVA, two-way ANOVA, or nonlinear regression was used to conduct all statistical analyses herein. All statistical analyses were performed as indicated in the figure legends, where N represents the number of replicates. Bar graph data were presented as mean ± SEM. Line graph data were presented as mean ± SD. P-values < 0.05 were considered statistically significant.
Study approval
Studies performed using PBMCs obtained from patients with CAPS and FCAS mice received the approval of the University of California Human Research Protection Program committee (number 180064), and informed consent was obtained from the subjects before the study. All ethical regulations relevant to human research participants were followed.
Inclusion and ethics
We, the authors, have read the Nature Portfolio Authorship Policy and confirm that this manuscript complies. All authors have contributed to the manuscript and approved the final version.
Reporting summary
Further information on research design is available in the Nature Portfolio Reporting Summary linked to this article.