
Class II SCT library enables reliable ex vivo identification of antigen-specific CD4+ T cells
We previously reported on the APMAT method for the high-throughput profiling of class I-restricted CD8+ T cell responses to viral and tumor neoantigens7,8,9,10. An enabling technology of APMAT was the use of class I SCT libraries. SCTs are mammalian cell-expressed proteins engineered to emulate pMHC molecules10. APMAT-CD4 builds upon this foundation through the development of a modular platform for the scalable generation of human class II SCT libraries (Fig. 1), extending prior murine constructs7,23. For class II, the SCT architecture links HLA α, antigen, and HLA β extracellular domains via flexible glycine-rich linkers (L1 and L2) (Fig. 1a). A partial invariant chain (pIi) enhances SCT stability, while the linker configuration maintains structural integrity23,24. An antigen library is genetically encoded into the template for a given MHC allele using two overlapping primers designed via a custom algorithm (Fig. 1b, Methods, and Supplementary Data 1). This approach supports high production efficiency while avoiding peptide synthesis, and achieves a >99% success rate as confirmed by PCR (Supplementary Data 1). Conserved regions for pIi and linker sequences allow rapid antigen exchange and allele substitution. SCT protein expression is achieved by the transient transfection of human-derived Expi293F cells in a multi-well format, followed by biotinylation and purification workflows optimized for large-scale production.

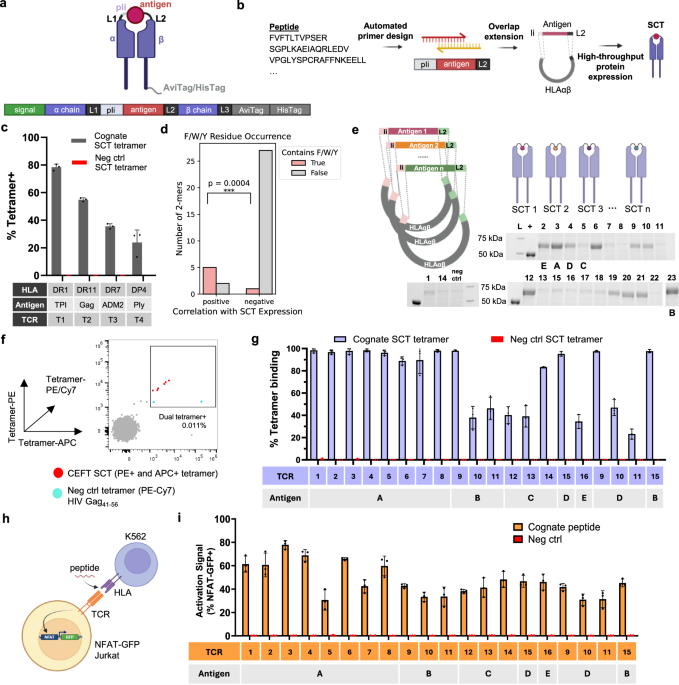
a Genetic design encoding the class II SCT protein. The MHC α and β chains are connected to the antigen through flexible linkers (L1, L2, and a partial invariant chain pIi), followed by purification tags (AviTag/HisTag). A secretion signal is placed upstream of the α chain to facilitate protein export. Created in BioRender76. b Streamlined workflow for high-throughput SCT plasmid construction and protein expression. High-throughput production of SCT libraries is enabled by automated primer design and an optimized pipeline for plasmid assembly and protein expression/purification. Created in BioRender76. c Flow cytometric assay to assess binding of SCT tetramers of various common class II HLA alleles to their cognate TCRs (n = 3). Previously reported TCR-antigen pairs: DRB1*01:01 (DR1) – mutTPI23-37:T28I, DRB1*11:01 (DR11) – HIV Gag299-311, DRB1*07:01 (DR7) – ADM251–65, DPB1*04:01 (DP4) – mutPly427–441 (Supplementary Data 1). d Comparison of the occurrence of aromatic residues F/W/Y in 2-mers that are positively correlated with SCT expression versus those that are negatively associated. The p value was calculated using Fisher’s exact test on the full 2 × 2 contingency table comparing F/W/Y presence across groups. e A 23-Element DRB1*01:01 CEFT SCT library. SCT expression was evaluated through SDS-PAGE. L, molecular weight ladder; +, protein standard for quantification of expression level. Schematics created in BioRender76. f Antigen-specific T cells were detected through dual tetramer staining to enhance the true positive rate. An HIV Gag41–56 SCT tetramer was used to exclude non-specific binding cells. A representative flow cytometry plot is shown. g Tetramer binding validation of 16 identified CD4 TCRs, each reactive to one of the five CEFT antigens (A–E) (n = 3). Error bars represent standard deviation. h Schematic of peptide-pulsed activation assay. TCR-transduced NFAT-GFP Jurkat cells were co-cultured overnight with peptides and DR1-K562 cells. Created in BioRender76. i T cell activation measured through the percentage of GFP+ Jurkats (n = 3). P < 0.01 for each group relative to the negative control peptide. Statistical significance was determined by a one-tailed independent t-test assuming equal variances. All replicates are biological replicates. All bar plots (n = 3) are presented as mean values ± SD. Source data are provided as a Source Data file.
To benchmark performance, we first validated the specificity of class II SCTs against conventional pMHCs. A DRB1*01:01-restricted (DR1) SCT presenting the influenza HA306-318 epitope effectively stained a matched influenza-specific CD4+ T cell line, demonstrating binding performance comparable to standard pMHC tetramers with no evidence of non-specific binding from an HIV-specific SCT negative control (Supplementary Fig. 1a). Sensitivity was evaluated by spiking known frequencies of influenza-specific T cells into healthy donor PBMCs. SCT tetramers could detect target cells as low as 0.05% with a recovery rate similar to conventional pMHC tetramers (Supplementary Fig. 1b).
We then expanded validation to additional prevalent class II HLA alleles25,26, selecting literature-validated TCR-antigen pairs for one HLA-DP and three HLA-DR alleles27,28,29,30,31 (Supplementary Data 2). TCRs were cloned into TCRKO Jurkat cells via lentiviral transduction and evaluated for binding against their cognate SCTs. Each SCT specifically recognized its matched TCR, with no evidence of cross-reactivity to unrelated SCTs (Fig. 1c and Supplementary Fig. 1c). Notably, SCTs displayed post-translational modifications consistent with natural antigen processing, in contrast to synthetic peptide-based approaches (Supplementary Fig. 1e). We further investigated whether SCT expression is influenced by peptide motifs using a regression-based 2-mer association analysis. Several 2-mers, including FP, PF, and VR were positively correlated with SCT expression (ρ = 0.223–0.304), while others like SS, DL, CR, and RS showed weak to moderate negative correlations (ρ = −0.389 to −0.223, FDR <0.05) (Supplementary Fig. 1d). Given that class II peptide-MHC binding is shaped by anchor residues—especially the P1 peptide-binding pocket, which favors aromatic amino acids (F, Y, W)32,33—we tested whether these residues are enriched among positively correlated 2-mers. Fisher’s exact test confirmed a significant enrichment of F/Y/W in the positively associated group (P = 0.0004), and their underrepresentation among negatively correlated 2-mers (Fig. 1d). This pattern aligns with known HLA-DR1 antigen presentation preferences32,33 and suggests that SCT expression reflects epitope compatibility with MHC class II. These findings underscore class II SCTs as a robust platform for generating pMHC-like reagents capable of highly sensitive and specific CD4+ T cell detection.
Following validation of individual SCTs, we evaluated the performance of SCT libraries in direct ex vivo screening for common pathogen-specific CD4+ T cells in healthy donor peripheral blood mononuclear cells (PBMCs). For this task, we assembled a 23-element SCT library presenting DR1-restricted canonical antigens from cytomegalovirus (CMV), Epstein-Barr virus (EBV), influenza, and tetanus (the CEFT library) (Fig. 1e and Supplementary Data 3). A DR1-restricted HIV Gag41-56 SCT was used as the negative control. PBMCs from five HLA-matched healthy donors were enriched for CD4+ T cells and stained with PE- and APC- labeled SCT tetramers (Supplementary Fig. 1f). Double-positive cells were sorted for single-cell sequencing of paired TCRα/β chains, while cells binding to negative control tetramers were excluded (Fig. 1f and Supplementary Fig. 1g). TCRs identified in this way were cloned into TCRKO NFAT-GFP Jurkat cells (Supplementary Data 4) and evaluated for SCT binding (Fig. 1g). We confirmed TCR recognition to cognate antigens, with varying binding intensities suggesting differential recognition capacities among TCRs. To further assess whether SCTs faithfully model antigen presentation on MHCII, we tested these TCRs in a peptide-pulsed activation assay (Fig. 1h) using DRB1*01:01-expressing K562 cells with an empty peptide-binding pocket (DR1-K562)34,35,36. Co-culture with cognate peptides induced NFAT-based activation in all TCR+ Jurkat clones (Fig. 1i) identified through the SCT library screen. Clones 9, 10, 11, and 15 showed consistent tetramer binding and activation to peptides (B and D) that share the same core sequence (Supplementary Data 5). These results demonstrate that SCT libraries enable direct ex vivo discovery of functionally validated CD4+ TCR-antigen pairs with high specificity and sensitivity.
High-throughput screening of the entire SARS-CoV-2 receptor-binding domain identifies large-scale antigen-specific CD4+ T cells
We next explored the full APMAT-CD4 technique by using class II SCT libraries to systematically screen for antigen-specific CD4+ T cell responses against the SARS-CoV-2 spike protein receptor-binding domain (RBD) in a longitudinal patient cohort. This domain, which is a dominant target of protective antibodies37,38,39,40,41, is encoded by most SARS-CoV-2 vaccines, and CD4+ T cells specific to RBD presumably play a role in the development of B cell immunity. Thus, we constructed a 54-element SCT library spanning the entire RBD in four amino acid increments (Fig. 2a) to systematically profile CD4+ T cell responses. Of these, 46 SCTs were prepared in usable quantities (Supplementary Fig. 2a and Supplementary Data 6). An additional 18 SCTs representing reported epitopes from spike (S), membrane (M), and nucleocapsid (N) proteins were also included14,42,43,44 (Supplementary Data 6 and Supplementary Fig. 2a).

a Design of an SCT library with overlapping 15-mer peptides spanning the entire RBD of the SARS-CoV-2 spike protein. b. Schematic overview for the experimental workflow of high-throughput screening. 50 PBMC samples from 22 HLA-DR1+ participants were barcoded by timepoint, pooled, enriched for CD4+ T cells, stained with the 64-element SCT-dextramer pool, FACS-sorted, and sequenced. Single-cell analysis included RNA expression profiling, TCRαβ sequencing, antigen-MHC pairing, and timepoint identification. Comparison of genetic variants between transcriptome and whole-genome sequencing (WGS) was used to demultiplex patient identity (Methods). Created in BioRender76. c Correlation between SCT expression levels, quantity of antigen-specific cells captured, and predictions from class II antigen-presentation algorithms. SCT expression quantified prior to purification (n = 2–4 biological replicates). Data were shown as mean ± SEM. %Rank_EL, percentile rank of eluted ligands. d Clonal and patient diversity in CD4+ T cell responses to each SARS-CoV-2 antigen. Antigens are color-coded based on their parent protein. e Tetramer binding validation of SARS-CoV-2-specific CD4 TCRs. A representative subset of SARS-CoV-2 TCRs (n = 10) from Fig. 2d were selected and validated through SCT tetramer binding assays with biological triplicates. A DR1-restricted influenza A M117–31 SCT was used as the negative control. f Peptide-pulsed activation of SARS-CoV-2 CD4 TCRs in NFAT-GFP Jurkats (n = 3). e, f P < 0.0001 for each group relative to the negative control peptide, determined by one-tailed independent t-test assuming equal variances. Exact P values are provided in the Source Data. All replicates are biological replicates. All bar plots (n = 3) are presented as mean values ± SD. Source data are provided as a Source Data file.
The complete 64-element SCT library was multimerized using fluorophore-labeled, DNA-barcoded dextramers and pooled to stain CD4+ T cells from 50 PBMC samples across DRB1*01:01-positive participants (n = 22) (Fig. 2b). Samples spanned multiple time points, ranging from acute infection (AC, <1 week of infection) through convalescence (CV, 2–3 months post-acute) to, for some donors, long-term follow-up (6 to 36 months) (Supplementary Data 7). Hashtag antibodies were included to facilitate time point deconvolution. Dextramer-positive CD4+ T cells were isolated by FACS and subjected to single-cell sequencing, yielding paired whole transcriptome, TCR sequence, epitope specificity, HLA restriction, and patient/timepoint origin (Fig. 2b). After data processing (Methods), we identified a total of 2188 antigen-specific CD4+ T cells, with cells detected across all donors.
Analysis of SCT expression revealed limited correlations with in silico MHC-binding predictions (Fig. 2c and Supplementary Fig. 2b), consistent with known challenges in prediction algorithms. Cell capture was independent of SCT expression level, predicted binding affinity, or percentile rank, in contrast to class I SCT platforms45. These results underscore the enabling use of class II SCT libraries for systematic empirical screening.
The broad diversity of T cell clonotypes captured by each SCT, as well as the wide distributions of antigen-specific CD4+ T cell across participants, suggested that the observed responses were not skewed by donor, clonotype, or antigen bias (Fig. 2d). Clonal expansion was observed in responses to 42 of 64 antigens and in 49–58% of cells across time points (Supplementary Fig. 2c). We further validated epitope-specific TCRs through tetramer binding and peptide-pulsed activation on selected clonotypes (Fig. 2e, f and Supplementary Data 8), confirming the fidelity of the methodology.
Multi-modal and high-dimensional profiling empowers deep characterization of CD4+ T cells at single-cell resolution
The full APMAT-CD4 dataset involved the integration of multiple dimensions of information (Fig. 3a, Methods). Each T cell is profiled through three parallel sequencing libraries: (1) whole transcriptome, (2) TCR αβ sequences, and (3) a surface protein library which decodes MHC-restricted antigen specificity and timepoint origin via DNA-barcoded dextramers and hashtag antibodies. Patient identity is resolved by matching transcriptome-derived genetic variants to corresponding whole-genome sequencing profiles, and a total of 593,905 single-nucleotide polymorphisms (SNPs) were used for complete demultiplexing of patients (Supplementary Fig. 3a).

a Graphical description of the high-dimensional data extracted from each single antigen-specific CD4+ T cell. Created in BioRender76. b UMAP projection of single-cell transcriptomic profiles from SARS-CoV-2-specific CD4+ T cells. c Longitudinal trajectories of CD4+ T cell phenotypes stratified by antigen clusters. Antigens are grouped based on early response patterns at timepoint AC, and the corresponding CD4+ T cell phenotypes are tracked over time to reveal the immunological dynamics for each cluster. d Immunogenicity ranking of DRB1*01:01-restricted SARS-CoV-2 antigens. Each property contributing to immunogenicity was scored on a log2 scale (0 to 5) and summed to generate a composite score. e Correlation of donor immunogenicity score with antibody level. Scatter plots fitted with linear regression lines and 95% confidence intervals (gray shaded areas) showing the correlation of donor immunogenicity score with RBD antibody titers. Statistical significance was determined using a two-sided Pearson correlation; correlation coefficients (R) and P values are shown. f Phenotypic evolution of CD4+ T cells induced by antigens of low, medium, and high immunogenicity. Source data are provided as a Source Data file.
To dissect CD4+ T cell states, all antigen-specific CD4+ T cells were clustered by gene expression similarity and projected onto a uniform manifold approximation and projection (UMAP) (Fig. 3b, Methods). Phenotypic annotation based on canonical markers identified major subsets including naïve-like/central memory TCM (SELL, CCR7, TCF7, and LEF1)46,47,48,49, effector memory TEM (S100A4, AHNAK, IL32, and CLIC1)47,50,51, Th1 (TBX21, IFNG, STAT4, RUNX3, and CCL5)1,47, Treg (FOXP3)1,46,47, and Th17 (RORC, KLRB1, and CCR6)47 (Supplementary Fig. 3b). A subset of Th1 cells upregulates cytotoxic markers (NKG7, CST7, GNLY, PRF1, TNF, and granzymes)47,48,52, while the exhausted-like phenotype is characterized by high expression of exhaustion markers (PDCD1, TIGIT, LAG3, and CTLA4)48. Additionally, a small cluster of cells displays high expression of proliferation markers, including MKI67, MYBL2, BUB1, PLK1, and CCNE153. These clusters reveal distinct phenotypic variations among SARS-CoV-2-specific CD4+ T cells.
T cell responses to viral infection are expected to evolve over the course of disease, and by integrating epitope, timepoint, and transcriptional information, this dataset provided an opportunity to map such dynamics for viral-specific CD4⁺ T cells in an HLA-matched cohort (Fig. 3c). Antigen-induced responses were phenotypically polarized at early timepoints, with distinct biases toward naïve-like/TCM, exhausted-like, and TEM (Fig. 3c, Methods). Longitudinal tracking revealed a convergence toward TEM phenotypes, consistent with previous reports on the evolution of CD4+ T cell responses following antigen stimulation54, although very distinct from CD8+ T cell dynamics10.
T cell antigens can exhibit widely varying degrees of immunogenicity in terms of response generated within and across different patients, as well as through downstream factors such as how they influence B cell maturation. We established a quantitative scoring framework incorporating: (1) the number of unique TCR clonotypes per antigen, (2) the fraction of responding donors, (3) longitudinal persistence, and (4) clonal expansion (Methods). These metrics were log2-transformed, aggregated, and used to rank antigens into high, medium, and low immunogenicity categories (Fig. 3d and Supplementary Fig. 3c), revealing an antigen-dependent T cell response that varies by several orders of magnitude. We note that sample distribution varied across timepoints, with long-term sampling available from four patients who experienced prolonged COVID symptoms. Low to moderate inter-parameter correlations (ρ = 0.23–0.64) indicate that each parameter retains a degree of independent information (Supplementary Fig. 3d). To quantitate whether this metric associated the promotion of B cell maturation, we calculated immunogenicity scores for each donor against the RBD antigens at acute infection (see Methods), and then plotted those scores against RBD-specific antibody titers in those same patients at convalescence (Fig. 3e). In fact, the analysis revealed a statistically significant (P = 0.02) association, suggesting that CD4+ T cell responses against DRB1-restricted RBD antigens may play a role in B cell maturation against closely related epitopes.
We next folded in transcriptomic information to query how antigen immunogenicity influenced phenotype kinetics from acute disease to recovery. The most immunogenic antigens exhibited an exhausted-like CD4+ T cell phenotype during acute disease that transitioned towards an effector memory phenotype over time. In contrast, low-immunogenicity antigens induced naïve-biased responses with limited evolution (Fig. 3f). While clonal expansion exhibited little phenotype bias, clonal persistence was largely biased towards Tem and exhausted-like phenotypes (Supplementary Fig. 3e). We also identified multiple public TCRs, which are TCRs shared across individuals (Supplementary Fig. 3f).
Finally, we carried out a case study of a donor (INCOV042) who was suffering from long Covid, and for whom we had serial blood draws extending out to 3 years post initial infection. In fact, we documented continued SARS-CoV-2-specific CD4+ T cell functional activity (Supplementary Fig. 2d) that only receded at the 3-year time point. Whether such ongoing CD4+ T cell activity is consistent with reports of antigen or viral persistence in some long Covid patients55,56,57, or whether it associates with serial vaccinations, will require a larger cohort study. However, this intriguing result suggests the value of such a study for identifying biomarkers of long Covid.
Collectively, this high-throughput, multi-modal approach enables systematic identification and deep characterization of the immunogenicity, at multiple levels, of both class II-restricted viral antigens, and the responding antigen-specific CD4+ T cells. It also allows for documentation of how such immunogenic responses to infections vary across patients.
Whole-protein screening of HPV-16 E6/E7 uncovers CD4 TCRs with strong therapeutic potential for cancer immunotherapy
We next explored the application of APMAT-CD4 to cancer, by performing a comprehensive screening of the oncogenic HPV-16 proteins E6 and E7 for CD4 TCR repertoire profiling. While over 200 HPV genotypes have been identified, HPV-16 infection poses the highest risk for cervical, oropharyngeal, anal, vaginal and other HPV+ cancers. The HPV-16 viral oncoproteins E6 and E7 are constitutively expressed in a functionally obligate manner in HPV-16-associated cancers and precursor lesions, such as cervical intraepithelial neoplasia 2/3 (CIN2/3), making them ideal targets both for TCR profiling and for providing insights into class I and II antigen recognition. While HPV-specific CD8+ TCR-T therapies have demonstrated clinical benefit58,59,60,61, the contribution of HPV-reactive CD4+ T cells—despite growing evidence of their critical roles in anti-tumor immunity3—remains poorly defined.
Unlike class I MHC, which typically presents peptides of fixed length, class II MHC has an open binding pocket that accommodates variable-length antigens consisting of a 9-mer core flanked at the N- and/or C-termini by peptide flanking regions (PFRs). Recent studies suggest that PFRs may modulate CD4+ TCR recognition, yet their functional relevance remains poorly understood62,63,64,65. To investigate this concept, we designed a comprehensive 92-element SCT library spanning the full E6 and E7 protein, covering all possible lengths (13-25-mer) of putative antigens, with special focus on screening peptide families of varying lengths that share the same core antigen (Fig. 4a, Methods, and Supplementary Data 9). Eighty-five SCTs were prepared in usable quantities after purification for downstream screening. We included an additional 11 common viral antigen-specific SCTs (CEF) as positive controls to complete a 96-element SCT library. We tested whether sensitivity of individual SCTs is maintained in large SCT pools by evaluating the recovery of spiked-in C-3 Jurkat cells into H2 Jurkat cells at 1, 0.1, and 0.01% frequencies (Supplementary Data 10 and Supplementary Fig. 1h). Flow cytometry analysis showed that 70–90% of C-3 cells were successfully recovered at all conditions, demonstrating that sensitivity is preserved even when pooling up to 96 SCTs, and confirming the scalability of the platform.

a Antigen coverage across oncogenic proteins E6 and E7 in the SCT library for whole-protein screening. Left panel schematics created in BioRender76. b Schematic overview of TCR repertoire profiling integrated with other key modalities. Created in BioRender76. c Antigen specificity validation of HPV-specific CD4 TCRs (H1–H5) through tetramer binding and peptide-pulsed activation assays (n = 3). ****P < 0.0001, *P < 0.05, ns P > 0.05 labeled for each group relative to the negative control peptide. d Polyfunctionality of TCR-transduced primary CD4+ T cells assessed by cytokine production (IFNγ, TNF, IL2, and GZMB) via ELISA assay following antigen stimulation (n = 3). OD450 values were normalized to TCR expression levels across each cytokine. ****P < 0.0001, ***P < 0.001, **P < 0.01, *P < 0.05, and unlabeled tiles indicate P ≥ 0.05, all relative to negative control peptides. e Cytotoxicity of TCR-transduced CD4+ T cells against DR1-K562 cells pulsed with cognate HPV-16 E6 peptides, monitored over 42 h (n = 2). The heat map summarizes mean target cell killing at the 42-h time point. Non-cognate peptides served as negative controls for each TCR. f Cross-reactivity of TCR H2 and H5 against human self-antigens (n = 2). H2- and H5-TCR-transduced T cells were co-cultured with LCLs pulsed with peptides identified from BLAST search and motif scans (Supplementary Data 9). H2 TCR used a single 1 µM dose; H5-TCR was dose titrated at 1, 2, and 10 µM. g Alloreactivity screen. H2- and H5-TCR-transduced CD4+ T cells were tested against 41 LCL lines representing 92 distinct class II HLA alleles (n = 2). DRB1*01:01-positive LCLs (n = 4) pulsed with peptide L-2 (E691–107) or F-2 (E6129–142) served as positive controls. Alloreactivity of H5 to HLA-DRB1*13:05-positive LCLs is marked with arrows. h Confirmation of H2 TCR reactivity to naturally processed E6 antigen. DRB1*01:01+ LCL (GM17281B) was titrated with full-length E6 protein (0–10 μg/mL), co-cultured with H2 TCR-transduced CD4+ T cells, and evaluated for IFNγ secretion (n = 2). A DRB1*01:01- LCL (GM12244A) served as a negative control. Statistical significance was determined by a one-tailed independent t-test assuming equal variances. All replicates are biological replicates. All bar plots where n = 3 are presented as mean values ± SD. Source data are provided as a Source Data file.
We applied this library to longitudinal, participant-matched PBMCs from patients with HPV-16+ CIN2/3 enrolled in a neoadjuvant protocol of a therapeutic HPV-16 vaccination study. The vaccine regimen included a heterologous DNA-prime, recombinant vaccinia boost targeting HPV-16/18 E6 and E7, with and without topical application of the TLR7/8 agonist, imiquimod (Aldara®). PBMCs were collected at baseline, post-vaccination, at resection, and four weeks postoperatively (n = 3), with one additional donor from an artesunate treatment trial (n = 1)66 (Supplementary Fig. 4a and Supplementary Data 11). Samples were prelabeled with hashtag antibodies for patient and timepoint demultiplexing, stained with DNA-barcoded SCT dextramers and surface protein antibodies, sorted, and subjected to single-cell sequencing to capture TCR repertoire, transcriptome, antigen specificity and surface protein expression (Fig. 4b, Methods). UMAP clustering annotated distinct CD4 + T cell phenotypes (Supplementary Fig. 4b, d). Integration of data across modalities was validated through assessing the accuracy of alignment between transcriptomic and surface protein expression (Supplementary Fig. 4e). We also identified CEF-specific TCRs that matched or clustered with publicly available TCRs through GLIPH analysis36,67, further benchmarking the accuracy of large SCT pools in capturing cognate TCRs (Supplementary Data 12, 13). Notably, the exhausted-like phenotype, which was prominent (and known48) in the SARS-CoV-2-specific CD4+ T cells (Fig. 3b) were absent in this context.
Across the cohort, we identified 112 HPV-16-specific CD4+ T cells. We selected a subset of 25 CD4 TCRs for in-depth functional characterization, with a preference for clonally expanded and persistent clonotypes, and identified five CD4 TCRs (H1–H5) as E6-specific (Supplementary Fig. 4c and Supplementary Data 14). The epitopes for TCRs H1, H3, H4, and H5 all share the same core, while H1, H2, and H4 are each cross-reactive to antigens sharing the same core (Supplementary Data 14), underscoring the role of the core epitope in TCR engagement68. We tested these TCRs through an increasingly sophisticated set of binding and functional assays. We first validated their specificity through tetramer binding (Fig. 4c, left). Peptide-pulsed activation of TCR-transduced NFAT-GFP Jurkats revealed that tetramer binding does not always translate into downstream activation, at least in this assay (Fig. 4c, right). This result highlights the critical role of PFRs in modulating functional outcomes for these two TCRs.
To further investigate their therapeutic potential, we transduced these five TCRs into TCRKO primary CD4+ T cells enriched from healthy donors and confirmed their specificity via tetramer staining (Supplementary Fig. 4f, g). Notably, the knock-in efficiency was markedly lower in CD8+ than CD4+ T cells (Supplementary Fig. 4h). We then evaluated these TCRs through additional functional assays. We first assessed a suite of cytokine secretion (IFNγ, TNF, IL2, and GZMB) in response to peptide-pulsed DR1+ K562 cells (Fig. 4d). TCRs H2, H3, and H5 displayed on-target secretions of all cytokines, while H4 showed minimal secretion for most peptides except F-7, despite strong tetramer binding to the broader peptide family sharing the same core (F-3 to F-7). These results were consistent with cytotoxicity assays in which TCR-transduced CD4+ T cells, with varying expression levels (Supplementary Data 15), were co-cultured with DR1+ K562 cells pulsed with cognate peptides and labeled with Cytolight Rapid Dye (Fig. 4e). TCRs H2 and H5 exhibited the most consistent functional activation across all assays, and so were advanced for additional pre-clinical evaluations.
We next assessed TCRs H2 and H5 for target selectivity. We performed alanine scanning of their 9-mer core epitopes, identifying the key recognition motifs of xxxxYNKPx (H2) and FHNxRGRWx (H5) (Supplementary Fig. 4i). BLAST-based homology searches identified human self-antigens with similar motifs (Supplementary Data 16). Co-culture assays using HLA-matched, EBV-transformed B-lymphoblastic cell lines (LCLs) pulsed with these peptides showed no evidence of cross-reactivity, indicating strong target specificity (Fig. 4f).
We then screened for alloreactivity to common class II HLAs using a panel of 41 LCLs expressing 92 distinct class II HLA alleles. H5 exhibited reactivity toward two LCL lines sharing the HLA-DRB1*13:05 allele, whereas H2 demonstrated no evidence of alloreactivity (Fig. 4g and Supplementary Data 17). Finally, titration of the full-length E6 protein pulsed to a DRB1+ LCL line showed functional activation of H2-transduced T cells, confirming that the L-1 antigen is naturally processed and presented by DRB1+ 01:01 (Fig. 4h). Collectively, the H2 TCR emerges with strong therapeutic potential for clinical translation.
These results demonstrate the power of class II SCT libraries for large-scale screening of functional CD4 TCR repertoires in cancer, and also highlight the need for a multi-step analytic pipeline for CD4 TCR evaluation. This approach enables precise mapping of peptide families, functional interrogation of PFRs, and identification of therapeutically relevant CD4 TCRs with minimal off-target risk—laying the groundwork for translational CD4 TCR-T immunotherapies.