
Cells
African green monkey kidney Vero E6 cells and human embryonic kidney HEK293T cells were cultured in Dulbecco’s modified Eagle’s medium (DMEM; Corning) supplemented with 10% fetal bovine serum (FBS; Gibco), 100 U/mL penicillin, and 0.1 mg/mL streptomycin (Gibco). Mouse P3U1 myeloma cells were maintained in Roswell Park Memorial Institute (RPMI) 1640 medium (Gibco) supplemented with 10% FBS, 4 mM L-glutamine (Gibco), 100 U/mL penicillin, and 0.1 mg/mL streptomycin. These cell lines were cultured at 37 °C in a humidified atmosphere with 5% CO2. Expi293F cells were maintained in Expi293F Expression Medium (Thermo Fisher Scientific) at 37 °C with 8% CO2, according to the manufacturer’s instructions.
Viruses
Replication-incompetent pseudotyped VSIV encoding the green fluorescent protein (GFP) gene in place of the VSV-G gene and bearing GPs from MARV variants Angola and Musoke, RAVV, or EBOV variant Mayinga (designated VSVΔG*MARV-Angola, VSVΔG*MARV-Musoke, VSVΔG*RAVV, and VSVΔG*EBOV, respectively) were generated as previously described7,16,17. Briefly, HEK293T cells were transfected with pCAGGS expression plasmids encoding the GP genes. After 24 h, the cells were infected with VSVΔG*-VSV-G at a multiplicity of infection of 1.0. Supernatants were collected after 16 h of incubation and centrifuged to remove cell debris. Infectious units (IU) of the pseudotyped viruses were determined as previously described7,16,17. Briefly, serial 10-fold dilutions of pseudotyped viruses were inoculated onto confluent Vero E6 cell monolayers in 96-well plates. After 24 h, GFP-positive cells were counted using an In Cell Analyzer 2500 system (GE Healthcare). To minimize background infectivity from residual parental VSVΔG*-VSV-G, all pseudotyped virus stocks were treated with a neutralizing mAb specific to the G protein (VSV-G[N]1-9)41.
Replication-competent rVSV/MARV-Angola was generated as previously described13,14. The virus was propagated in Vero E6 cells and stored at −80 °C until further use. Virus titers were determined using a plaque assay14. Briefly, 10-fold serial dilutions of virus stocks were inoculated onto confluent Vero E6 cells in 12-well plates and incubated for 1 h at 37 °C with 5% CO2. Following removal of the inoculum, cells were washed with DMEM and overlaid with Eagle’s minimum essential medium (EMEM) supplemented with 0.8% Bacto Agar (Becton Dickinson), 0.3% bovine serum albumin, 100 U/mL penicillin, and 0.1 mg/mL streptomycin. After 48 h of incubation, cells were fixed with 10% formalin and stained with crystal violet. Viral titers were expressed as plaque-forming units (PFU/mL).
Infectious MARV Angola variant (Angola 200501379)42 and RAVV (Kenya 1987)43 were initially obtained from the Special Pathogens Branch, U.S. Centers for Disease Control (CDC), and maintained at the World Reference Center for Emerging Viruses and Arboviruses at the University of Texas Medical Branch (UTMB). Both viruses were propagated in Vero E6 cells and stored at −80 °C until use. All experiments involving infectious MARV and RAVV were conducted in Biosafety Level 4 (BSL-4) facilities at the Galveston National Laboratory (GNL), UTMB, following institutional guidelines. Virus titers were determined by plaque assay as previously described, with slight modifications10. Confluent Vero E6 cells in 12-well plates were inoculated with 10-fold serial dilutions of virus stocks and incubated for 30 min at 37 °C with 5% CO2. Following removal of the inoculum, cells were washed with DMEM and overlaid with EMEM supplemented with 5% FBS, 1% penicillin–streptomycin, and 0.6% tragacanth (Sigma). After 9 days of incubation, cells were fixed with 10% formalin and stained with 0.25% crystal violet. Viral titers were expressed as PFU.
Expression and purification of His-tagged MARV, RAVV, and EBOV GPs
Expi293F cells were transfected with expression plasmids (pCAGGS) encoding histidine-tagged soluble forms of the GPs from MARV (Angola), RAVV, and EBOV15, using the Expi293 Expression System (Thermo Fisher Scientific) according to the manufacturer’s instructions. After 96 h post-transfection, the culture supernatant was harvested and centrifuged at 3000 rpm for 15 min at 4 °C to remove cellular debris. Recombinant His-MARV, -RAVV, and -EBOV GPs were purified from the supernatant using the Ni-nitrilotriacetic acid affinity purification system (Invitrogen) following the manufacturer’s instructions. The purified His-MARV GP was used for booster immunization in mice and as a coating antigen in ELISA. Purified His-RAVV and His-EBOV GPs were also used as antigens in ELISA.
Generation of anti-MARV neutralizing antibodies
All animal experiments for hybridoma generation were conducted strictly in accordance with the Guidelines for Proper Conduct of Animal Experiments of the Science Council of Japan. The study protocol was approved by the Hokkaido University Animal Care and Use Committee (Approval No. 18-0026). Six-week-old female BALB/c mice were obtained from Sankyo Lab Service and housed in animal biosafety level 2 (BSL-2) facilities at the International Institute for Zoonosis Control, Hokkaido University. Animals were maintained for a minimum of one week to allow acclimation. Isoflurane was used as the anesthetic. Mice were intraperitoneally (i.p.) inoculated with 106 PFU of rVSV/MARV-Angola. At 4 weeks post-immunization, they received an intravenous booster injection of 100 µg of purified His-MARV GP. Three days after the booster, mice were euthanized, and splenocytes were harvested and fused with P3U1 myeloma cells using a standard hybridoma generation protocol7,44. The resulting hybridomas were maintained and screened for secretion of neutralizing mAbs using VSVΔG*MARV-Angola. The hybridoma clones producing neutralizing mAbs were then subjected to two rounds of cloning by limiting cell dilution to ensure monoclonality. The resulting neutralizing mAbs were purified from mouse ascites. The isotypes and subclasses of the mAbs were determined using a Mouse Isotyping Kit (Biorad). Previously characterized mouse mAbs MR78 and MR191 were obtained from Absolute Antibody (Drydock Avenue, Boston, MA, USA) and ProteoGenix (Schiltigheim, France), respectively, and were used in neutralization assays and ELISA-based binding studies.
5’RACE for determining variable regions of mAbs
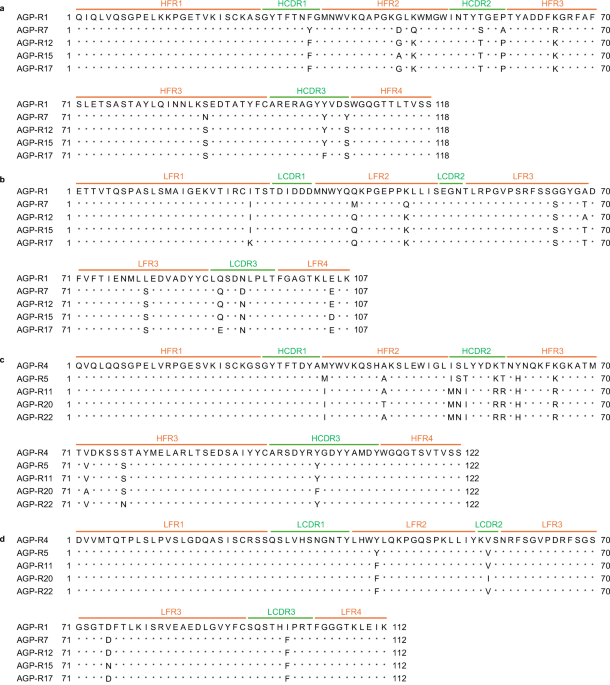
Total RNA was extracted from hybridoma cells producing mAbs using TRIzol™ Reagent (Thermo Fisher Scientific) and reverse-transcribed with the SMARTer RACE 5’/3’ Kit (Clontech) using reverse transcription primers45. Subsequently, the variable gene segments encoding the heavy chain (VH) and light chain (VL) were amplified by polymerase chain reaction (PCR) using VH– and VL-specific primer sets45 and the Universal Primer A Mix (Clontech), in combination with KOD One DNA polymerase (TOYOBO), following the manufacturer’s instructions. The resulting PCR products for the VH and VL genes were cloned into linearized pRACE vectors (Clontech) using the In-Fusion HD Cloning Kit (Clontech) and sequenced. Nucleotide sequences were determined using Sanger sequencing (GENEWIZ, South Plainfield, NJ, USA). The framework regions (FRs) and complementarity-determining regions (CDRs) were determined by the IMGT information system (https://www.imgt.org/IMGT_vquest/input)46,47.
Neutralization tests
VSVΔG*MARV-Angola, VSVΔG*MARV-Musoke, VSVΔG*RAVV, and VSVΔG*EBOV were appropriately diluted to yield 500–3000 IU/well and incubated with serial dilutions of mAbs for 1 h at room temperature. The mixtures were then inoculated into confluent Vero E6 cells, which were seeded in 96-well plates. At 20 h post-inoculation, GFP-positive cells were counted. Relative percentage of infectivity was calculated by setting the number of infected cells in the absence of mAbs as 100%. Neutralizing activity against authentic MARV (Angola variant) and RAVV was determined using a plaque reduction neutralizing test (PRNT). Viruses were diluted in DMEM supplemented with 2% FBS to obtain 100–150 PFU/well and incubated with serially diluted mAbs for 30 min at 37 °C. The virus–antibody mixtures were then inoculated onto monolayers of Vero E6 cells in six-well plates and incubated for an additional 30 min at 37 °C in a CO2 incubator. The inoculum was then removed, and cells were overlaid with EMEM supplemented with 5% FBS, 1% penicillin–streptomycin, and 0.6% tragacanth. After 7 days of incubation, cells were fixed with 10% formalin, and plaques were visualized by staining with crystal violet. The relative percentage of infectivity was calculated by setting the number of plaques in the absence of mAbs as 100%.
Enzyme-linked immunosorbent assay
A filovirus GP-based ELISA was conducted as previously described7,15. Briefly, ELISA plates (Thermo Fisher Scientific) were coated with purified His-tagged MARV, RAVV, or EBOV GPs (50 ng/50 µL/well) diluted in phosphate-buffered saline (PBS) and incubated overnight at 4 °C. The plates were then washed with PBS supplemented with 0.05% Tween 20 (PBST) and blocked with 3% skim milk (180 μL/well) for 1 h at room temperature. After washing with PBST, serial dilutions of purified mAbs prepared in PBST supplemented with 1% skim milk were added and incubated overnight at 4 °C. After three washes with PBST, bound antibodies were visualized using horseradish peroxidase (HRP)-conjugated goat antimouse IgG (H + L) (Invitrogen) and 3,3’,5,5’-tetramethylbenzidine (TMB) solution (Sigma). The enzymatic reaction was stopped by adding 1 N phosphoric acid, and the optical density was measured at 450 nm using a Biotek ELx808 microplate reader (Agilent).
Competitive ELISA
Each mAb was purified and labeled with HRP using the Peroxidase Labeling Kit-SH (Dojindo Molecular Technologies, Inc.) according to the manufacturer’s instructions. Briefly, 100 µg of each purified antibody (1.0 mg/mL) was subjected to the labeling reaction, followed by washing with the provided spin column, and the antibodies were recovered in 200 µL of the provided Storage Buffer. ELISA plates were coated with purified His-tagged MARV GP (200 ng/50 µL/well) in PBS for 2 h at room temperature and subsequently blocked with 3% skim milk for 1.5 h at room temperature. After washing with PBST, serially diluted unlabeled competing mAbs in PBST supplemented with 1% skim milk were added and incubated for 1 h at room temperature. Following additional washes with PBST, HRP-conjugated mAbs, for which the optimal dilutions had been determined prior to use, were added and incubated at room temperature for 1 h. Bound HRP-conjugated mAbs were visualized using TMB solution (Sigma). The reaction was stopped by adding 1 N phosphoric acid, and absorbance at 450 nm was measured using a SPECTRAMAX 190 microplate reader (Molecular Devices).
Selection of rVSV/MARV-Angola escape mutants and identification of putative epitopes
The selection of escape mutants and identification of putative epitopes on the MARV GP molecule were performed as previously described7. Briefly, 10-fold serial dilutions (104–106 PFU) of rVSV/MARV-Angola were incubated with 10 μg/mL of each mAb for 1 h at room temperature and then inoculated onto confluent Vero E6 cell monolayers grown in six-well plates. After 1 h of adsorption, the inoculum was removed, and cells were overlaid with EMEM supplemented with 0.8% Bacto Agar, 0.3% bovine serum albumin, 100 U/mL penicillin, 0.1 mg/mL streptomycin, and 10 μg/mL of the respective mAb. The cultures were then incubated at 37 °C for 2 days. Mutant viruses that grew in the presence of mAbs were isolated from individual plaques and propagated in Vero E6 cells. Viral RNAs were extracted from the supernatants and purified using the Viral RNA Mini Kit (QIAGEN), followed by PCR amplification. The GP gene sequences from the parent virus and the escape mutants were determined using the BigDye Terminator v3.1 Cycle Sequencing Kit and analyzed on an Applied Biosystems 3130xl Genetic Analyzer. Deduced amino acid sequences were aligned and compared among the viral isolates. The reference amino acid sequence of MARV-Angola was obtained from GenBank (accession no. KY047763.1). Identified amino acid substitutions were mapped onto a trimeric GP structure modeled using the Schrödinger Suite (version 2022-4; Schrödinger, LLC, New York, NY, USA), based on the crystal structure of RAVV GP11 (Protein Data Bank, PDB ID: 6BP2). We also propagated rVSV/MARV-Angola in the absence of mAbs and confirmed by Sanger sequencing that no consistent non-synonymous substitutions were found in the GP gene.
Imaging of attachment, internalization, and membrane fusion of DiI-labeled VLPs in live cells
The purification and fluorescent labeling of MARV-Angola VLPs were performed as previously described7. Vero E6 cells were cultured in 35 mm glass-bottom culture dishes (MatTek Corporation). MARV VLPs labeled with 1,1’-dioctadecyl-3,3,3’,3’-tetramethylindocarbocyanine perchlorate (DiI; Thermo Fisher Scientific) were incubated with 100 µg/mL of AGP-R1, -R7, -R12, -R4, -R11, -MR78, or a control IgG (S139/1) for 1 h at 37 °C. Cells were then washed with 1.0 mL of phenol red-free DMEM (Invitrogen) and incubated with either mAb-treated or untreated VLPs in the same medium at room temperature for 30 min. The cells were washed with the same medium to remove unbound VLPs and incubated with 2 ml of phenol red-free DMEM supplemented with 2% FCS and 4% bovine serum albumin at 37 °C for 0 and 5 h to assess viral attachment, internalization, and membrane fusion, respectively. In this assay, Dil fluorescence signal increases when the VLP envelope fuses with the endosomal membrane. To quantify Dil-labeled VLPs, cells were fixed with 4% paraformaldehyde for 10 min at room temperature. Nuclei were stained with 1 μg/mL of Hoechst 42232 (Cell Signaling Technology, Danvers, MA, USA) for 10 min at room temperature. Imaging was performed using a Fluoview FV3000 confocal laser scanning microscope (Evident Scientific, Tokyo, Japan) equipped with a ×60 oil immersion objective lens (×60 magnification) and controlled using FV31S-SW software (Evident Scientific). To quantify DiI-labeled VLPs, z-stack images comprising 4–20 optical sections were acquired at 0.5–1 μm intervals. DiI signals were quantified in ~100 individual cells (1–20 dots/cell), and the average number of fluorescent dots per cell was calculated under each condition. The number, size, and fluorescence intensity of the DiI-labeled VLPs were analyzed using the ImarisCell module (OXFORD Instruments, Oxfordshire, UK).
Therapeutic effects of mAb AGP-Rs in mouse models of MARV and RAVV infection
Five- to 7-week-old female BALB/c mice were obtained from Charles River and housed in ABSL-2 and ABSL-4 facilities at the GNL, UTMB. All animal procedures were reviewed and approved by the Institutional Animal Care and Use Committee of UTMB (IACUC2306037) and were conducted according to the National Institutes of Health guidelines. Animals were randomly allocated to control and treatment groups. Each mouse was considered an independent experimental unit. Sample sizes were determined according to those commonly used in published mouse models of filovirus infection. Animals were maintained for a minimum of one week to allow acclimation. Body weights were measured using an Ohaus CX1201 portable scale. Isoflurane was used as the anesthetic. Mice were i.p. inoculated with 50 PFU (~50 × 50% lethal dose [LD50]) of mouse-adapted MARV-Angola48 or 1 PFU (LD50 was not determined while significant mortality [two out of four mice succumbed, and the remaining two mice showed clinical signs, including ruffled fur and significant body weight loss] in mice infected with this dose was confirmed in our preliminary experiment) of mouse-adapted RAVV49 in a total volume of 100 µL of PBS. At 1 dpi, mice infected with mouse-adapted MARV Angola were administered 100 µg of mAbs AGP-R1, -R7, -R12, -R17, -R4, -R5, -R11, -R20, MR78, or a control mouse polyclonal IgG (BioXCell) through i.p. injection. Mice infected with mouse-adapted RAVV received 100 µg of mAbs AGP-R1, -R7, -R12, -R17, -R11, MR78, or a control mouse polyclonal IgG under the same conditions. Mice were monitored daily for 21 dpi and were humanely euthanized if they exhibited more than 20% body weight loss or were unable to access their food or water. Clinical scoring was performed using the following criteria: 0 = normal; 1 = one clinical sign of the disease; 2 = two or more clinical signs of the disease; 3 = a score of two plus one additional clinical sign and/or >15% weight loss; 4 = >20% weight loss, labored breathing, partial paralysis, paralysis, or bleeding. Animals that met euthanasia criteria or died naturally were both assigned a final score of 4. Inclusion and exclusion criteria were provided, and no animals or data points were excluded.
Molecular modeling
The crystal structure of RAVV GP in complex with neutralizing antibodies was downloaded from the PDB (PDB ID: 6BP2). The apo-GP structure was obtained by removing the antibody components from the complex. To model the variable fragment (Fv) region of AGP-R7, five structures were generated using AlphaFold2, as implemented via ColabFold v1.5.550. Molecular docking between the apo-RAVV GP and the AGP-R7 Fv structures was performed using the “antibody mode” in the ClusPro 2.0 server, which performs rigid-body docking based on a fast Fourier transform (FFT) correlation search51. Among the resulting models, a structure in which the AGP-R7 mAb was predicted to bind near the putative epitope on RAVV GP was selected for further analysis. Residue contacts were identified using the Protein Contacts module in Molecular Operating Environment software (version 2022; Chemical Computing Group, Montreal, QC, Canada). We also attempted direct complex predictions using AlphaFold2-Multimer and AlphaFold3. However, none of the predicted interfaces simultaneously accounted for all experimentally identified escape mutations. Accordingly, the ClusPro-derived pose, which best matched the experimental constraints, was selected for further analysis.
Phylogenetic analysis and multiple alignment of MARV and RAVV GP amino acid sequences
Amino acid sequences of MARV and RAVV GPs available in GenBank were analyzed. The MARV Equatorial Guinea 2023 sequence was retrieved from https://virological.org/t/first-emergence-of-marburg-virus-in-equatorial-guinea-2023/924. A phylogenetic tree was constructed using the maximum-likelihood method with the Jones–Taylor–Thornton matrix-based model implemented in MEGA11. The following GP amino acid sequences were included in the analysis: MARV-Angola (Angola 20051379, AMZ00481.1), Ghana/2022 (MV-22-114C/Ghana/2022, WKR37932.1), Equatorial Guinea 2023, Musoke (CAA78117.1), Ci67 (ABS17558.1), 07DRC99 (ABE27078.1), 01Uga07 (ACT79229.1), 05DRC99 (ABE27085.1), RAVV (ABE27071.1), Uganda 20070648 (AMZ00488.1), and 02Uga07 (ACT79201.1). Multiple sequence alignment was performed using the MUSCLE algorithm in MEGA11.
Statistical analysis
All data were analyzed using GraphPad Prism software (version 9.1.2). Logistic curves representing neutralizing activity were generated using nonlinear four-parameter regression analysis. The fitting curves of neutralization against MARV and RAVV are presented along with their corresponding R2 values. The IC50 and 95% confidence intervals for neutralization were calculated based on these curves, defined as the antibody concentration required to achieve a 50% reduction in infectivity of pseudotyped virus or plaque counts of MARV or RAVV. For VLP attachment, internalization, and membrane fusion assays, one-way repeated-measures analysis of variance (ANOVA) was performed, followed by Dunnett’s multiple comparison test to evaluate differences between AGP-R mAbs and untreated cells. p-values < 0.05 were considered statistically significant.