
Cells and ethics
The cell lines were purchased from ATCC (Manassas, VA) and cultured in RPMI-1640 (Gibco) supplemented with 10% fetal bovine serum (Gibco) and 100 U/ml penicillin/streptomycin (Gibco). Cell line identity was confirmed via short tandem repeat profiling at the time of acquisition, and mycoplasma contamination was routinely tested via PCR-based assays. Peripheral blood mononuclear cells (PBMCs) were obtained from healthy donors, and written informed consent was obtained. All procedures were conducted in accordance with the Declaration of Helsinki and were approved by the Research Ethics Board of Chinese PLA General Hospital.
CAR T-cell generation
The generation of CAR constructs has been described in our previous reports.50,51 The CAR constructs used in this study are displayed in Supplementary Fig. 1. Unless specifically stated otherwise, CD19 CAR T cells in this study refer to CD19–4-1BBζ CAR T cells. The CAR construct was subsequently cloned and inserted into a pRRLSIN lentiviral vector under the control of the EF-1α promoter. Lentiviral particles were produced in 293 T cells via psPAX2/pMD2G packaging plasmids. T cells were activated with 1 mg/mL OKT3 in IL-2-supplemented X-VIVO 15 medium (Lonza) for 2 days and then transduced with viral supernatant in RetroNectin (Takara)-coated plates with 4 μg/mL polybrene (Sigma–Aldrich, USA) at 2000 × g for 2 h. Mock-transduced T cells served as controls. CAR T cells were labeled with biotinylated anti-mouse IgG F(ab)’2 (Jackson ImmunoResearch) and PE-streptavidin (BioLegend) and sorted with magnetic beads (Miltenyi) following the manufacturer’s instructions. Functional assays were conducted 8–10 days post-transduction. All CAR T cells used in this study were purified with CAR efficiency higher than 90% (Supplementary Fig. 1).
CRISPR/Cas9-mediated knockout of genes
CRISPR/Cas9-mediated gene editing was performed by electroporation of Cas9/gRNA ribonucleoprotein (RNP) complexes. Two different sgRNA (referred to as sgRNA-1 and sgRNA-2) were designed and tested for SHP1, PTPN7, DUSP6, respectively. For each target gene, the two corresponding sgRNAs were pooled and used simultaneously during RNP complex formation to improve knockout efficiency. The RNP complex was prepared by mixing 0.9 μL of 62 μM Cas9 protein (Integrated Device Technology) with each 0.3 μL of 100 μM sgRNA-1 and sgRNA-2 into Opti-MEM medium (Gibco) to create a final mixture of 20 μL. The mixture was incubated at room temperature for 20 min for RNP complex formation, then immediately transfer the mixture onto ice until electroporation. A total of 106 activated T cells were washed twice in 3 mL of Opti-MEM medium and the supernatant was carefully removed. The cell pellet was resuspended in 80 μL of Opti-MEM medium, then kept on ice for at least 5 min before electroporation. The cell suspension and RNA complex were immediately transferred into a pre-cooled (4 °C) 2 mm cuvette (Harvard Apparatus BTX), then electroporated with a BTX Gemini System (Harvard Apparatus BTX) at 250 V with a pulse length of 5 ms. Electroporated T cells were immediately and gently transferred into 2 mL of prewarmed medium and cultured at 37 °C. CAR transduction was performed 24 h after electroporation. Gene knockout efficiency was confirmed by western blot analysis. The gRNA sequences targeting SHP1, PTPN7, DUSP6 and negative control gRNA sequence (used to generate control-edited T cells) were listed in Supplementary Table 1.
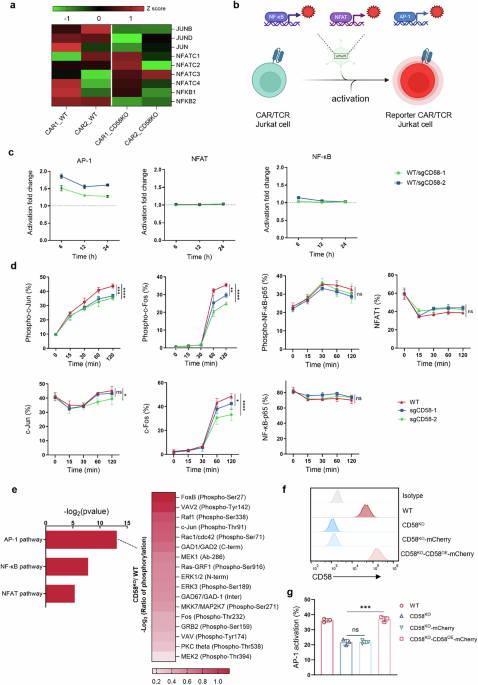
Generation of reporter cell lines for NF-κB, NFAT, or AP-1 signaling
The responsive promoter sequences of NFAT, NF-κB, and AP-1 were derived from Addgene plasmids #118031, #118094, and #118095 (deposited by Peter Steinberger; Addgene, Watertown, MA, USA), respectively. mCherry fragments were inserted into these sequences to generate NFAT-mCherry, NF-κB-mCherry, and AP-1-mCherry fluorescent reporter constructs. The PGK-GFP fragment was excised from the lentiviral backbone vector pRRLSIN.cPPT.PGK-GFP.WPRE using BstXI and SalI, and replaced with above reporter constructs to generate pRRLSIN.cPPT.NFAT-mCherry.WPRE, pRRLSIN.cPPT.NF-κB-mCherry.WPRE, and pRRLSIN.cPPT.AP-1-mCherry.WPRE, respectively. Lentiviruses were packaged in 293 T cells by co-transfecting the recombinant plasmids with psPAX2 and pMD2.G at a mass ratio of 6:2:1 using Lipofectamine3000 (Invitrogen), followed by collection and filtration of viral supernatants 48 h post-transfection. For cell transduction, 6-well plates were pre-coated with RetroNectin solution, and 1.5 mL of viral stock was added to each well, followed by centrifugation at 2000 g for 2 h at 32 °C. Without removing the viral supernatant, 2 × 10⁶ Jurkat cells or CD19 CAR-Jurkat cells resuspended in 1.5 mL RPMI 1640 complete medium containing 3 μL polybrene (8 μg/mL) were gently added to each well, centrifuged at 1000 rpm for 10 min at 32 °C, and then cultured in a 37 °C incubator with 5% CO₂, with fresh medium replaced after 20 h. Cell stimulation cocktail containing phorbol 12-myristate 13-acetate and ionomycin (Invitrogen) was used to confirm signaling responsiveness.
Jurkat reporter cell lines were transduced with the NY-ESO-1 specific TCR (clone 1G4) to establish the TCR reporter systems. Transduced cells were subsequently purified via flow cytometric sorting based on TCR expression. For target cell preparation, OVCAR3 tumor cells were pulsed with 1 µM SLLMWITQC peptide overnight at 37 °C prior to coculture. To compare TCR reporter cell activation by CD58-deficient versus WT tumor cells, peptide-pulsed OVCAR3 cells were incubated with an isotype control mAb or anti-CD58 blocking mAb (Biolegend) at 8 μg/mL for 1 h in the dark. After washing with PBS, flow cytometry using a detection antibody of the same clone confirmed complete and sustained blockade of membrane CD58 throughout the duration of subsequent coculture experiments.
Generation of CD58 Re-expression Cell Line
To generate the CD58 re-expression cell line, a lentiviral expression plasmid encoding human CD58 together with an mCherry fluorescent reporter was constructed for CD58 overexpression (OE). Lentiviruses were packaged by co-transfecting the recombinant CD58-OE-mCherry plasmid with psPAX2 and pMD2.G packaging plasmids into 293 T cells using Lipofectamine 3000 (Invitrogen) according to the manufacturer’s protocol. Viral supernatants were collected at 48 post-transfection and filtered through a 0.45 μm membrane. The transduction protocol applied to CD58KO Nalm6 cells was identical to that utilized for the establishment of reporter cell lines in the preceding section. At 72 h post-infection, mCherry-positive cells were enriched by flow cytometric sorting (BD Biosciences) with gating on mCherry fluorescence. The sorted population was expanded, and successful CD58 re-expression was verified by flow cytometry using an anti-CD58 antibody (BioLegend). This validated cell line was designated as Nalm6-CD58KO-CD58OE-mCherry.
Quantification of mtDNA
CAR T cells repeatedly stimulated by WT or CD58KO Nalm6 cells were sorted and had total DNA extracted by TIANamp Genomic DNA Kit (TIANGEN), according to the manufacturer’s protocol. The relative abundance of mtDNA was quantified by real-time PCR. Reactions were set up in triplicate using eight-tube strips. Each PCR reaction (final volume 20 μL) contained 200 ng DNA, 10 μL of Taq Pro Universal SYBR qPCR Master Mix (Vazyme) and 0.8 μM of each forward and reverse primer. mtDNA was quantified using two primer sets specific for MT-ND1 and MT-CO2 gene, and primers sets for reference gene ACTB were used for normalization. Primers were as follows: MT-ND1-F (CCCTAAAACCCGCCACATCT), MT-ND1-R (GAGCGATGGTGAGAGCTAAGGT), MT-CO2-F (CGTCTGAACTATCC TGCCCG), MT-CO2-R (TGGTAAGGGAGGGATCGTTG), ACTB-F (TTGCCGACAGGATGCAG), and ACTB-R (AGGTGGACAGCGAGGCC).
Flow cytometry analysis
To evaluate apoptosis in CAR T cells, Annexin V/7-AAD staining was conducted per the manufacturer’s protocol (BD Biosciences apoptosis detection kit).
To evaluate CAR T cell degranulation, CAR T cells were co-cultured with tumor cells (E:T = 1:1) in 1640 medium containing anti-human CD107a-APC (BioLegend) for 1 h, followed by 3 h incubation with BD GolgiPlug protein transport inhibitor (BD Biosciences).
To measure the proliferation of CAR T cells, an amount of 10⁵ CAR T cells were seeded into 12-well plates. Fresh 1640 medium was replenished every 48 h, followed by trypan blue staining at indicated time points to quantify viable cells.
To evaluate tumor cell lysis, 5 × 10⁴ tumor and CAR T cells were co-cultured in 96-well plates (200 μl/well) at diverse E:T ratios. Post-incubation, 10 μL of 2 × D-luciferin (300 μg/ml) was injected, and luminescence signals (Varioskan™ LUX) were recorded after 2–5 min. Lysis rate = 1-([sample]–[negative])/([positive]–[negative]).
ROS level was measured using the CellROX® Deep Red Flow Cytometry Assay Kit (Invitrogen) following the manufacturer’s instructions. CAR T cells were collected and resuspended at a density of 5 × 10⁵ cells/mL in complete medium, with TBHP and NAC from the kit used for positive and negative controls, respectively. CellROX® Deep Red reagent was applied at a final concentration of 500 nM and incubated for 30 min at 37 °C in dark. SYTOX® Blue Dead Cell Stain was introduced during the last 15 min of staining at a concentration of 1 μM, followed by immediate flow cytometry analysis.
The protocol recommended by the manufacturer guided all experimental procedures. Multicolor flow cytometry analysis of all samples was performed on a DxFLEX flow cytometer (Beckman Coulter), and subsequent data analysis was conducted using FlowJo software v 10.0 (FlowJo LLC). Antibodies used were described in Supplementary Table 2.
Mitochondrial quantification and membrane potential analysis
Mitochondrial quantification was performed via MitoTracker® Deep Red FM (Invitrogen) according to the manufacturer’s instructions. CAR T cells were resuspended in prewarmed PBS supplemented with 25 nM MitoTracker® Deep Red FM, incubated for 15 min at 37 °C in the dark, rinsed twice with prewarmed PBS and immediately analyzed via flow cytometry.
The mitochondrial membrane potential in CAR T cells was analyzed via an Enhanced Mitochondrial Membrane Potential Assay Kit with JC-1 (Beyotime) following the manufacturer’s instructions. The cells were incubated with JC-1 working solution (37 °C, 20 min), washed with ice-cold assay buffer, immediately resuspended and analyzed by flow cytometry. ΔΨm loss was quantified by a green/red fluorescence shift.
Phosphorylation analysis
CD19 CAR T cells were stimulated with WT or CD58KO Nalm6 tumor cells at a 1:1 E:T ratio for different co-culture time, then collected for phosphorylation analysis of c-Jun, c-Fos, NFAT and NF-κB p65. For the phosphorylation analysis, cells were immediately fixed with 4% formaldehyde for 15 min in room temperature, followed by permeabilization with ice-cold 100% methanol for 10 min on ice to enable intracellular epitope accessibility. After fixation and permeabilization, cells were washed and incubated with primary antibodies specific to the phosphorylated targets, diluted in an antibody buffer containing 0.5% BSA in PBS. Following a 1 h incubation at room temperature, cells were washed and stained with fluorochrome-conjugated anti-rabbit secondary antibodies for 30 min, protected from light. Following a final wash, and cells were resuspended in PBS for flow cytometry analysis.
Western blot analysis
CD19 CAR T cells were treated with WT or CD58KO Nalm6 cells under specified conditions in this study, then harvested by FACS. Cell lysates were prepared by lysing harvested cells in RIPA buffer (YangGuangBio) supplemented with protease and phosphatase inhibitors (cOmplete Mini and PhosSTOP, Roche). For detection of Bax translocation to mitochondria, a mito/cytosol fractionation experiment was performed using a mitochondria separation kit (Proteintech), and the lysates were prepared according to instructions. Concentrations of extracted proteins were determined using BCA Protein Assay (YangGuangBio). Prepared proteins were loaded and separated by 10% or 15% precast Bis-Tris gels (Genscript) and transferred onto 0.45 µm PVDF membranes (Millipore). Membranes were gently blocked with 5% non-fat milk in TBS-T buffer (YangGuangBio) for 1 h at room temperature and incubated with primary antibodies overnight at 4 °C. After washing, membranes were incubated with HRP-conjugated secondary antibodies for 1 h at room temperature. Protein bands were visualized using enhanced chemiluminescence (ECL) reagents (YangGuangBio) and imaged with a chemiluminescence detection system. For the western blot evaluation of the impact of inhibitory phosphatase blockade on the activation of AP-1 signaling, CD19 CAR T cells were cultured in anti-CD3 monoclonal antibody (OKT3, 50 ng/mL, Takara) precoated plates with RetroNectin (10 μg/mL, Takara), in X-VIVO 15 medium (Lonza) supplemented with 300 U/mL recombinant human IL-2 (PeproTech) and different concentration of TPI-1, MurA-IN-1 and BCI hydrochloride (MCE) for 6 h, then harvested and processed as described in above procedures. Antibodies used in all western blot assays were described in Supplementary Table 2. Original Western blot data are presented in Supplementary Fig. 16–18.
Seahorse assays
Mitochondrial respiration and glycolytic function were analyzed using the Seahorse XFe96 Extracellular Flux Analyzer (Agilent Technologies). Calibrated sensor cartridge from XFe96 FluxPak (Agilent Technologies) was hydrated overnight in XF Calibrant Solution (Agilent Technologies). To enhance cell adherence, XFe96 Cell Culture Microplates were precoated with Poly-ʟ-Lysine Hydrobromide (Sigma-Aldrich). CD19 CAR T cells that had undergone three rounds of stimulation with WT or CD58KO Nalm6 cells were sorted and resuspended in assay medium and seeded into precoated microplates at 10⁵ cells/well. For mitochondrial stress testing, cells were equilibrated in XF assay medium (pH 7.4) supplemented with 10 mM glucose, 1 mM pyruvate, and 2 mM glutamine (Sigma-Aldrich) for 1 h prior to analysis. Sequential injections delivered final concentrations of: 1.5 μM oligomycin, 1.0 μM FCCP, and 0.5 μM rotenone/antimycin A. For glycolysis stress testing, cells were equilibrated in XF assay medium (pH 7.4) supplemented with 2 mM glutamine (Sigma-Aldrich) for 1 h prior to analysis. Glycolysis stress testing was performed using the Glycolysis Stress Test Kit with sequential injection of 10 mM glucose, 1.0 μM oligomycin, and 50 mM 2-DG (2-deoxy-D-glucose). Extracellular acidification rate (ECAR) values were recorded under basal conditions and following pharmacological perturbations. Measurements were conducted using a cycle of 3 min mixing, 3 min waiting, and 3 min measurement intervals. All parameters were normalized to the cell number per well by Seahorse Wave Desktop Software (v2.6.3, Agilent Technologies).
Cytochrome c release detection by immunofluorescence
Cytochrome c release was detected by immunofluorescence. CD19 CAR T cells were stimulated by three rounds of WT or CD58KO tumor cells. After the third round of stimulation, CAR T cells were sorted from the coculture system. Unstimulated CAR T cells served as the control. For staining, coverslips were pre-coated overnight at 4 °C with 0.025% poly-L-lysine. Sorted cells were allowed to adhere onto the coverslips, then fixed with 4% paraformaldehyde for 10 min at room temperature (RT), permeabilized with 0.1% Triton X-100 for 15 min (RT), and blocked with 5% BSA for 30 min (RT). Cells were incubated overnight at 4 °C with primary antibodies against cytochrome c and TOMM20 (both 1:500, Proteintech). After washing, samples were incubated for 1 h at RT in the dark with fluorophore-conjugated secondary antibodies: CoraLite®488-conjugated goat anti-rabbit IgG and CoraLite®594-conjugated goat anti-mouse IgG (both 1:500, Proteintech). Images were acquired using a confocal laser scanning microscope (Leica).
Mice
A total of 1 × 10⁵ luciferase-expressing WT or CD58KO Nalm6 cells were transplanted intravenously into female NOD-Prkdc-scid-Il2rg-deficient mice (NPG/Vst strain, Vitalstar) aged 4–6 weeks. Animals received purified CAR T cells or control T cells intravenously 7 days after tumor engraftment at the indicated amount. The tumor burden was monitored once per week through bioluminescence imaging using an in vivo imaging system (Perkin Elmer). For immunophenotyping, peripheral blood samples were collected by retro-orbital bleeding. Erythrocytes were lysed with ammonium-chloride-potassium buffer (Thermo Fisher Scientific), and leukocytes were stained with fluorochrome-conjugated antibodies for flow cytometric analysis. The experimental protocols received ethical approval from the Laboratory Animal Ethics Committee of Vitalstar Biotechnology (Beijing, China).
Phospho-antibody array
Phosphoprotein profiling was conducted using the cancer-signaling phospho-antibody microarray PCS248 (Full Moon Biosystems, Inc., Sunnyvale, CA). CD19 CAR T cells were treated with WT or CD58KO Nalm6 cells at a 1:1 E:T ratio for 1 h, sorted by flow cytometry, and lysed under non-denaturing conditions. Protein lysates were biotinylated and purified according to the manufacturer’s protocol. Microarray slides were blocked for 30 min, rinsed thoroughly, and dried. Biotinylated protein samples were incubated with the slides for 2 h at RT. After washing, bound proteins were detected with Cy3-conjugated streptavidin and visualized using a GenePix 4000 scanner (Molecular Devices). Fluorescence signals were quantified using GenePix Pro 6.0, with phosphorylation ratios calculated as phospho-value/non-phospho-value and normalized to β-actin for total proteome standardization.
RNA sequencing and analysis
Ctrl CAR T cells or DUSP6KO CAR T cells co-cultured with WT or CD58KO cells at an E:T ratio of 1:1 for 3 days were sorted by magnetic beads (Miltenyi Biotec). Total RNA was extracted from samples using Trizol reagent (Thermo Fisher) following the manufacturer’s protocol. RNA quality was assessed using a Bioanalyzer 2100 with the RNA 6000 Nano LabChip Kit (Agilent), and only high-quality RNA samples (RIN > 7.0) were selected for library construction. mRNA was isolated from 5 µg of total RNA using oligo(dT) magnetic beads with two rounds of poly(A) selection to ensure high purity. The purified mRNA was fragmented using divalent cations (Magnesium RNA Fragmentation Module, NEB) at 94 °C for 5–7 min. First-strand cDNA synthesis was performed with SuperScript™ II Reverse Transcriptase (Invitrogen), followed by second-strand synthesis using E. coli DNA polymerase I (NEB), RNase H (NEB), and dUTP Solution (Thermo Fisher) to generate U-labeled double-stranded cDNA. After A-tailing and adapter ligation (dual-indexed adapters), size selection was performed with AMPureXP beads. UDG enzyme (NEB) treatment removed U-labeled strands, and PCR amplification (8 cycles) generated the final cDNA libraries with an average insert size of 300 ± 50 bp. Paired-end sequencing (2 × 150 bp) was conducted on an Illumina Novaseq™ 6000 platform (LC-Bio Technology). For bioinformatics analysis, raw sequencing reads were processed to remove adapters, polyA/G sequences, low-quality bases (Q < 20), and reads with >5% unknown nucleotides using Cutadapt. Quality-filtered “clean reads” were assessed using FastQC to evaluate Q20, Q30, and GC content. Clean reads were aligned to the reference genome using HISAT2 (v2.2.1), allowing up to two mismatches and multiple alignments. Transcript assembly and quantification were performed with StringTie (v2.1.6), followed by merging transcriptomes across samples using gffcompare. Gene expression levels were calculated as FPKM values. Differential gene expression analysis was performed using both DESeq2 and edgeR to ensure robustness. Genes with an adjusted P value (FDR) < 0.05 and an absolute fold change ≥ 2 were considered significantly differentially expressed. Sample relationships were evaluated via PCA analysis in R. Functional enrichment of differentially expressed genes was analyzed using GO and KEGG pathway databases, with hypergeometric tests (P < 0.05). GSEA (v4.1.0) was applied to identify enriched pathways (|NES | > 1, FDR < 0.25). Alternative splicing events were detected using rMATS (v4.1.1) with FDR < 0.05. Single-nucleotide polymorphisms were called using Samtools (v0.1.19) and annotated with ANNOVAR. Raw sequencing data were deposited in the NCBI Gene Expression Omnibus under accession number GSE292279.
Statistical analysis
Statistical analyses were conducted via GraphPad Prism 10.4.0 (GraphPad Software Inc., La Jolla, CA, USA). Comparisons between groups were performed via two-tailed Student’s t tests or two-way ANOVA. Survival data were analyzed via the log-rank test. P < 0.05 was considered significant. The group data are presented as means ± SDs unless otherwise noted.