
Elevated CD8 + T cell infiltration correlates with enhanced immune reactivity
The graphic abstract of this study is shown in Fig. 1. We analyzed surgically resected tumor specimens from 12 NSCLC patients in the GSE207422 cohort who received neoadjuvant anti-PD-1 immunotherapy combined with chemotherapy prior to resection. Pathological assessment stratified these post-treatment samples into two groups: major pathological responders (MPR, n = 4) and non-responders (NMPR, n = 8). Following quality control and dimensionality reduction, we identified 11 distinct cell clusters based on canonical marker genes (Fig. 2A): CD4 + T cells (CD3D, CD3E, CD4), CD8 + T cells (CD3D, CD3E, CD8), NK cells (FGFBP2), Myeloid cells (LYZ, CD68), Epithelial cells (EPCAM), B cells (CD79A, MS4A1), Endothelial cells (PECAM1, VWF), Fibroblasts (COL1A1, FGF7), Neutrophils (FCGR3B), Mast cells (TPSAB1, TPSB2), and Plasma cells (MZB1, IGHG1). The expression patterns of key markers for each cell type are further illustrated in Fig. 2B. Comparative analysis of the tumor immune microenvironment (TME) between MPR and NMPR groups revealed significant differences in the proportions of all 11 identified cell types (Fig. 2C). To identify cell populations potentially driving therapeutic response, we focused on cell subsets enriched in MPR patients. Notably, the proportions of CD4 + T cells, CD8 + T cells, and NK cells—three key lymphocyte populations mediating anti-tumor immunity—were significantly elevated in the MPR group compared to the NMPR group, with CD8 + T cells exhibiting the most pronounced difference (Fig. 2C). To further validate this observation, we applied the CIBERSORTx deconvolution algorithm to project celltype information from the GSE207422 scRNA-seq dataset onto the bulk RNA-seq dataset IMvigor210 (an immunotherapy-treated cohort with the largest sample size). This analysis confirmed significantly elevated CD8 + T cell abundance in complete/partial responders (CR/PR) versus patients with stable/progressive disease (SD/PD), and the ROC analysis demonstrated that CD8 + T cell proportions exhibited robust predictive value for immunotherapy response (AUC = 0.695, Fig. 2D). Critically, enhanced CD8 + T cell infiltration correlated with significantly improved overall survival (Fig. 2E). However, neither CD4 + T cells (Fig. S1A) nor NK cells (Fig. S1B) showed significant differential abundance between response groups, nor did they demonstrate robust predictive value for treatment response.

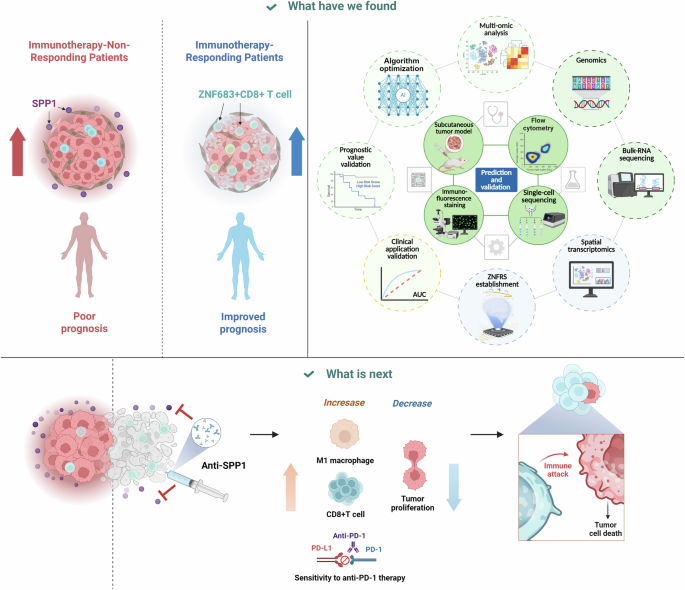
All illustrations in this graphical abstract were created using PowerPoint (Microsoft Corporation). This study integrates multi-omics analyses to reveal key determinants of immunotherapy response in non-small cell lung cancer. Single-cell transcriptomic profiling identifies ZNF683 + CD8 + T cells as a critical subset enriched in responders, while non-responders exhibit elevated SPP1 signaling. A ZNF683 + CD8 + T cell-related risk score (ZNFRS) is developed to stratify patient prognosis and tumor immune status, with high ZNFRS associating with “cold” tumors characterized by reduced immune infiltration and heightened SPP1 signaling. In vivo experiments demonstrate that SPP1 blockade suppresses tumor growth, restores CD8 + T cell effector function, inhibited M2-like macrophage polarization, and synergizes with anti-PD-1 therapy.

A Uniform Manifold Approximation and Projection (UMAP) visualization of 11 cell clusters identified by canonical markers in surgically resected NSCLC tumors from the GSE207422 cohort (n = 12 patients; MPR = 4, NMPR = 8) following neoadjuvant anti-PD-1/chemotherapy. Clockwise from the top left, the four corner insets display the UMAP plots of marker gene expression, age distribution, pathological response, and grouping by patients. B Expression of key marker genes defining each cell type. C Comparative proportions of all 11 cell types between MPR and NMPR groups. D Validation using CIBERSORTx deconvolution of IMvigor210 bulk RNA-seq data. E Patients with higher CD8 + T cell infiltration confers better prognosis in the IMvigor210 cohort.
Next, we investigated intrinsic factors underlying tumor microenvironment (TME) differences between MPR and NMPR samples. Using the CellChat package for comparative cell-cell communication analysis, we identified SPP1 signaling pathway activation exclusively in the NMPR group (Fig. S1C). This pathway originates from Myeloid and Epithelial cells and targets multiple recipient populations: CD8 + T cells, CD4 + T cells, NK cells, Fibroblasts, Endothelial cells, and Mast cells. Subsequent focused analysis of communications between Myeloid/Epithelial cells and cytotoxic lymphocytes (CD8 + T, CD4 + T, NK cells) revealed multiple ligand-receptor interactions between these populations. Crucially, only the SPP1 signaling axis—mediated through SPP1-CD44 and SPP1-(ITGA4 + ITGB1) receptor complexes—was uniquely present in NMPR samples (Fig. S1D). Notably, both Myeloid and Epithelial cell populations were significantly enriched in NMPR versus MPR tumors (Fig. 2C). We therefore hypothesize that Myeloid/Epithelial-derived SPP1 signaling to CD8 + T, CD4 + T, and NK cells may underlie the reduced infiltration of these anti-tumor lymphocytes in NMPR patients.
ZNF683 + CD8 + T cells significantly associates with immunotherapy response
Given the critical significance of CD8 + T cells in immunotherapy, we selected them for in-depth analysis. We further classified CD8 + T cells into six subsets: naïve CD8 + T cells (CD8Tnaive) with high expression of CCR7 and IL7R; exhausted CD8 + T cells (CD8Tex) expressing elevated exhaustion markers such as HAVCR2 and TIGIT; proliferating CD8 + T cells (CD8Tproli) showing high expression of proliferation markers such as STMN1, MKI67, and TOP2A; along with CD8T_GZMK, CD8T_ZNF683, and CD8T_FOS subsets characterized by prominent expression of GZMK, ZNF683, and FOS, respectively (Fig. 3A). Markers defining each subset were visualized through a dot plot (Fig. 3B) and violin plot (Fig. 3C). Subsequently, we compared the proportions of these six CD8 + T cell subsets between the MPR and NMPR groups. The results demonstrated a significant increase in the CD8T_ZNF683 subset in the MPR group (Fig. 3D). Next, we performed trajectory analysis on these six CD8 + T cell subsets. The results revealed a differentiation bias from the MPR state toward the NMPR state. The distribution of six CD8 + T cell subsets along the trajectory demonstrated that CD8Tnaive cells served as the starting point, diverging into two distinct terminal states: exhausted CD8Tex and proliferating CD8Tproli cells (Fig. 3E). We identified a critical observation: CD8T_ZNF683 cells reside proximal to the trajectory branching node and highly coincided with the divergence point from MPR to NMPR states. This relationship suggests that CD8T_ZNF683 cells may play a pivotal role in regulating immunotherapy responsiveness. Collectively, these analyses highlight the functional significance of CD8T_ZNF683+ cells in modulating immune therapy response, prompting us to investigate the role of ZNF683.

A UMAP of six CD8 + T cell subsets. B Dot plot and C violin plot of subset-defining markers. D Increased CD8T_ZNF683 proportion in MPR vs. NMPR. E Trajectory analysis: CD8Tnaive bifurcates into CD8Tex/CD8Tproli; CD8T_ZNF683 localizes near the MPR → NMPR divergence node. F ZNF683 expression enrichment in CD8 + T cells across NSCLC scRNA-seq datasets. G Spatial co-localization of ZNF683 with CD8A/CD8B in NSCLC. H Positive correlation between ZNF683 and CD8 + T cell markers (CD3D/CD3E/CD8A/CD8B) in TCGA-LUAD.
We first assessed ZNF683 expression across cell types in the GSE207422 dataset, demonstrating predominant expression in CD8 + T cells. To further explore this result, we analyzed three additional NSCLC single-cell RNA-seq datasets—GSE146100, GSE189357, and GSE150938—all of which confirmed significant enrichment of ZNF683 expression within CD8 + T cell populations (Fig. 3F). In addition, spatial transcriptomic profiling of the GSE189487 NSCLC dataset revealed significant co-localization of ZNF683 with canonical CD8 + T cell markers CD8A and CD8B (Fig. 3G). To mitigate analytical bias arising from the NSCLC-specific microenvironment, we further analyzed ZNF683 expression across ten additional cancer types using single-cell RNA-seq datasets from the TISCH database (http://tisch.compbio.cn/gallery/). This pan-cancer analysis revealed predominantly and significantly enriched ZNF683 expression within CD8 + T cell populations in the vast majority of malignancies examined (Fig. S2). Furthermore, we analyzed correlations between ZNF683 and CD8 + T cell marker genes (CD3D, CD3E, CD8A, CD8B) in the TCGA-LUAD bulk RNA-seq cohort. The results demonstrated significant positive correlations between ZNF683 and all these markers (Fig. 3H). We further analyzed the relationship between ZNF683 and various immune cell types as well as immune-related signatures in the TCGA-LUAD bulk RNA-seq cohort. Results showed that patients in the high-ZNF683 group exhibited elevated levels of immune cell infiltration (Fig. S3A) and higher expression of immune-related molecules (Fig. S3B). Correlation analysis revealed significant positive associations between ZNF683 and the majority of immune cells (Fig. S4A) as well as most immune-related molecules (Fig. S4B). Notably, ZNF683 demonstrated the strongest correlation with cytotoxic cells and CD8 + T cells (Fig. S3A), further supporting its close association with CD8 + T cell biology. Beyond its association with immunotherapy response, we investigated the relationship between ZNF683 expression and clinicopathological variables in the TCGA-LUAD cohort. We found that higher ZNF683 expression was significantly associated with earlier T stage (Fig. S4C), N stage (Fig. S4D), and clinical stage (Fig. S4E), as well as better survival outcomes (Fig. S4F). Consistently, patients with high ZNF683 expression exhibited significantly better prognosis (Fig. S4G).
Collectively, these findings demonstrate a robust transcriptional association between ZNF683 and a functionally distinct CD8 + T cell subset, establishing its promise as a novel complementary biomarker for immunotherapy-responsive CD8 + T cell populations.
Cancer patients with higher ZNF683 expression exhibited enhanced sensitivity to immunotherapy
Based on these analyses, we hypothesize that ZNF683 is functionally linked to a distinct CD8 + T cell subpopulation critically involved in immunotherapy response. To investigate its clinical relevance, we compared ZNF683 expression between responders and non-responders in two independent immunotherapy-treated NSCLC scRNA-seq cohorts GSE207422 (Fig. 4A) and GSE146100 (Fig. 4B). Strikingly, ZNF683 expression was significantly elevated in the responder group, suggesting its potential role in mediating therapeutic benefit. Subsequently, we evaluated ZNF683 and the traditional immunotherapy marker PD-L1 expression differences between response groups in bulk RNA-seq datasets from immunotherapy-treated patients. Across four independent NSCLC cohorts (GSE135222, GSE126044, GSE166449, OAK_PORLAR), ZNF683 levels were significantly elevated in responders compared to non-responders. This pattern was validated in six additional cancer types treated with immunotherapy including urothelial cancer (IMvigor210), melanoma (PMID:27956380, PRJEB23709), renal cell carcinoma (PMID:33806963), stomach adenocarcinoma (PRJEB25780), and ovarian cancer (GSE188249), where responders consistently exhibited higher ZNF683 expression, with robust diagnostic efficacy across all malignancies (Fig. 4C). ROC analysis revealed that the AUC value of ZNF683 was comparable to that of PD-L1 in distinguishing immunotherapy responders from non-responders (Fig. 4D), indicating that ZNF683 alone possesses robust predictive capacity similar to this established biomarker. Critically, survival analysis revealed superior prognosis in patients with high ZNF683 expression (Fig. 4E). Given ZNF683’s consistent predictive value for immunotherapy response across cancer types, we assessed its pan-cancer relevance in the TCGA-Pancancer cohort (one of the largest cancer genomics resources comprising over 10,000 patient samples). Correlation analyses confirmed significant positive associations between ZNF683 and CD8 + T cell markers CD8A/CD8B (Fig. 4F). Three computational algorithms—MCPcounter (Fig. 4G), QuantiSeq (Fig. 4H), and EPIC (Fig. 4I)—consistently identified CD8 + T cells as the immune subset most strongly correlated with ZNF683. Survival analysis revealed better prognosis in ZNF683-high patients in the TCGA-Pancancer cohort (Fig. 4J), potentially attributable to enhanced CD8 + T cell-mediated tumor killing through ZNF683-associated immune activation.

B Elevated ZNF683 in responders vs. non-responders in NSCLC scRNA-seq cohorts GSE207422 (A) and GSE146100 (B). C Bulk RNA-seq validation shows higher ZNF683 expression in responders across ten immunotherapy cohorts. D ROC analysis suggested that ZNF683 and PD-L1 demonstrate comparable AUC values in distinguishing immunotherapy responders from non-responders. E Survival benefit in high-ZNF683 immunotherapy patients. F Correlation of ZNF683 with CD8 + T cell markers CD8A/CD8B in TCGA-Pancancer cohort. Computational algorithms including MCPcounter (G), QuantiSeq (H), and EPIC (I) confirms strongest ZNF683 association with CD8 + T cells. J Cancer patients with higher ZNF683 expression have prolonged prognosis in the TCGA-Pancancer cohort.
Development of a ZNF683 + CD8 + T cell-based prognostic signature in LUAD patients
Lung adenocarcinoma (LUAD) represents the most prevalent histological subtype of non-small cell lung cancer (NSCLC), comprising approximately 40% of all lung cancer cases with a steadily increasing incidence. When compared to lung squamous cell carcinoma (LUSC)—the second most prevalent NSCLC histological subtype—LUAD demonstrates distinct molecular pathogenesis characterized by early metastatic dissemination, rapid disease evolution, and ultimately inferior prognosis. This aggressive biological behavior, coupled with frequent therapeutic resistance, underscores the pressing clinical need for reliable prognostic biomarkers in LUAD management. Based on our above findings establishing ZNF683 + CD8 + T cells as crucial mediators of anti-tumor immunity and predictors of therapeutic response, we decided to develop a novel ZNF683 + CD8 + T cell-derived prognostic signature to enable more accurate prognostic prediction in LUAD patients. Using the FindMarkers function from the Seurat package, we identified the marker genes for the ZNF683 + CD8 + T cell subpopulation (Table S2). To identify optimal candidate genes for constructing the ZNF683 + CD8 + T cell-derived prognostic signature, we implemented the selection criteria as followed:
-
(1)
Cross-cohort consistency: Genes must be detectable in all ten analyzed LUAD cohorts to ensure broad applicability;
-
(2)
Prognostic validation: Genes must show significant prognostic value (P < 0.05 in univariate Cox regression) in the three largest LUAD cohorts (TCGA-LUAD, n = 497; GSE72094, n = 398; and GSE68465, n = 443) to guarantee statistical robustness.
Through this selection process, we identified 19 candidate marker genes for prognostic model development. To optimize predictive performance, we systematically evaluated 296 different algorithm combinations derived from 32 distinct machine learning algorithms, using the TCGA-LUAD cohort as the discovery dataset. Each combination was rigorously assessed through calculation of the C-index across nine independent validation cohorts. Notably, the ‘StepCox[forward] + Ridge’ combination demonstrated superior predictive accuracy, achieving the highest mean C-index of 0.68 (95% CI: 0.64–0.72) across all validation datasets. Based on this, we selected this combination to construct the ZNF683 + CD8 + T cell-related Riskscore (ZNFRS, Fig. 5A). ZNFRS was calculated by multiplying the expression level of each ZNF683 + CD8 + T cell marker gene by its corresponding coefficient and summing the results (marker genes and corresponding coefficients provided in Table S3).

A Construction of the ZNFRS by an AI-driven approach. B Kaplan-Meier survival curves comparing the prognosis between the high- and low-ZNFRS groups across all cohorts. C Time-dependent ROC analysis showing the AUC values for ZNFRS’s ability to predict patient prognosis over 1–5 years.
ZNFRS = IL6ST * (–0.008166472) + PIK3IP1 * (–0.001901932) + ITGB1 * 0.065417027 + TOX * (–0.012694901) + EIF4A3 * 0.000310727 + ARHGAP25 * (–0.038123576) + TACC3 * 0.044783038 + SMC2 * 0.041168771 + PERP * 0.054452532 + MTHFD2 * (–0.019265406) + PKM * 0.040276424 + PIK3R1 * (–0.017633318) + CD74 * (–0.019819392) + CENPF * 0.02966907 + GAPDH * 0.065295238 + FOSL2 * 0.065722606 + BTG2 * (–0.036125111) + LDHA * 0.106773882 + IL7R * (–0.049422696)
We calculated ZNFRS across all ten LUAD cohorts and stratified patients into high-risk and low-risk groups based on the median risk score. Results demonstrated that high-risk patients consistently exhibited significantly poorer prognosis in all cohorts (Fig. 5B). ROC analysis confirmed the robust predictive power of ZNFRS, with consistently high AUC values observed across all datasets (Fig. 5C). To validate whether ZNFRS serves as an independent prognostic factor in LUAD, we performed multivariate cox regression analyses across ten LUAD cohorts, including all available clinicopathological variables from each cohort as covariates (Supplementary Table S4) and excluding patients with missing data for these variables. ZNFRS retained significant prognostic value (all p value < 0.05) after this adjustment in every cohort (Fig. S5), confirming its reliability as an independent predictor. We further evaluated ZNFRS in the TCGA-Pancancer cohort. In the combined analysis of all cancer types, patients with high ZNFRS showed significantly worse prognosis. Notably, this detrimental effect was consistently observed across 16 specific cancer types, demonstrating the broad prognostic value of ZNFRS beyond LUAD (Fig. S6).
Comparison of ZNFRS with clinical factors and published prognostic models
To further validate ZNFRS superiority, we conducted comprehensive comparisons against standard clinical parameters. Analysis of AUC values (Fig. 6A) and C-Index (Fig. 6B) across ten independent cohorts demonstrated consistent outperformance of ZNFRS over most clinical variables. Further comparative evaluation against 105 published gene signatures representing diverse phenotypes revealed ZNFRS maintained competitive performance (Fig. 6C). While ranking modestly in TCGA (likely due to overfitting in signatures trained on this cohort), ZNFRS achieved superior C-index values in all validation cohorts compared to most existing models. This multi-dimensional validation establishes ZNFRS as a robust prognostic indicator.

Comparison of the AUC value (A) and C-Index (B) between ZNFRS and clinical factors across ten cohorts. C Comparison of ZNFRS and 105 published gene signatures in terms of C-index across ten cohorts.
High ZNFRS may indicate “cold” tumor status in LUAD
Given that ZNFRS is a signature derived from 19 marker genes of ZNF683 + CD8 + T cells, a population significantly associated with the NSCLC TME, we were prompted to investigate the link between ZNFRS and the TME. We employed six distinct algorithms to quantify immune cell infiltration within the TME of LUAD patients and analyzed the correlation between ZNFRS and immune cells. The results demonstrated that ZNFRS showed negative correlations with the majority of immune cells across 10 LUAD cohorts (Fig. 7A). Subsequently, we analyzed the relationships between ZNFRS and molecules involved in antigen presentation (Fig. 7B), immunomodulatory molecules (including immunoinhibitors and immunostimulators, Fig. 7C), and chemokines/chemokine receptors (Fig. 7D). The results consistently indicated that ZNFRS is negatively correlated with these key TME molecules. Finally, we collected seven immunotherapy cohorts containing available patient prognostic information and calculated ZNFRS within these cohorts. Results revealed that among patients receiving immunotherapy, higher ZNFRS were associated with poorer prognosis, while lower ZNFRS correlated with prolonged prognosis (Fig. S7A). To determine whether ZNFRS is independent of general tumor immunogenicity, we evaluated its relationship with tumor mutational burden (TMB) in the IMvigor210 cohort (the only immunotherapy cohort with available TMB data). ZNFRS and TMB showed no significant correlation (Fig. S7B), confirming they represent distinct biological dimensions. Although high TMB predicted better survival (Fig. S7C), high ZNFRS remained associated with worse prognosis in both TMB-low and TMB-high subgroups (Fig. S7D, E). Combined stratification revealed the poorest survival in high-ZNFRS/low-TMB patients and the best in low-ZNFRS/high-TMB patients (Fig. S7F). These results demonstrate that ZNFRS is not a surrogate for mutation burden but an independent biomarker that specifically quantifies an immunosuppressive tumor microenvironment, identifying a high-risk subset even among patients with high immunogenic potential. Combined with our findings demonstrating negative correlations between ZNFRS and most TME molecules, we speculate that patients with high ZNFRS may exhibit a “cold” tumor status. Potentially, this leads to immunotherapy resistance and immunosuppression.

A Negative correlation between ZNFRS and immune cell infiltration quantified by six algorithms across 10 LUAD cohorts. Negative correlations of ZNFRS with antigen presentation molecules (B), immunomodulators (inhibitors/stimulators, C), and chemokines/receptors (D).
Genomic variations and their relationship with ZNFRS status
We conducted a comprehensive genomic comparison between ZNFRS-high and ZNFRS-low groups in the TCGA dataset. Analysis of the top 20 genes with highest mutation frequencies showed that ZNFRS-high patients had a significantly higher overall mutation rate (96.31%, Fig. S8A) than ZNFRS-low patients (90.08%, Fig. S8B). The top 35 genes with the most divergent mutation frequencies were consistently more mutated in ZNFRS-high samples (Fig. S8C), with significant co-mutation patterns observed among these genes (Fig. S8D). ZNFRS expression was significantly positively associated with genomic features including fraction of altered genome (FGA), fraction of genome gained (FGG), fraction of genome lost (FGL), and tumor mutation burden (TMB, Fig. S8E). CNV analysis revealed marked group differences: ZNFRS-high patients exhibited more frequent and complex CNV events (Fig. S8G), reflecting heightened genomic instability, whereas ZNFRS-low patients showed lower genomic instability (Fig. S8F). ChromPlots further confirmed that ZNFRS-high patients had significantly higher G-scores (Fig. S8I) than ZNFRS-low counterparts (Fig. S8H).
Collectively, these findings strongly indicate that LUAD patients with high ZNFRS expression exhibit more aggressive genomic profiles characterized by elevated mutation burden, genomic instability, and CNV complexity.
Uncovering the role of ZNFRS in the TME through single-cell analysis
Building upon the bulk cohort analyses above, which suggested ZNFRS’s potential association with immunosuppression and its link to a “cold” tumor status, we further explored the significance of ZNFRS at the single-cell level. First, to identify malignant cells within the epithelial compartment, we isolated epithelial cells from the GSE207422 dataset and performed re-clustering, resulting in eight epithelial subpopulations (Fig. S9A). To identify malignant cells among these, we performed inferCNV analysis for copy number variation (CNV) inference. This revealed high CNV scores in subpopulations Epi-C0, C1, C3, and C6, indicating their high malignant potential (Fig. 8B, C). To further validate this, we conducted CytoTRACE analysis, which suggested lower differentiation states (implying higher malignancy) in Epi-C0, C1, C3, and C6 (Fig. 8D, E). Based on these combined analyses, we identified Epi-C0, C1, C3, and C6 as malignant cells. Subsequently, we calculated ZNFRS across all cells in the GSE207422 dataset, identifying malignant cells as having the highest score (Fig. S9F). We then stratified all cells into High-ZNFRS and Low-ZNFRS groups based on the median ZNFRS. Notably, the High-ZNFRS group was predominantly enriched within the Myeloid and Epithelial/Malignant cell populations (Fig. S9G), which suggests immunotherapy resistance. Subsequently, we performed differential expression analysis between high- and low-ZNFRS groups across both single-cell and bulk sequencing datasets for cross-validation. The differentially expressed genes (DEGs) identified in the single-cell dataset and bulk dataset are presented in Fig. S9H (Table S5) and Fig. S9I (Table S6), respectively. Gene Set Enrichment Analysis (GSEA) of these DEGs revealed that in the single-cell dataset, genes upregulated in high-ZNFRS groups were primarily enriched in malignancy-associated processes including “Lung cancer poor survival”, “glycolysis and gluconeogenesis”, “Hypoxia Up”, “cell migration”, “P53 downstream pathway”, and “Metastasis EMT Up”. Conversely, genes upregulated in low-ZNFRS groups showed enrichment in tumor-suppressive functions such as “Lung cancer good survival” and “Hypoxia Dn”, along with TME-related pathways including “differentiating T lymphocyte”, “B cell receptor signaling pathway”, and “CD8 TCR downstream pathway” (Fig. S9J). Strikingly, parallel GSEA in the bulk sequencing dataset yielded concordant results: high-ZNFRS signatures associated with tumor-progressive functions while low-ZNFRS signatures correlated with tumor-suppressive mechanisms and TME-related processes (Fig. S9K). Finally, using the AUCell algorithm in the single-cell dataset, we quantified activity levels of GSEA-enriched biological functions. Results demonstrated significantly elevated activity of high-ZNFRS-associated functions (enriched by genes upregulated in high-ZNFRS groups) specifically in high-ZNFRS cells (Fig. S9L), while low-ZNFRS-linked functions (enriched by genes upregulated in low-ZNFRS groups) showed heightened activity in low-ZNFRS cells (Fig. S9M).

A Distinct tumor microenvironment composition between low-ZNFRS and high-ZNFRS groups. B Enhanced cell-cell interaction numbers and communication strength in high-ZNFRS group. C Increased communication between malignant/myeloid cells to CD4 + T cells, CD8 + T cells, and NK cells observed in the high-ZNFRS group. SPP1 signaling pathway originating from malignant and myeloid cells targets CD4 + T, CD8 + T, and NK cells, present exclusively in high-ZNFRS group (E) but absent in low-ZNFRS group (D). F High-ZNFRS-specific activation of SPP1-CD44 and SPP1-ITGA4-ITGB1 ligand-receptor pairs.
Based on the integrated bulk and single-cell analyses, we establish that elevated ZNFRS associates with tumor-promoting mechanisms, whereas reduced ZNFRS correlates with immune-promoting and tumor-suppressing functions, positioning ZNFRS as a robust novel TME biomarker.
Myeloid and malignant cells may inhibit the infiltration of T cells and NK cells through the SPP1 signaling pathway
In the GSE207422 dataset, the low-ZNFRS group exhibited a higher proportion of immune cells—including B cells, CD4 + T cells, CD8 + T cells, NK cells, neutrophils, plasma cells, and mast cells—whereas the high-ZNFRS group showed increased proportions of stromal cells (endothelial cells, fibroblasts), epithelial cells, malignant cells, and myeloid cells (Fig. 8A). Cell-cell communication analysis revealed significantly stronger overall interactions in the high-ZNFRS group (Fig. 8B), with enhanced communication particularly between malignant/myeloid cells and CD4 + T, CD8 + T, and NK cells (Fig. 8C). Notably, the SPP1 signaling pathway—originating from malignant and myeloid cells and targeting CD4 + T, CD8 + T, and NK cells—was exclusively active in the high-ZNFRS group (Fig. 8D, E), mediated specifically through SPP1-CD44 and SPP1-(ITGA4 + ITGB1) axes (Fig. 8F).
To pinpoint the myeloid sources, we re-clustered myeloid cells into macrophages, monocytes, DC2, DC3, and pDCs (Fig. S10). SPP1 signaling from monocytes and macrophages to T/NK cells was detected only in the NMPR group (Fig. S11A). While macrophage-derived SPP1 signaling was present in both ZNFRS groups (though stronger in high-ZNFRS), monocyte-derived SPP1 signaling to CD8 + T cells was unique to the high-ZNFRS group (Fig. S11B). Subsequent results demonstrated that both monocytes and macrophages can communicate with all CD8 + T cell subtypes via the SPP1 signaling pathway exclusively in the NMPR group (Fig. S12A). While macrophages exhibited interactions with all CD8 + T cell subtypes in both high- and low- ZNFRS groups, their interaction strength was higher in the high-ZNFRS group (Fig. S12B).
These results identify monocyte/macrophage driven SPP1 signaling as a specific communication network active in high-ZNFRS tumors, providing a mechanistic link between the ZNFRS signature, an “immune cold” TME, and immunotherapy resistance.
Independent validation cohort confirms ZNF683 + CD8 + T cell deficiency and dominant SPP1 signaling in immunotherapy-resistant NSCLC
To further consolidate our findings and ensure robust generalizability, we leveraged an independent validation cohort (GSE241934) comprising 34 NSCLC patients treated with neoadjuvant chemoimmunotherapy (13 MPR and 21 NMPR). Consistent with our primary results, CD8 + T cells were more abundant in MPR tumors (Fig. 9A–C). Subclustering revealed distinct CD8 + T cell subsets, with ZNF683 expression significantly elevated in the MPR group (Fig. 9D, E). The ZNF683 + CD8 + T cell subset was uniquely enriched in MPR tumors (Fig. 9F), and Ro/e analysis confirmed it as the only CD8 + T cell population significantly enriched in responders (Fig. 9G). To gain insight into the biological processes associated with ZNF683, we identified genes whose expression was most positively correlated with ZNF683 in the TCGA-LUAD cohort; the top 20 genes showing the strongest positive correlation are displayed in Fig. S13A. Functional enrichment analysis of these genes revealed significant enrichment for terms related to T cell activation, immune effector process, and immune activation (Fig. S13B). This result reinforces, at a transcriptional program level, that high ZNF683 expression marks a tumor microenvironment characterized by robust anti-tumor immunity.

A UMAP of major cell types. B Dot plot of canonical markers. C Proportional abundance of major cell types in MPR vs. NMPR. D UMAP of CD8 + T cell subsets. E Dot plots of subset–defining markers (left) and ZNF683 expression by response (right). F Proportional abundance of CD8 + T cell subsets. G Ro/e analysis confirming specific enrichment of ZNF683 + CD8 + T cells in MPR. H UMAP of four macrophage subsets. I Dot plots of macrophage markers (left) and SPP1 expression by response (right). J Proportional abundance of macrophage subsets. K Differential interaction strength between macrophage subsets and T/NK cells. L Bubble plot showing SPP1 signaling exclusively from SPP1+ Macrophages. M Bubble plot showing differential SPP1 signaling from SPP1+ Macrophages to each CD8 + T cell subset.
We next dissected the myeloid and epithelial compartments. Myeloid cells were categorized into macrophages, monocytes, DCs, and neutrophils (Fig. S13C, D). Macrophages were significantly more abundant in the NMPR group (Fig. S13E). Epithelial cells were subclustered into eight subsets (Fig. S13F). Copy number variation (CNV) inference identified Epi-C3 and Epi-C4 as normal epithelial cells, with the remaining subsets classified as malignant (Fig. S13G). Malignant epithelial cells were enriched in NMPR tumors (Fig. S13H). Cell-cell communication analysis indicated that SPP1 signaling from macrophages and monocytes to T cells and NK cells was specifically heightened in the NMPR group, with macrophages acting as the dominant signaling source (Fig. S13I). In this validation cohort, SPP1 signaling was not detected from malignant cells, distinguishing it from our previous observation in the discovery dataset and highlighting myeloid cells as the principal SPP1-expressing compartment in this patient cohort.
As macrophages exhibited stronger SPP1 signaling than monocytes, we performed refined subclustering of the macrophage compartment to determine the specific subset primarily responsible for this dominant immunosuppressive signaling. All macrophages were thereby classified into four subsets based on highly expressed genes: SPP1+ Macrophages, CXCL9+ Macrophages, FBP1+ Macrophages, and SELENOP+ Macrophages (Fig. 9H, I). The SPP1+ Macrophage subset was significantly expanded in NMPR tumors (Fig. 9J) and exhibited selectively enhanced communication with T/NK cells in non-responders (Fig. 9K). This interaction was mediated by the SPP1 signaling pathway, which was significantly stronger in NMPR samples (Fig. 9L) and targeted all CD8 + T cell subsets (Fig. 9M).
Collectively, analysis of this independent validation cohort robustly corroborates the core findings that a deficit in ZNF683 + CD8 + T cells and a dominance of SPP1+ macrophage-mediated immunosuppression are hallmarks of the non-responsive, immunologically “cold” tumor microenvironment in NSCLC.
Independent validation cohort confirms immunosuppressive nature of high-ZNFRS tumors
To validate the association between ZNFRS and TME immunosuppression established in our discovery analyses, we applied the same ZNFRS algorithm to the independent GSE241934 single-cell cohort. This validation yielded highly consistent results: malignant cells again exhibited the highest ZNFRS scores (Fig. S14A). All cells were stratified into high- and low-ZNFRS groups based on the mean ZNFRS (Fig. S14B). Reaffirming our core finding, the high-ZNFRS group showed significantly reduced proportions of key immune populations including CD4 + T cells, CD8 + T cells, NK cells, and B cells alongside an increase in malignant and stromal cells (Fig. S14C). Cell-cell communication analysis further confirmed the enhanced immunosuppressive network, revealing significantly stronger overall interactions between macrophage subsets and T/NK cells in high-ZNFRS tumors (Fig. S14D). Most notably, we precisely validated the dominant immunosuppressive mechanism: SPP1 signaling from SPP1+ Macrophages to CD4 + T cells, CD8 + T cells, and NK cells was selectively and significantly elevated in high-ZNFRS cells (Fig. S14E), with demonstrably stronger signaling to all CD8 + T cell subsets (Fig. S14F). These results conclusively validate that high ZNFRS consistently identifies tumors characterized by cytotoxic lymphocyte depletion and dominant SPP1+ macrophage-mediated immunosuppression across independent cohorts.
SPP1 blockade remodels the tumor microenvironment and synergizes with anti-PD-1 therapy in LUAD
To experimentally validate the role of SPP1 in driving an immunosuppressive,‘immune-cold’ tumor microenvironment and conferring resistance to immunotherapy, we established a subcutaneous LLC model and administered four treatment regimens: PBS (control), anti-PD-1, anti-SPP1, and their combination (Fig. 10A). Both anti-PD-1 and anti-SPP1 monotherapies significantly suppressed tumor growth compared to the control, and the combination therapy exerted the strongest inhibitory effect (Fig. 10B). Flow cytometry revealed a stepwise increase in tumor-infiltrating CD8 + T cells, peaking in the combination group (Fig. 10C). Correspondingly, CD8 + T cells from the combination group exhibited the most pronounced elevation in the production of effector molecules IFN-γ and granzyme B (Fig. 10C). The complete gating strategy for the flow cytometry analysis is provided in Supplementary Figs. S15A and S15B.

A The experimental workflow. B Tumor growth curves showing that both monotherapies significantly inhibit tumor growth, with the combination showing the strongest effect. C Flow cytometry shows elevated CD8 + T proportions with enhanced IFN-γ/GZMB secretion.
To dissect the cellular and molecular mechanisms through which anti-SPP1 therapy remodels the tumor microenvironment and sensitizes tumors to immunotherapy, we performed scRNA-seq on tumors harvested from control and anti-SPP1 treated mice. Further analysis of the scRNA-seq results via conventional marker-based cell annotation revealed that the LLC subcutaneous TME was predominantly composed of non-immune cells, with only three infiltrating immune celltypes—macrophages, T/NK cells, and neutrophils (Fig. 11A). Compared with the control group, the anti-SPP1 treatment group exhibited increased infiltration across all three immune cell subtypes to varying degrees alongside a reduced proportion of non-immune cells (Fig. 11B). We further isolated the T/NK cell subpopulations for re-clustering, categorizing them into four distinct subsets: CD8 + T cells (Cd3 + Cd8 + Cd4-), CD4 + T cells (Cd3 + Cd4 + Cd8-), Naïve T cells (Cd3 + Cd4-Cd8-), and NK cells (Cd3-Ncr1 + ). Proportional analysis revealed that anti-SPP1 treatment reduced the proportion of CD4 + T cells while increasing the proportions of the other three subsets to varying degrees (Fig. 11C). We further isolated CD8 + T cells for in-depth analysis. Transcriptomic profiling revealed that highly expressed genes in control-group CD8 + T cells were predominantly enriched in metabolic functions, including ‘ATP metabolic process’, ‘pyruvate metabolic process’, ‘glucose metabolic process’, and ‘cellular response to hypoxia’, suggesting metabolic reprogramming to adapt to TME stress. Conversely, CD8 + T cells from the anti-SPP1 group exhibited significant enrichment of immune activation-related pathways, including ‘activation of immune response’, ‘positive regulation of immune effector process’, ‘immune response-activating signal transduction’, ‘regulation of T cell activation’, and ‘regulation of cell killing’ (Fig. 11D). These findings collectively indicate that anti-SPP1 therapy functionally reinvigorates CD8 + T cells within the LLC TME, enhancing their tumor-clearing capacity and thereby suppressing tumor growth. We also compared macrophage alterations pre- and post-treatment by isolating and subclustering them into two functionally distinct subsets based on canonical markers: the anti-tumor and immunologically active M1-like subtype, defined by co-expression of Cd68 with Cd86 or Cd80, versus the pro-tumor and immunosuppressive M2-like subtype, defined by co-expression of Cd68 with Cd206 or Cd163. This analysis revealed increased proportions of M1-like macrophages following anti-SPP1 therapy (Fig. 11E). Correspondingly, immunofluorescence showed augmented CD8 + T cell infiltration alongside a reduction in M2-like macrophages (defined by Cd68 + Cd206+ staining) after treatment (Fig. 11F). These findings validate our single-cell transcriptomic results, collectively indicating that SPP1 signaling inhibition reverses the LUAD tumor microenvironment, converting immunosuppression into immunoactivation, thereby suppressing tumor progression.

A Identification of four celltypes in the LLC TME by scRNA-seq. B Anti-SPP1 therapy increases all immune subsets, decreases non-immune cells. C Subclustering of T/NK cells. D GO enrichment analysis of genes highly expressed in CD8 + T cells at different groups (control vs. anti-SPP1). E Anti-SPP1 therapy decreases M2-like macrophage proportion. F Immunofluorescence indicated increased CD8 + T infiltration with concurrent M2 reduction post-treatment.