

Bacterial strains
In this study, wild-type (wt) Salmonella enterica subsp. enterica serovar Typhimurium (ATCC14028, S. Typhimurium), an isogenic ΔsopB mutant strain, ΔsopB mutant strains complemented with sopB (ΔsopB, psopB) or sopB and its chaperon sigE (ΔsopB, psopBsigE), an isogenic ΔsopE2 mutant strain4, as well as strains carrying chromosomal alleles with point mutations encoding SopB with exchanges in the C-terminal domain at position 460 (C460S, SopBC460S) or 528 (K528A, SopBK528A) or in the N-terminal domain in position 76 (L76P, SopBL76P) were used (Suppl. Table 1). Low copy number plasmid p4042 has been introduced before4 and was shown to restore the function of deleted sopB. pP4042 was used as a template for site-directed mutagenesis using Q5 site-directed mutagenesis kit (NEB) according to the manufacturer’s instructions and primers listed in Supplementary Table 2. The resulting plasmids listed in Supplementary Table 3 were confirmed by DNA sequencing and by Western blot analyses for synthesis of SopB-HA by STM harbouring respective plasmids after subculture in LB for induction of SPI1. Strains expressing HA-tagged mutant sopB alleles were generated by λ Red-mediated allelic exchange as described59. Briefly, strain MvP2726 was generated by replacing sopB by a targeting DNA cassette TC1 generated from pWRG717 using primers sopB In717 For and sopB In717 Rev2 (see Suppl. Table 1, 2). Insertion of the cassette was controlled by check PCR with sopB DelCheck Rev and k1 RedDel. MvP2726 was used as a parental strain for a second λ Red-mediated recombination with TC2 for exchange of the sopB locus against wt or mutant alleles. TC2 DNA was generated from plasmids (Supplementary Table 3) with wt or mutant alleles of sopB::HA using primers SeqFor and sopB-HA RedIn Rev (Supplementary Table 2). Mutant strains with successful allelic exchange of the sopB locus were cured from helper plasmid pWRG730, and synthesis of SopB was controlled by Western blot alleles of S. Typhimurium strains after culture under SPI1-inducing conditions. In Western blots, the HA tag was detected using rat anti-HA monoclonal antibodies (clone 3F10, Roche 11867423001). For the generation of a 3xFLAG-tagged allele of sopB, the sopB locus of strain MD1163 was transferred to ATCC14028 by P22 transduction (Supplementary Table 1).
Ethics statement
All animal experiments were performed in compliance with the German animal protection law (TierSchG) and approved by the local animal welfare committee (Niedersachsische Landesamt für Verbraucherschutz und Lebensmittelsicherheit Oldenburg, Germany; Landesamt für Natur, Umwelt und Verbraucherschutz, North Rhine Westfalia) under the code 84-02.04.2017.A397 and 84–02.04.2021.A043 including all approved changes.
In vivo infection experiments
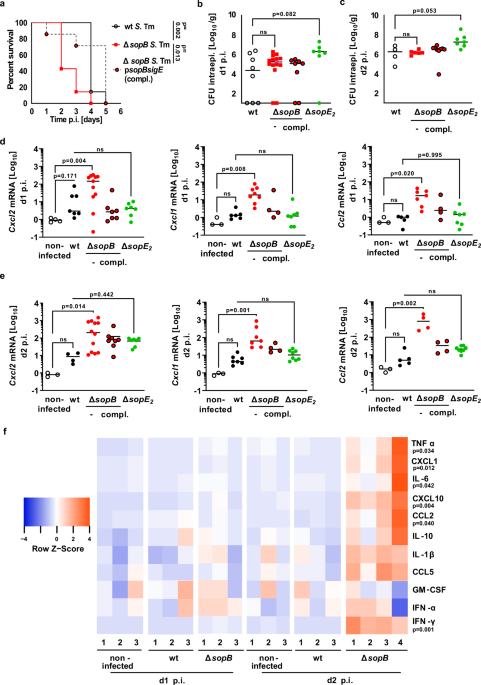
Adult C57BL/6 J wild type mice, Casp1-/- (B6. 129S2-Casp1tm1Flv/J, stock no.016621), Asc-/- mice (B6. 129-Pycardtm1Vmd), and Tnfrsf1a-/- (Tnfrsf1atm1MAK; stock 002818) were obtained from Jackson Laboratory (Bar Harbour, USA) and bred locally at University Hospital RWTH Aachen under SPF conditions. Mlkl-/- (BV6. 129-Mlkltm1/J), and Casp8ΔIEC (B6. 129-Casp8tm1Hed/J; stock 027002) mice were provided by James Murphy (Walter and Eliza Hall Institute of Medical Research, Australia) and Claudia Günther (University Hospital Erlangen, Germany) and bred locally at University Hospital RWTH Aachen under SPF conditions. Overnight bacterial cultures grown on a shaker in Luria Bertani (LB) were diluted 1:10 and incubated at 37 °C on a wheel (22 rpm) under mild aeration to induce SPI1 T3SS activity until reaching the logarithmic phase (OD600: 0.5) as described3,60. Bacteria were washed and diluted to obtain the appropriate inoculum in PBS. One-day-old animals were orally infected with 100 CFU S. Typhimurium. 9-week-old adult female mice were pretreated with streptomycin (20 mg) administered by intragastric gavage one day prior to oral infection with 107 CFU S. Typhimurium, as previously described60. At the indicated time point postinfection (p.i.), liver, spleen and mesenteric lymph nodes (MLN), small intestine, as well as blood samples were collected. Viable counts were obtained by serial dilution and plating of homogenised tissue on LB agar plates supplemented with the appropriate antibiotic(s). Small intestinal tissues were collected, fixed in 4% paraformaldehyde (PFA) for histological analysis or processed for total tissue expression, respectively. For ex vivo tissue cytokine secretion, small intestines were longitudinally opened and sectioned into smaller pieces. Tissue pieces were incubated in 100 µL RPMI medium supplemented with 10% fetal calf serum (FCS) at 37 °C in a 5% CO2 humidified atmosphere. After 2 h, 50 µl supernatant was collected and analysed.
Gene expression analysis
RNA was isolated from the epithelial cell pellet or homogenised intestinal tissue using TRIzol® according to the manufacturer’s recommendations. The RNA concentration was determined using a NanoDrop 1000 spectrophotometer (Thermo Scientific). First-strand complementary DNA (cDNA) was synthesised from 5 µg total RNA using Oligo-dT primers, 5X PCR buffer, dNTP, RevertAid reverse transcriptase and RiboLock RNase inhibitor (ThermoFisher Scientific). RT-PCR was performed using Taqman technology with an absolute QPCR ROX mix (Thermo Scientific). Taqman probes Hprt (house-keeping gene, Mm00446968_m1), Cxcl1 (Mm04207460_m1), Cxcl2 (Mm00436450_m1), Cxcl5 (Mm00436451_g1), Ccl2 (Mm00441242_m1), Tnf (Mm00443258_m1), Reg3g (Mm00441128_g1), Bcl2 (Mm01302952_g1) or Nos2 (Mm00440502_m1) from ThermoFisher Scientific were used. Results were calculated by the 2−ΔΔCt method. Values were normalised to the Hprt housekeeping gene and are presented as fold induction over age-matched healthy controls.
RNA Seq and transcriptome analysis
RNA was prepared from primary, freshly isolated intestinal epithelial cells obtained from age-matched uninfected mice, or mice infected with wt or ΔsopB S. Typhimurium at day 1 p.i., using TRIzol®. Libraries were prepared with the QuantSeq 3’mRNA-Seq v2 Library Prep Kit FWD with UDIs (Lexogen), using an input of 125 ng, and were sequenced in single end mode (read 1: 75 cycles, index 1: 12 cycles, index 2: 12 cycles, read 2: 0 cycles) on a NovaSeq 6000 (Illumina), using a NovaSeq 6000 SP Reagent Kit v1.5 (100 cycles) (Illumina). Raw sequencing reads were trimmed using Cutadapt v4.9 with the following parameters: -j 16 -a “poly A = A(20)” –quality-cutoff 20 -m 20 -u 12, to remove poly-A tails, low-quality bases, and adaptor sequences. A genome index was generated using STAR v2.7.11b in genome generation mode (–sjdbOverhang 63) based on the GRCm39.112 mouse reference genome. Trimmed reads were then aligned to the genome index using STAR with parameters –outSAMtype BAM SortedByCoordinate and –quantMode GeneCounts to produce BAM files. Gene-level count matrices were generated using the featureCounts function from the Rsubread package (v2.14.2). Differential gene expression analysis was performed using DESeq2 v1.44.0, including only genes with a total count of at least 60 across all samples. GO enrichment analysis was conducted using the clusterProfiler package (v4.12.6) with the org.Mm.eg.db database. Multiple testing correction was applied using the Benjamini-Hochberg method. GSEA was performed with the Python gseapy package (v1.1.9) using genes from the mmu04668 KEGG pathway.
Cytokine, chemokine and endotoxin quantification
Cytokine and chemokine levels, including the concentrations of TNF and IL-18 in the medium supernatants and serum samples, were measured using the LEGENDplexTM Mouse Virus Response Panel (BioLegend, Cat No 740622) and LEGENDplex™ Mouse M1 Macrophage Panel (BioLegend, Cat. Nr 740848) according to the manufacturer’s protocol. Samples were measured using a BD FACS Canto II and analysed with the LEGENDplex™ Data Analysis Software Suite (Qonit). Results are expressed as picograms per millilitre. The heat map was generated using Heatmapper (http://www.heatmapper.ca)61. CXCL2 secretion by m-ICcl2 cells was quantified using a CXCL2 ELISA from Biosite (Cat. No.: PPE 21335). The endotoxin concentration in cell culture medium was measured using the Kinetic-QCLTM Kinetic chromogenic LAL assay (Lonza, Cat. No.: 50-650).
Intestinal epithelial and immune cell isolation and analysis
Primary small intestinal epithelial cells were isolated as previously described3. Briefly, epithelial cells were detached from the underlying tissue in 30 mM EDTA/PBS with strong shaking. To analyse the number of intraepithelial S. Typhimurium, one fraction of epithelial cells was treated with 100 μg/mL gentamicin for 1 h at room temperature, washed in PBS and plated in serial dilutions on selective LB agar plates. The other fraction of epithelial cells was stored in Trizol at − 80 °C for subsequent gene expression analysis. For the isolation of immune cells, Peyers patches and feces were removed, the intestine was opened longitudinally and transferred into 20 ml of HBSS/3% FBS with 2 mM EDTA. The intestine was shaken twice at 150 rpm at 37 °C for 20 min. After the second incubation, the intestine was rinsed with PBS to remove the EDTA. The remaining intestine was enzymatically digested in RPMI (Gibco) containing 30 µg/ml LiberaseTM (Roche) and 100 µg/ml DNase (Roche) for 45 min shaking at 37 °C. Tissue pieces were filtered through a 100 µm nylon cell strainer (BD) to obtain a single cell suspension. Immune cells were separated using a Percoll gradient by centrifugation at 700 x g for 20 min. at room temperature. Cells were stained using the following antibodies CD45-FITC (Clone 30-F11), Ly6C-PerCPCy5.5 (Clone HK1.4), Ly6G-PE (Clone 1A8), Ly6G-Spark NIR 685 (Clone 1A8), Ly6C-BV711 (HK1.4), CD11b-APC Cy7 (Clone N418), CD11b-BUV 395 (Clone M1/70), CD64-APC (Clone X54-5/7.1), CD64-PE Dazzle (Clone X54-5/7.1), MHCII-AF488 (Clone M5/114.15.2), MHCII-BV510 (Clone M5/114.15.2), PDL1-PE (Clone 10 F.952), SiglecF-APCR700 (Clone 90/CD38; BD), Epcam-BV421 (Clone G8.8), CD3-FITC (Clone 17A2), CD19-FITC (Clone 6D5), (Biolegend) and DAPI (Roth) for subsequent analytical flow cytometry. Data were acquired with a BD FACS Canto II and analysed with FlowJo X. For FACS sorting, approximately 3-6 million monocytes, macrophages, and neutrophils were sorted by BD Biosciences FACS Aria Fusion Sorter and directly collected into RNA lysis Buffer (QIAGEN RNeasy Micro Kit QIAGEN). Total RNA of each immune cell population was extracted using QIAGEN RNeasy Micro Kit following the manufacturer’s instructions.
Ex vivo stimulation of isolated immune cells
Immune cells were collected, washed in 3% FCS/PBS and counted. 106 cells were cultured in 500 µL Iscove’s modified Dulbecco’s medium (Thermo Fisher Scientific) supplemented with 10% FBS, with/without 1 µL of the cell activation cocktail (phorbol myristate acetate (PMA) and ionomycin (I), Biolegend, Cat. No.: 423302). After incubating the cells at 37 °C in a 5% CO2 humidified atmosphere for 1 h, 5 µg/ml brefeldin A (BFA, Biolegend, Cat. No.: 420601) was added. After 3 more hours of re-stimulation, cells were collected, washed once with 3% FCS/PBS, and resuspended in 3% FCS/PBS. Cells were then harvested and stained with the following antibodies (Biolegend): CD45-APCR700 (Clone 30-F11; BD Biosciences), CD3-APCFire750 (Clone 17A2), PDL1-APC (Clone 10 F.952), SiglecF-BB515 (Clone E50-2440; BD Biosciences), CD11c-BUV737 (Clone N418: BD Biosciences), CD64-PEDazzle (Clone 90/CD38), CD11b-BV786 (Clone M1/70), F4/80-PECy5 (Clone BM8), Epcam-BV421 (Clone G8.8), MHCII-BV510 (Clone M5/114.15.2), Ly6C-PerCP-Cy5.5 (Clone HK1.4), Ly6G-BV711 (Clone 1A8), CD80-BUV 805 (Clone 16-10A1; BD Biosciences), CD19-PECy7 (Clone 6D5) for 20 min at 4 °C and 30 min with Zombie UV at 4 °C (Cat. No.: 423107, BioLegend). Stained cells were fixed and permeabilised (BD Cytofix/Cytoperm™, Cat. No. 554722 according to the manufacturer’s instructions) prior to intracellular cytokine staining with a TNFα-PE (Clone MP6-XT22) antibody overnight at a 1:500 dilution (Biolegend). Data were acquired on a Cytek Aurora flow cytometer and analysed with FlowJo X.
Immunostaining
Fixed small intestinal tissues were embedded in paraffin or OCT. 4 μm thick sections were deparaffinised and rehydrated. Slides were stained with haematoxylin and eosin Y solution for H & E staining and observed under a Zeiss Axio Imager M2 light microscope. The thickness of the lamina propria as a measure of the tissue oedema was measured using the ZEN 3.4 imaging software. For immunofluorescence staining, tissue sections were blocked with 10% normal donkey serum/5% BSA/PBS. Rabbit anti-Ki67 (Ab15580, Abcam), mouse anti-E-cadherin (610182, BD Transduction Laboratories), rat anti-PMN (Ly6-6B2, SeroTec), rabbit anti-Muc2 (GTX100664, BIOZOL), and rabbit monoclonal anti-ADAM17 (JM10-35, Invitrogen) were used at the appropriate dilution, followed by the fluorophore-conjugated donkey secondary antibody (Jackson ImmunoResearch). AF647-conjugated wheat germ agglutinin (WGA, Vector Laboratories, FL1021) was used to visualise the mucus layer. The in situ cell death detection Kit (Roche) was used following the manufacturer’s instructions to detect TUNEL-positive cells. Slides were counterstained with DAPI (Vector Laboratories) and images were taken using a Zeiss ApoTome.2 system microscope connected to an Axiocam 506 digital camera (Zeiss). The thickness of the lamina propria and the fraction of the ADAM17+ intestinal epithelial apical surface were quantified using the ZEN 3.4 imaging software.
Neonatal intestinal epithelial stem cell organoid culture
Neonatal intestinal epithelial stem cell organoids (spheroids) were prepared according to established protocols and grown as cell monolayers39,62. Briefly, small intestinal crypts were isolated by incubation at 4 °C in PBS containing 2 mM EDTA for 5 min. from total neonatal small intestine tissue seeded in Matrigel (356231; BD Biosciences) into 48-well plates (20 μl of Matrigel per well). Matrigel was polymerised at 37 °C for 15 min and 250 μl of ENR basal culture medium (advanced DMEM/F12 medium [12634-028; Gibco] supplemented with penicillin/ streptomycin [15140-122; Gibco], 0.01 M HEPES [15630-056; Gibco], 1 × Glutamax [35050-038; Gibco], 1 × N2 [17502-048; Gibco], 1 × B27 [17504-044; Gibco], 500 mM N-acetylcysteine [A9165; Sigma-Aldrich], 50 µg/ml mouse EGF [PMG8045; Gibco], 100 µg/ml mouse noggin [250-38; PeproTech], and 10% of R-spondin conditioned medium purified from the supernatant of stably transfected HEK293T cells) was added to each well. Medium change was performed every 3 days, and organoids were passaged 1:5 after 7 days. To obtain cell monolayers, 4-day-old spherical organoids were trypsinised with TrypLE Express (12605-010; Gibco), filtered and washed by centrifugation. Cells were resuspended in ENRWY medium (ENR medium containing 50% Wnt3a conditioned medium) purified from the supernatant of stably L-Wnt-3A expressing HEK cells and 10 µM RhoK inhibitor Y-27632 (M20999; AbMole Bioscience). 200 μl of the cell suspension was added to each well of a 48-well cell culture plates followed by a 1 min centrifugation step to promote attachment to the Matrigel layer. After 16–18 h, non-adherent cells were removed, and the cells were incubated again at 37 °C for 24 h. Dead cells were removed by washing with prewarmed PBS. R-spondin-producing and Wnt3a-producing HEK293T cells were kindly provided by Calvin Kuo (Stanford University, Stanford, CA, USA) and Sina Bartfeld (Berlin Technical University, Berlin, Germany), respectively. Confluent cell monolayers were infected with S. Typhimurium at a multiplicity of infection (MOI) of 10:1 for 1 h. Monolayers were washed three times with warm PBS and supplemented with pre-warmed ENRWY media containing 100 μg/mL gentamicin (Sigma) for 1 h at 37 °C to remove extracellular bacteria. Infected monolayers were washed again three times in warm PBS and lysed. The number of intracellular bacteria was determined by serial dilution and plating on selective LB agar plates. The invasion rate was calculated as (number of intracellular bacteria/number of administered bacteria) X 100[%].
To evaluate the role of secretory autophagy for cytokine release by intestinal stem cell organoids, confluent 2D organoids were washed once with warm PBS prior to infection with S. Typhimurium, to remove dead cells. Cells were left untreated or treated with 200 nM rapamycin for 1 h. The supernatant was then removed, and the fresh ENRWY media containing 20 nM rapamycin was added for subsequent steps. Wt or ΔsopB S. Typhimurium was added to stem cell organoid cells grown to confluency at a multiplicity of infection (MOI) of 10:1. After 1 h of infection, infected monolayers were washed three times with warm PBS and supplemented with pre-warmed ENRWY media containing 100 μg/mL gentamicin (Sigma) for 1 h at 37 °C to remove extracellular bacteria. Supernatants were analysed using a cytometric bead array (Cytometric Bead Array Kit, BioLegend) according to the instructions of the manufacturer.
ADAM17 activity assay
Isolated intestinal epithelial cells were washed twice with PBS by centrifugation at 300 x g for 5 min at 4 °C. The pellets were resuspended in PBS and transferred to a black 96-well plate suitable for fluorescence measurements. The pellets were incubated at 37 °C in a humidified 5% CO2 incubator for 30, 60, 90, 120 min and 180 min in the presence of 10 µM ADAM17/TACE substrate (Sigma, Cat. Nr: 616407), with or without 10 µM ADAM17/TACE inhibitor (Sigma, GW-3333), in a total volume of 50 µl PBS. ADAM17 enzymatic activity was quantified at the indicated time points by measuring fluorescence intensity at Ex/Em = 320 nm/420 nm using a fluorescence microplate reader (SpectraMax i3, ROM v1.4 b18). At the end of the incubation period, IEC pellets were lysed using 0.1% Triton X-100 (Cayman, item: 601172) and total protein concentrations of the lysates were determined using the Bradford assay (Bio-Rad) following the manufacturer’s instructions.
m-ICcl2 co-culture experiments
m-ICcl2 cells were seeded onto polyethylene terephthalate (PET) ThinCert™ transwell inserts with a pore size of 3μm (Greiner Bio-One, Kremsmünster, Austria) and grown to a confluent monolayer of polarised epithelial cells in m-ICcl2 medium supplemented with 2% heat-inactivated FCS for 10–12 days with medium changes three times per week63. The integrity of the epithelial monolayer was assessed by monitoring the transepithelial electrical resistance (TEER). Wild-type (wt) and ΔsopB S. Typhimurium were added to the apical compartment at a multiplicity of infection (MOI) of 10:1. To promote host cell contact, plates were centrifuged at 300 x g for 5 min. After 1 h incubation at 37 °C, cell monolayers were washed with warm PBS and incubated in fresh cell culture medium supplemented with 100 μg/ml gentamicin (Sigma, Cat. No.: 1405-41-0) for 1 h to remove extracellular bacteria. After 1 h, the medium was replaced by fresh medium supplemented with 20 μg/ml gentamicin. Non-infected m-ICcl2 cells were treated similarly.
Proteomics and phosphoproteomics
m-ICcl2 cells were grown to confluency and polarised for 7 days. Cells were infected at a MOI of 10:1 for 1 h, non-infected cells served as a control. Cells were lysed in 1% Triton X-100, 150 mM NaCl, 50 mM Tris-HCl (pH 7.4), 0.5% sodium deoxycholate, and 0.1% SDS, including Roche’s complete proteinase and phosphatase inhibitors. Experiments were conducted in 4 biological replicates. For the full proteome, 30 µg protein from each replicate was used and prepared by protein clean up and enzymatic cleavage using a paramagnetic bead approach as described previously64. Briefly, the volume of protein samples was adjusted to 50 μL with 100 mM TEAB (Tetraethylammonium tetrahydroborate, Sigma-Aldrich, USA), followed by reduction with 5 μL 200 mM TCEP (Tris(2-carboxyethyl)phosphine hydrochloride, Sigma-Aldrich, USA) in 100 mM TEAB for 1 h at 55 °C. Subsequently, 5 μL 375 mM iodoacetamide (Merck KGaA, Germany) in 100 mM TEAB was added and incubated for 30 min at room temperature in the dark. 2 μL SP3 beads per sample were washed with water three times, with subsequent addition of the sample. After protein binding to the beads, the supernatant was discarded. Then, the beads were washed twice with 200 μL 70 % (v/v) ethanol, and once with 200 pure ACN. Finally, the proteins were digested with trypsin (Promega, Germany) in a ratio of 1:50 for 16 h at 37 °C. Subsequently, a peptide clean-up was conducted. Therefore, ACN was added to each sample to reach a final organic content higher than 95 % (v/v). After peptide binding to the beads, the samples were washed with pure ACN on the magnetic rack.
Peptides were eluted in two fractions, the first one with 87% acetonitrile in 10 mM ammonium formate (pH 10, Sigma Aldrich), and the second one with 2% dimethylsulfoxide (DMSO, Sigma Aldrich). Both fractions were analysed using liquid chromatography (LC) coupled to a mass spectrometer (MS). In detail, the peptides were separated on a nano-UPLC system (Ultimate 3000, Dionex, USA) with a trapping column (flow rate 5 µl/min, Acclaim PepMap 100 C18, 3 µm, nanoViper, 75 µm × 5 cm, Thermo Fisher, Germany) and an analytical column (flow rate 0.3 µl/min, Acclaim PepMap 100 C18, 3 µm, nanoViper, 75 µm × 25 cm, Thermo Fisher, Germany) using a 160 min non-linear gradient as described in ref. 64. The nano-UPLC system was coupled to the MS (QExactive HF, Thermo Scientific, USA) via a chip-based ESI source (Nanomate, Advion, USA). The only difference compared to the previously described workflow64 was that not the top 10 but the top 15 precursor ions were subjected to MS/MS analysis. The obtained raw data were processed against the UniProtKB reference proteome of Mus musculus (March, 18, 2023), using Proteome Discoverer 2.5 and the following parameters: carbamidomethylation as fixed modifications, oxidation of methionine and acetylation of the protein N-terminus as variable modifications. This workflow resulted in information on 4682 proteins.
For the phosphoproteome, 600 µg protein were used, followed by protein clean up and enzymatic cleavage using a paramagnetic bead approach as described above and previously65. Peptides were eluted after the peptide clean-up in water, resulting in one fraction. After elution, a two-step enrichment of phosphorylated peptides using the HighSelect™ TiO2 Phosphopeptide Enrichment Kit (Thermo Scientific, USA) and the High-Select™ Fe-NTA Phosphopeptide Enrichment Kit (Thermo Scientific, USA) was performed as described before65. Enriched phosphorylated peptide samples were analysed using the same LC-MS/MS system as the full proteome samples with a 160 min non-linear gradient and with adjusted MS parameters: precursors between 350 m/z and 1550 m/z were detected at a resolution of 120 K. MS1 automatic gain control (AGC) target was set to 3e6, with a maximum injection time of 150 ms. The top 15 precursors were isolated using a window of 0.7 Th, with MS2 AGC target 2e5 and a maximum injection time 150 ms. The normalised collision energy (NCE) was 34, fixed first mass 120 m/z, and MS2 resolution 60 K. A dynamic exclusion of 45 s was used. The obtained raw data were processed against the same UniProtKB reference proteome as the proteome, using Proteome Discoverer 2.5 and the following parameters: phosphorylation on serine, threonine, or tyrosine, oxidation of methionine, and acetylation of the protein N-terminus as variable modifications. This workflow resulted in information on 5242 proteins, 44225 peptide isoforms, and 15018 phosphosites.
For the identification of regulated proteins/phosphosites and enrichment analysis, the data were first filtered for proteins and phosphosites identified at least in three replicates, followed by log2-transformation and median-normalisation. The average Log2(FCs) were calculated, and regulated proteins and phosphosites were determined using the Student’s t test conducted in R Studio 3.6.1. Obtained p-values were adjusted for multiple testing, according to Benjamini & Hochberg. Proteins and sites were considered significantly regulated with FDR ≤ 0.05. Enrichment analyses were conducted with regulated proteins or regulated phosphosites (FDR ≤ 0.05) using Ingenuity Pathway Analysis (IPA, Qiagen). Enrichment p-values were calculated with the right-tailored Fisher’s exact test and adjusted for multiple testing, according to Benjamin & Hochberg. Pathways were considered significantly enriched with FDR ≤ 0.05.
Affinity enrichment of SopB-associated host proteins
Polarised and confluent cell layers of m-ICcl2 cells were infected with S. Typhimurium chromosomally carrying a triple Flag-tagged sopB construct at a multiplicity of infection (MOI) of 10:1, or an untagged wildtype strain as a background control. Plates were centrifuged at 1,200 rpm for 5 min to initiate host cell contact. After 1 h incubation at 37 °C, cell monolayers were washed with cold PBS and lysed in Pierce RIPA buffer (Thermo Scientific) supplemented with cOmpleteTM protease inhibitor tablet (Roche) and PhosSTOP (Roche). The cell lysate was harvested by centrifugation at 13,000 rpm for 20 min at 4 °C and mixed with 30 µL of washed anti-FLAG® M2 Affinity Gel (Sigma, A2220). The mixture was rotated at 4 °C for 4 h to allow binding. Unbound proteins were washed away with 0.01% PBS-Triton X-100 buffer at 5000 × g for 5 min. at 4 °C. The bound proteins were eluted using 150 µg/mL FLAG peptide (Waters) prepared in 0.05% RapiGest (Waters). The eluted proteins were resuspended in 50 mM HEPES (pH 8) containing 1% SDS, 40 mM 2-chloroacetamide, and 10 mM TCEP, then incubated at 95 °C for 5 min to facilitate reduction and alkylation. Nucleic acids were digested with Benzonase (2.8 U/Sample) at 37 °C for 30 min. Samples were processed for mass spectrometry using a modified SP3 protocol66. Proteins were digested with Trypsin and LysC at 37 °C for 14 h. Peptides were labelled using 6plex TMT (Thermo Fisher) following Zecha et al.67. A total of 6 samples (3 test samples and 3 background controls from three biologically independent experiments performed on separate days) were pooled and desalted using a Waters OASIS HLB μElution Plate. LC-MS/MS was performed on an UltiMate 3000 RSLCnano coupled to an Orbitrap Exploris 480 mass spectrometer (Thermo Fisher). Peptides were separated on a C18 analytical column (IonOpticks) over 160 min (1–40% B, 0.25 μl/min). MS1 spectra (400–1,600 m/z) were acquired at 120,000 resolution; the top N precursors (charge 2–5, cycle time 3 s) were fragmented (NCE 32) and analysed at 15,000 resolution.
Raw files were converted to mzML (MSConvert v3.0.23129) format prior to database searching. Peptide and protein identification was performed using the TMT10 workflow implemented in MSFragger (v3.8) through FragPipe (v20.0). Spectra were searched against the UniProt Mus musculus reference proteome (UP000000589, downloaded April 8, 2025) and Salmonella enterica serovar Typhimurium strain 14028S proteome (UP000002695, downloaded April 8, 2025), supplemented with common contaminant proteins and reverse decoy sequences. Searches were performed using strict trypsin specificity, allowing up to two missed cleavages and a minimum peptide length of seven amino acids. Precursor and fragment mass tolerances were set to − 20 to + 20 ppm and 20 ppm, respectively. Carbamidomethylation of cysteine and TMT labelling of lysine residues were specified as fixed modifications. Oxidation of methionine (maximum three occurrences per peptide), protein N-terminal acetylation, and TMT labelling of peptide N-termini were included as variable modifications. Peptide-spectrum matches, peptides, and proteins were filtered at a 1% false discovery rate. Proteins identified by at least one unique peptide were retained for downstream analysis.
Downstream analyses, including normalisation (VSN) and differential expression, were conducted in R (RStudio v2021.09.2) using limma (v3.54.2), vsn (v3.66.0), and the tidyverse suite (dplyr v1.1.1, ggplot2 v3.4.2). Differential abundance was assessed using linear modelling with empirical Bayes moderation implemented in limma. Statistical significance was determined using two-sided moderated t tests, and p-values were adjusted for multiple testing using the method of Benjamini–Hochberg.
Immunoprecipitation
Affinity purification of SopB-interacting proteins was performed as described above. For immunoblotting of ADAM17, protein eluted from the anti-FLAG® M2 Affinity Gel, total m-ICcl2 cell lysate, and S. Typhimurium sopB::3xFLAG lysate were incubated at 95 °C for 10 min with 4 x SDS loading dye, loaded on a 10% SDS-PAGE, and run at 120 V for 60 min. Proteins were transferred to a nitrocellulose membrane at 250 mA for 90 min. The membrane was blocked with 5% milk-TBS-T for 1 h at room temperature and incubated with anti-FLAG® M2 antibody diluted 1:2000 (F1804, Sigma) or anti-ADAM17 antibody diluted 1:2000 (JM10-35, Invitrogen) overnight at 4 °C. After washing three times with TBS-T, the membrane was incubated with the secondary antibody conjugated to HRP for 1 h at room temperature in 5% milk-TBS-T. Finally, the washed membrane was incubated with SuperSignal West Femto Maximum Sensitivity Substrate (Thermo Scientific) and scanned using a C-DiGit Blot Scanner (LICORbio).
Network analysis
To identify potential interactions between SopB affinity enriched host proteins and the ADAM17 complex, consisting of ADAM17, iRhom1/RHBDF1, iRhom2/RHBDF2, and FRMD8, the curated interactomics database BioGRID was queried. To infer candidate–complex connectivity via direct interactions and shared interactors, we performed high-throughput AlphaFold-Multimer (AFM) prediction and interaction confidence scoring68,69. Protein sequences were retrieved via the UniProt API70 using custom Python scripts (Python v3.11.0). Proteins larger than 650 residues were segmented into prediction units using AlphaFold DB–derived pLDDT and PAE profiles to place boundaries in low-confidence regions between structural domains. All pairwise combinations were subjected to AFM prediction71 using MSAs generated with MMseqs272. For each protein pair, AFM produced five models, which were ranked using the actifpTM score73. A custom pipeline extracted Cα coordinates from both chains and defined interface residue pairs as positions within 10 Å. For each model, the mean interface PAE (iPAE) across all interface residues was computed and transformed to a normalised score by mapping iPAE ≤ 5 Å to 1, iPAE > 15 Å to 0, and linearly scaling intermediate values (5–15 Å). The model interaction score was calculated as the arithmetic mean of actifpTM and iPAE. Pairwise confidence was reported as the mean across the five AFM models (reflecting consensus across AFM weight sets), and high-confidence PPIs for network inclusion were defined as mean interaction confidence > 0.75. In addition, connectivity was augmented using a directed kinase-to-substrate reference database assembled by integrating curated resources: OmniPath74, HPRD75, PhosphoSitePlus76, Phospho.ELM77, Reactome78 and DEPOP79. Network construction and visualisation were performed with custom Python scripts; scripts are available upon reasonable request or, after publication, via https://github.com/Clusterbiology.
Statistics
Measurements were taken from distinct samples. Survival was analysed by log-rank (Mantel -Cox) test. The non-parametric Mann-Whitney test was used for the comparative analysis of two groups. The Kruskal-Wallis, combined with Dunn’s multiple comparison test, was employed for the statistical analysis of more than two groups. If data were normally distributed as confirmed using the Shapiro-Wilk test, the student’s t test (two groups) or the one-way ANOVA test with Tukey’s posttest (more than two groups) was used. Two-way ANOVA with Sidak or Tukey’s multiple comparison test was employed for the statistical analysis of two groups that have been split on two independent variables. Graphpad Prism Software 10 was used for statistical evaluation. Differences were considered significant at p < 0.05, *; p < 0.01, **; p < 0.001, ***; and p < 0.0001, ****.
Reporting summary
Further information on research design is available in the Nature Portfolio Reporting Summary linked to this article.