![[Düzenle]](?edit=/home/u514654129/domains/awesamohealth.com/public_html/wp-content/themes/pixwell/screenshot.png)
![[Yeniden Adlandır]](?rename=/home/u514654129/domains/awesamohealth.com/public_html/wp-content/themes/pixwell/screenshot.png)
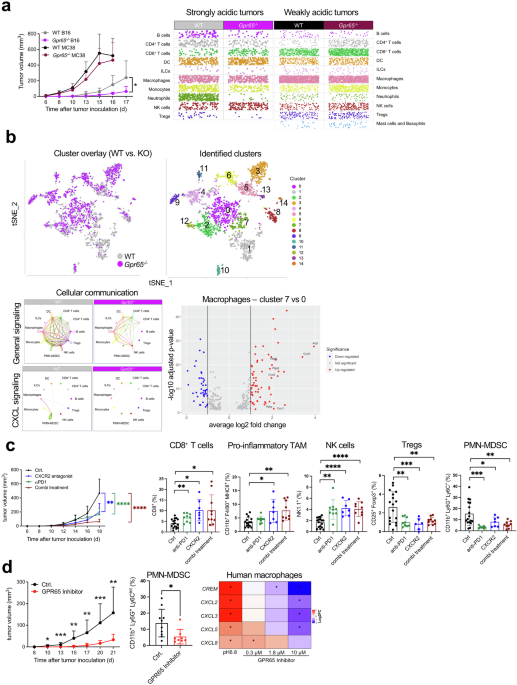
a 2 × 10⁵ strongly acidic tumor cells (B16F10) were inoculated into the right flank of Gpr65-deficient (n = 9, purple) and WT littermate control (n ≥ 7, grey) mice. Tumor growth curves are shown. Results are shown as mean + s.d., p-value d15 = 0.0416, p-value d16 = 0.0475, two-sided unpaired t-test with Welch’s correction. CD45+ TILs were isolated from strongly acidic tumors of Gpr65-deficient and respective littermate control mice (n = 4 per group) at day 17 after tumor cell inoculation and scRNA-seq was performed. Distribution of the individual cells of each predicted cell population is shown as a scatter plot. 1 × 10⁶ weakly acidic tumor cells (MC38) were inoculated into the right flank of Gpr65-deficient (n = 9, dark red) and WT littermate control (n ≥ 7, black) mice. Tumor growth curves are shown. On day 16 after tumor cell inoculation, CD45+ TILs were isolated and scRNA-seq was performed (WT: n = 2, Gpr65-/-: n = 3). Distribution of the individual cells of each predicted cell population is shown as a scatter plot. b Single cell data from (a) are represented as t-SNE plots as overlay for both genotypes (left panel) or separated by computational calculated clusters (right panel). Cell-cell communication of individual cell clusters was analyzed by CellChat. General (upper panels) and CXCL-dependent (lower panels) communication plots of Gpr65-deficient mice and respective littermate controls are shown. Gene expression of Gpr65-competent macrophage cluster 0 and cluster 7 was compared. Data are represented as a Volcano plot. c B16F10-bearing mice were treated either with an antibody against PD1 (green), an antagonist against CXCR2 (blue) or as a combination (Combi treatment, dark red) therapy with both (n = 10 per group). The control group (n = 17, black) received the respective isotype control and solvent. Tumor cell inoculation, tumor measurement, tumor volume calculation, antibody and antagonist injection strategy were performed as described in the Supplements. Data of two independent experiments were pooled. Tumor growth curves are represented. Results are shown as mean + s.d., p-value d18 Ctrl. vs. anti-PD1 < 0.0001, d18 Ctrl. vs. CXCR2 antagonist = 0.0034, d18 Ctrl. vs. Combi treatment < 0.0001. Statistical analyses were performed by a two-sided unpaired t-test with Welch’s correction. On day 18, percentages of tumor-infiltrating CD8+ T cells, pro-inflammatory TAM, NK cells, Tregs and PMN-MDSC were analyzed using flow cytometry. Data are represented as mean + s.d., individual mice are plotted as dots. Statistical analyses were calculated using either an unpaired t-test or by a Mann-Whitney test, contingent upon the data set’s distribution. In instances where the variance was significant, Welch’s correction was additionally applied. Statistical significance was determined by conducting single comparisons between each treatment group and the control group. P-values CD8+ T cells Ctrl vs. anti-PD1 = 0.0042, CD8+ T cells Ctrl vs. CXCR2 = 0.0149, CD8+ T cells Ctrl vs. combi= 0.0268, pro-inflammatory TAM Ctrl vs. CXCR2 = 0.0476, pro-inflammatory TAM Ctrl vs. combi= 0.0069, PMN-MDSC Ctrl vs. anti-PD1 = 0.0003, PMN-MDSC Ctrl vs. CXCR2 = 0.0266, PMN-MDSC Ctrl vs. combi= 0.0021, NK cells Ctrl vs. anti-PD1 = 0.0035, NK cells Ctrl vs. CXCR2 < 0.0001, NK cells Ctrl vs. combi <0.0001, Tregs Ctrl vs. anti-PD1 = 0.0012, Tregs Ctrl vs. CXCR2 = 0.0009, Tregs Ctrl vs. combi= 0.0021. d B16F10 melanoma cells (strongly acidic tumor) were inoculated s.c. into C57BL/6 J (n = 10 per group). Daily treatment with the GPR65 inhibitor PTT-3213 (100 mg/kg, red) or with the corresponding vehicle control (black) began one day after tumor cell inoculation. Compounds were administered by oral gavage. Two hours before administration of PTT-3213 or the vehicle, mice received the cytochrome P450 inhibitor 1-ABT (50 mg/kg) by oral gavage. Tumor growth was monitored over time using calipers, and tumor volume was calculated according to the formula width2 x length x 0.5. Growth curves are shown as mean ± s.d., statistical significance was calculated using either an unpaired t-test or by a Mann-Whitney test, contingent upon the data set’s distribution. In instances where the variance was significant, Welch’s correction was additionally applied. P-value d10 = 0.0108, d13 = 0.0007, d15 = 0.0013, d17 = 0.0037, d20 = 0.0008, d21 = 0.0092. Outliers were identified by Grubbs’ test. At d21, tumors were dissected and CD45+ TILs were isolated and tumor-infiltrating PMN-MDSC were analyzed by flow cytometry. Data are shown as mean ± s.d., individual values are displayed as dots. Statistical significance was calculated using Mann-Whitney test, p-value = 0.0205. Human monocyte-derived macrophages (hMDM) differentiated from PBMC with M-CSF were cultured under acidic conditions for 4 h. Log2 fold change of gene expression when hMDM were cultured under acidic conditions and in the presence of different concentrations of the GPR65 small molecule inhibitor PTT-3213 (reference to culture under non-acidic conditions). Data are shown as a heatmap. Statistical analysis was performed as described in the supplements. Data were generated using the myeloid nCounter panel.
Solid tumors exploit proton-sensing GPR65 for orchestration of an immunosuppressive tumor microenvironment