
Tumor cells outcompete NK cells for BCAA, with BCKDK as a key regulator
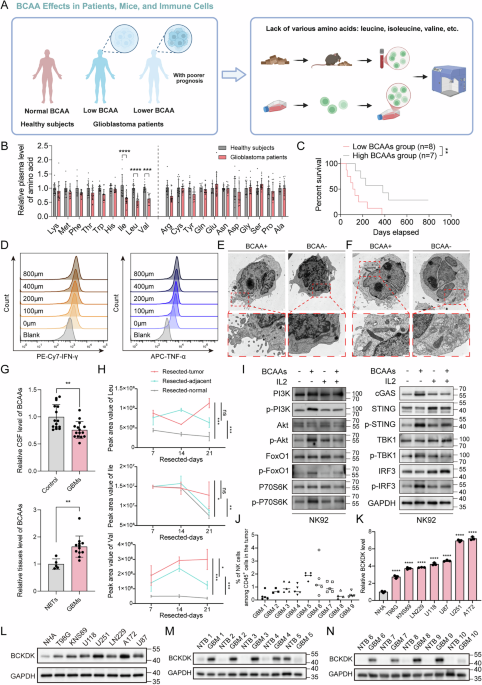
Nutrient competition between tumor and immune cells is a hallmark of the TME, but the role of amino acid metabolism in GBM immune evasion remains unclear. Clinical data revealed reduced plasma levels of BCAA in GBM patients, correlating with poor prognosis (Fig. 1A–C). Using in vivo and in vitro models, we found that BCAA deprivation impaired NK cell survival and function, with isoleucine, leucine, and valine loss markedly reducing NK cell cytotoxicity and cytokine production (Fig. S1A–H).

A Workflow for investigating the influence of BCAA deficiency on NK cell activity in GBM patients, mouse models, and in vitro cultures. B Plasma BCAA concentrations in GBM patients (n = 15) and healthy controls (n = 14). All data are mean ± SEM. P values were calculated using unpaired two-tailed Student’s t test. C Correlation between plasma BCAA levels and patient survival. D Rescue of NK cell IFN-γ and TNF-α production by BCAA supplementation following treatment with conditioned media from GBM cells. TEM presenting the immunological synapse (E) and mitochondrial morphology (F) of NK cells cultured in BCAA-sufficient and -deficient conditions, scale bars: 2 μm (overview), 500 nm (boxed area). G BCAA levels in CSF (n = 15 vs. 15) and tumor tissues (n = 12 vs. 5) from GBM patients and healthy controls. All data are mean ± SEM. P values were calculated using an unpaired two-tailed Student’s t test. H BCAA concentrations in tumor, peritumoral, and normal brain tissues from orthotopic GBM-bearing mice at different time points (n = 3 mice per group). I WB analysis of PI3K/Akt and cGAS-STING pathway activity in NK cells under BCAA-sufficient and -deficient conditions. J Flow cytometric analysis of NK cell infiltration in GBM tissues. K, L WB analysis of BCKDK protein level in GBM cell lines. M, N BCKDK protein levels in GBM tissues (n = 10) and normal-appearing brain tissue beyond the tumor (NTB) (n = 10).
Exposure of NK cells to GBM-conditioned media suppressed effector function and viability, which could be rescued by BCAA supplementation (Figs. 1D and S1I, J). Transmission electron microscopy (TEM) showed that BCAA deficiency also altered NK cell membrane topology and mitochondrial integrity, leading to impaired immune synapse formation and enhanced mitophagy (Figs. 1E, F and S1M). In addition, NK cells cultured in BCAA-rich conditions formed tight junctions and synapses with GBM cells, whereas BCAA-depleted NK cells failed to do so (Fig. S1L). Metabolomic profiling revealed elevated BCAA levels in tumor tissues but reduced levels in cerebrospinal fluid (CSF) and adjacent brain regions of both human and mouse GBM (Fig. 1G, H). Intratumoral BCAA abundance negatively correlated with NK and CD8⁺ T cell infiltration (Figs. 1J and S1K, N), and BCAA deprivation suppressed PI3K/Akt and cGAS–STING signaling in NK cells (Fig. 1I). Given reports that tumor-derived branched-chain ketoacids (BCKAs) can modulate immune cells, we treated NK cells with increasing BCKA concentrations and assessed effector cytokines by flow cytometry (Fig. S1O–R). Low-dose BCKAs modestly increased granzyme B, perforin, and TNF-α, whereas higher BCKA levels progressively suppressed these markers and significantly reduced IFN-γ. Notably, BCKA-induced impairment was consistently weaker than that caused by BCAA deprivation, supporting BCAA depletion as the dominant driver of NK dysfunction in our models.
To probe how BCAA deprivation dampens PI3K/Akt and cGAS–STING signaling, we performed untargeted metabolomics in NK cells cultured under BCAA-negative versus BCAA-positive conditions (n = 5 per group; 1,554 metabolites detected) (Table S1 and Fig. S2A–F). PCA showed robust group separation, indicating global metabolic reprogramming (Fig. S2A). Differential analysis (VIP/FC/P-value) identified 577 altered metabolites (389 increased, 188 decreased) (Fig. S2B). BCAA deprivation led to accumulation of purine catabolites (e.g., xanthine and uric acid) alongside depletion of nucleosides/nucleotides and related metabolites, consistent with suppressed nucleotide metabolism (Fig. S2C). In parallel, multiple organic acids and derivatives (e.g., proline, citrate, and cysteine) were reduced, indicating compromised metabolic fitness and biosynthetic support (Fig. S2D). Pathway-level analysis further highlighted coordinated downregulation of nucleotide metabolism and amino acid biosynthesis programs, with enrichment of nutrient-sensing pathways linked to mTOR/FoxO (Fig. S2F and Supplementary Data 1). Collectively, these metabolomic features align with impaired nutrient/anabolic signaling (PI3K/Akt/mTOR axis) and weakened innate immune activation capacity, providing mechanistic support for the reduced PI3K/Akt and cGAS–STING outputs observed under BCAA deprivation.
Bioinformatic analysis of TCGA data showed higher expression of BCKDK, a key BCAA metabolic enzyme, in GBM with low immune cell infiltration (Fig. S2G, H). Western blot (WB) analysis revealed that BCKDK was upregulated in GBM cell lines and patient tumors, while its mRNA levels remained unchanged (Fig. 1K–N and Fig. S3A, B). Immunohistochemistry (IHC) and multiplex immunofluorescence (IF) confirmed a negative association between BCKDK expression and immune cell infiltration, potentially linked to BCAA levels in the TME. (Fig. S3C–K), and BCKDK knockdown reduced intracellular BCAA levels in GBM cells (Fig. S3L). These findings suggest that BCKDK protein abundance, rather than transcriptional activity, regulates BCAA availability and immune exclusion in GBM, prompting further investigation into its post-translational control.
BCKDK phosphorylates IGF2BP3 to mediate the expression of SLC7A5/SLC7A8
To illustrate the regulatory function of BCKDK in tumor BCAA metabolism, we either knocked down or pharmacologically inhibited BCKDK and examined transcriptional changes in key genes within the BCAA metabolic pathway. Notably, the mRNA levels of the BCAA transporters SLC7A5 and SLC7A8, located at the GBM cell membrane, were significantly reduced following BCKDK suppression (Fig. 2A, B). Consistently, both IF and WB analyses confirmed a marked decrease in SLC7A5/SLC7A8 protein expression upon BCKDK inhibition (Figs. 2C, D and S4A–C). Previous studies have reported that the RNA-binding protein IGF2BP3 stabilizes SLC7A5 mRNA [25]. Based on this, we hypothesized that BCKDK, IGF2BP3, and SLC7A5/SLC7A8 mRNAs may assemble into a functional protein-RNA ternary complex that facilitates BCAA uptake in GBM. Mass spectrometry (MS) analysis identified IGF2BP3 as a potential BCKDK-interacting partner (Table S2), and reciprocal co-immunoprecipitation (co-IP) assays validated their physical association (Fig. S4D).

RT-PCR analysis showing reduced SLC7A5 and SLC7A8 mRNA levels after BCKDK inhibition (A) or knockdown (B) in GBM cells. All data are mean ± SEM. P values were calculated using an unpaired two-tailed Student’s t test. C, D IF showing decreased SLC7A5/SLC7A8 protein levels following BCKDK inhibition or knockdown in A172 cells, scale bars: 100 μm. E, F IP and WB showing BCKDK-dependent threonine phosphorylation of IGF2BP3. G, H WB and RT-qPCR showing reduced SLC7A5/SLC7A8 expression following IGF2BP3 knockdown in A172 and U251 cells. I A172 cells were transfected stably with scramble shRNA and IGF2BP3 shRNA, and were treated with actinomycin D (20 μg/mL) for the indicated time, and SLC7A5 and SLC7A8 mRNA levels were analyzed.
Given the intrinsic kinase activity of BCKDK, we treated GBM cells with the selective inhibitor BT2 and observed a time-dependent decrease in threonine phosphorylation after 8 h, while total IGF2BP3 protein levels remained unchanged (Fig. S4E). IP of IGF2BP3, followed by phospho-threonine detection, further confirmed a BCKDK-dependent increase in IGF2BP3 phosphorylation (Fig. 2E, F). Consistent with this regulatory relationship, knockdown of IGF2BP3 in both A172 and U251 cells led to marked downregulation of SLC7A5 and SLC7A8 expression (Fig. 2G, H). To validate the existence of a BCKDK-IGF2BP3-mRNA complex, RNA immunoprecipitation (RIP) was performed. Knockdown of either BCKDK or IGF2BP3 reduced the mRNA binding capacity of IGF2BP3 (Fig. S4F, G). To determine whether IGF2BP3 regulates SLC7A5/SLC7A8 expression by influencing mRNA stability, we assessed mRNA half-lives in actinomycin D-treated GBM cells. IGF2BP3 knockdown significantly decreased the stability of both transcripts in A172 and U251 cells (Fig. 2I and Fig. S4H).
To identify the BCKDK-responsive phospho-site on IGF2BP3, we expressed Flag-IGF2BP3 in HEK293T cells, treated cells with BT2 or DMSO, and performed LC-MS/MS on immunoprecipitated IGF2BP3. Phosphorylation at Thr457 was markedly reduced by BT2, nominating Thr457 as a major BCKDK-sensitive threonine residue (Table S3). We then generated phospho-deficient T457A and phospho-mimetic T457D IGF2BP3 mutants and expressed them in PSMD14-silenced A172 cells. Compared with WT IGF2BP3, T457A failed to sustain SLC7A5/SLC7A8 protein levels, whereas T457D largely maintained their expression under reduced BCKDK activity (Fig. S5A). Consistently, mRNA stability assays showed that the WT-mediated stabilization of SLC7A5/SLC7A8 transcripts was significantly attenuated by T457A but preserved by T457D, indicating that Thr457 phosphorylation is required for BCKDK-enhanced IGF2BP3-dependent mRNA stabilization (Fig. S5B, C).
In summary, BCKDK promotes BCAA uptake in GBM cells by forming a ternary complex with IGF2BP3 and SLC7A5/SLC7A8 mRNAs, which enhances mRNA stability and represents a pivotal mechanism of post-transcriptional control in tumor metabolic adaptation.
PSMD14 interacts with and stabilizes the BCKDK protein
To identify deubiquitinating enzymes (DUBs) regulating BCKDK, we performed a DUB siRNA library screen followed by WB validation, and identified five DUBs (PSMD14, USP11, USP19, USP2, USP20) whose knockdown significantly reduced BCKDK protein levels (>40% knockdown efficiency) (Figs. 3A–C and S6A, B). In addition, IP assays demonstrated that only PSMD14 directly interacts with BCKDK (Fig. 3F, G). MS analysis in A172 and U251 cells identified BCKDK-binding proteins, with pathway enrichment highlighting “negative regulation of innate immune response” and “ubiquitin ligase inhibitor activity” (Table S2, 4). Subsequent cross-referencing of siRNA and IP/MS results pinpointed PSMD14 as a specific BCKDK-interacting DUB. PSMD14 showed a high expression in GBM cell lines and tissues, and BCKDK protein levels positively correlated with PSMD14 expression (Figs. 3D, E and S6C). The interaction between PSMD14 and BCKDK was validated by endogenous co-IP and GST pull-down assays (Fig. S6I–K). Exogenous co-IP in HEK293T cells further confirmed reciprocal binding between Flag-BCKDK and Myc-PSMD14 (Fig. S6L). WB analysis revealed that BCKDK was also upregulated in GBM patient tumors (Fig. 3H, I). Further molecular mapping revealed that the N-terminal D1 region (residues 1–103) of BCKDK interacts with the N-terminal MPN domain (residues 1–166) of PSMD14, which is associated with the ubiquitin-proteasome system (Fig. 3J–L).

A Identification of BCKDK-regulating DUBs by intersecting DUB siRNA screen with BCKDK IP/MS interactome. B, C PSMD14, USP11, USP19, USP2, and USP20 reduce BCKDK levels upon siRNA knockdown. All data are mean ± SEM. P values were calculated using one-way ANOVA for Dunnett’s multiple-comparisons test. D Western blot analysis of PSMD14 protein level in GBM cell lines. E BCKDK expression correlates with PSMD14 protein levels in GBM cell lines. F, G Co-IP in HEK293T cells confirms PSMD14–BCKDK interaction. H, I PSMD14 protein levels in 10 paired GBM vs. adjacent normal tissues. J Design of PSMD14 and BCKDK truncations. K, L BCKDK N-terminal region binds the MPN domain of PSMD14. M, N PSMD14 knockdown reduces, and overexpression increases, BCKDK levels in A172 and U251 cells. O, P PSMD14 modulates extracellular BCAA levels in A172 and U251 cells. All data are mean ± SEM. P values were calculated using one-way ANOVA for Dunnett’s multiple-comparisons test. Q, R CHX chase assay shows PSMD14 knockdown accelerates BCKDK degradation in U251 cells. S, T OPA (10 µM) treatment reduces BCKDK protein levels over time.
To evaluate the impact of PSMD14 on BCKDK stability, we observed that PSMD14 overexpression elevated BCKDK protein levels, while shRNA-mediated knockdown reduced BCKDK protein levels in GBM cells (Figs. 3M, N and S6F), with no effect on BCKDK mRNA expression (Fig. S6D, E). Both intracellular and extracellular BCAA levels were regulated by PSMD14 in A172 and U251 cells (Figs. 3O, P and S6G, H). Overexpression of wild-type PSMD14 extended the half-life of BCKDK (Fig. S6M), whereas PSMD14 knockdown (Fig. 3Q, R) or OPA inhibition (Fig. 3S, T) reduced BCKDK half-life and protein levels. IF staining revealed strong co-localization of endogenous PSMD14 and BCKDK in A172 and U251 cells (Fig. S6N, O).
To further elucidate the molecular mechanisms by which PSMD14 regulates BCAA metabolic reprogramming, WB analysis demonstrated that PSMD14 regulates SLC7A5 and SLC7A8 expression in A172 and U251 cells (Fig. S7A). Notably, PSMD14 expression was significantly reduced in IGF2BP3-knockdown cells (Fig. S7B, C), implicating a PSMD14–BCKDK–IGF2BP3 positive feedback circuit that facilitates GBM-driven BCAA acquisition and aggravates the development of an immunosuppressive TME. RNA pull-down assays further showed that a PSMD14-specific probe, but not a control, enriched IGF2BP3 protein in U251 cells (Fig. S7D, E). Consistently, anti-IGF2BP3 IP demonstrated a significant decrease in threonine phosphorylation upon PSMD14 knockdown or pharmacological inhibition, which was rescued by BCKDK overexpression (Fig. S7F, G). To directly map the PSMD14 mRNA–binding region within IGF2BP3, we generated a series of Flag- IGF2BP3 truncation constructs spanning its major RNA-binding modules (two RRM motifs and four KH domains) (Fig. S7H). RIP-qPCR in A172 cells showed that both the N- and C-terminal fragments of IGF2BP3 were capable of associating with PSMD14 mRNA, with the N-terminal truncation exhibiting the strongest enrichment (Fig. S7I). Additionally, knockdown of BCKDK or IGF2BP3 in U251 cells diminished the association of PSMD14 mRNA with IGF2BP3 (Fig. S7J), and actinomycin D chase assays confirmed a shortened half-life of PSMD14 mRNA in IGF2BP3-knockdown cells (Fig. S7K, L). Collectively, these results support a positive feedback circuit in which PSMD14 stabilizes BCKDK, BCKDK promotes IGF2BP3 phosphorylation, and activated IGF2BP3 further stabilizes PSMD14 in GBM cells.
PSMD14 deubiquitinates and overexpresses BCKDK
BCKDK proteasomal degradation was reported in neurodevelopmental disorders [26]. prompting us to investigate whether PSMD14 modulates this process in GBM cells. WB analysis illustrated that BCKDK protein levels were markedly elevated in a time-dependent manner following MG132 treatment (Fig. S8A, B), and the proteasome inhibitor MG132 fully rescued BCKDK from cycloheximide (CHX)-induced degradation (Fig. S8C), confirming that BCKDK is degraded via the proteasome pathway in GBM. Notably, the exogenous expression of PSMD14 suppressed BCKDK ubiquitination in HEK293T cells (Fig. 4A), whereas either OPA or PSMD14 knockdown significantly increased BCKDK ubiquitination in A172 and U251 cells (Figs. 4B, C and S8D, E). These findings demonstrate that PSMD14 antagonizes BCKDK ubiquitination and preserves its stability in GBM cells.

A HEK293T cells co-expressing Flag-BCKDK, HA-ubiquitin, and Myc-PSMD14 were treated with MG132 (10 μM, 6 h); BCKDK polyubiquitination assessed by Flag-IP. B, C U251 cells treated with OPA (10 μM, 24 h) or stably expressing PSMD14 shRNA were exposed to MG132 and subjected to BCKDK-IP to assess ubiquitination. D HEK293T cells co-expressing Flag-BCKDK, Myc-PSMD14, and wild-type or mutant HA-ubiquitin were analyzed for BCKDK ubiquitination after MG132 treatment. E PSMD14 catalytic mutants (H113Q, H115Q, C120S) reduce deubiquitination of BCKDK in HEK293T cells. F Ubiquitination of BCKDK K48R and K184R mutants assessed in HEK293FT cells co-expressing PSMD14 and HA-ubiquitin. G TRIM21 wild-type and LD mutant co-expression in HEK293T cells analyzed for effect on BCKDK ubiquitination. H TRIM21 knockdown in U251 cells decreases BCKDK ubiquitination following MG132 treatment.
We next characterized the specific polyubiquitin linkages of BCKDK regulated by PSMD14. HEK293T cells were co-transfected with Flag-BCKDK, Myc-PSMD14, and various HA-tagged ubiquitin constructs (WT, K11, K27, K29, K33, K48, and K63). IP followed by WB revealed that exogenous PSMD14 overexpression markedly reduced WT and K48-linked BCKDK ubiquitination (Fig. 4D). Given that K48-linked polyubiquitination primarily mediates proteasomal degradation, we further showed that PSMD14 knockdown or OPA treatment increased endogenous K48-linked BCKDK ubiquitination in U251 cells (Fig. S8F). Notably, PSMD14 mutants lacking JAMM domain catalytic residues (H113Q, H115Q, C120S) retained BCKDK binding but failed to decrease BCKDK ubiquitination or enhance its stability [27, 28]. highlighting the requirement for PSMD14 deubiquitinase activity in BCKDK regulation (Fig. 4E). Additionally, consistent with reports that BCKDK is ubiquitinated at K48 and K184 [29]. PSMD14 could not reduce ubiquitination of BCKDK K48R and K184R mutants (Fig. 4F). To further substantiate the PSMD14 dependence of OPA-associated phenotypes, we additionally employed Capzimin (CZM), a recently developed PSMD14-selective small-molecule inhibitor, as an orthogonal pharmacological comparator [30,31,32]. In both A172 and U251 cells, PSMD14 knockdown or treatment with either OPA or CZM comparably increased K48-linked ubiquitination of BCKDK, consistent with compromised PSMD14 deubiquitinase activity. Notably, in PSMD14-silenced cells, neither OPA nor CZM further enhanced BCKDK K48-linked ubiquitination, indicating that both inhibitors act through PSMD14 (Fig. S9A, B). Given the extensive validation and widespread use of OPA as a PSMD14 inhibitor, we therefore selected OPA as the primary pharmacological tool for subsequent experiments.
MS considered TRIM21 as an E3 ubiquitin ligase strongly interacting with BCKDK (Table S2). This interaction was validated by silver staining and both exogenous and endogenous co-IP (Fig. S8G–I). Overexpression of TRIM21 in A172 and U251 cells reduced BCKDK protein levels without altering BCKDK mRNA (Fig. S8J). Inhibition experiments showed that the reversion of TRIM21-mediated BCKDK degradation was conducted by the proteasome inhibitor MG132, but not by the lysosomal inhibitor CQ (chloroquine) (Fig. S8K), indicating that TRIM21 targets BCKDK for proteasomal degradation. TRIM21 overexpression markedly increased BCKDK ubiquitination, whereas the TRIM21 LD (ligase-dead) mutant had no effect (Fig. 4G). Conversely, TRIM21 knockdown abolished BCKDK ubiquitination following MG132 treatment (Figs. 4H and S8L). Importantly, PSMD14 overexpression rescued BCKDK protein levels in TRIM21-overexpressing cells, while catalytically inactive PSMD14 mutants failed to do so (Fig. S8M). These results demonstrate that PSMD14 protects BCKDK from TRIM21-mediated ubiquitination and proteasomal degradation.
PSMD14 triggers BCKDK-mediated immune suppression in vitro
PSMD14 regulates BCKDK post-translationally; thus, we hypothesized that dysregulated PSMD14 expression could modulate BCAA metabolism and thereby affect immunosuppression. To assess whether PSMD14/BCKDK-dependent BCAA metabolism contributes to NK cell inhibition, we purified NK cells from murine spleens and performed co-culture proliferation assays (Fig. S10A). Supernatants from PSMD14-knockdown tumor cells significantly enhanced NK cell proliferation, whereas BCKDK overexpression reversed this effect. Supplementation with BCAA robustly restored NK cell proliferation, regardless of PSMD14 or BCKDK status (Fig. S10B). Furthermore, dose-response analyses revealed that NK cells exhibited greater sensitivity to BCAA deprivation than A172 and U251 cells, as demonstrated by their respective EC50 values (Fig. S10C–E).
To investigate the effects of the PSMD14/BCKDK axis on CAR-NK cytotoxicity, we generated EGFRvIII. CAR-GFP-NK92 cells with high transduction efficiency for immune killing assays (Fig. S10F). Direct-contact co-culture assays demonstrated that CAR-NK cells exhibited increased cytotoxicity against PSMD14-knockdown A172 and U251 cells across multiple E/T (effector-to-target) ratios (Figs. 5A, B and S10G). This enhancement was rescued by BCKDK overexpression in PSMD14-knockdown A172 and U251 cells (Fig. 5D, E). To further assess the influence of TME BCAA availability, we compared immune killing efficiency in co-cultures with or without BCAA supplementation. BCAA depletion impaired CAR-NK cytotoxicity, which was restored by exogenous BCAA addition (Figs. 5C, F and S11A–D). Furthermore, supernatant from PSMD14-knockdown A172 and U251 cells reduced CAR-NK apoptosis (Fig. 5H).

A, B CAR-NK cytotoxicity against PSMD14-knockdown A172 and U251 cells at different E:T ratios. All data are mean ± SEM. P values were calculated using two-way ANOVA for Dunnett’s multiple-comparisons test. C Assessment of the effects of BCAA supplementation or deprivation on the viability of A172 and U251 cells. All data are mean ± SEM. P values were calculated using two-way ANOVA for Dunnett’s multiple-comparisons test. D, E Effect of BCKDK overexpression on CAR-NK cytotoxicity in PSMD14-knockdown GBM cells. All data are mean ± SEM. P values were calculated using one-way ANOVA for Dunnett’s multiple-comparisons test. F BCAA supplementation in co-culture and its impact on CAR-NK cytotoxicity. All data are mean ± SEM. P values were calculated using two-way ANOVA for Dunnett’s multiple-comparisons test. G Differential fluorescent labeling (CFSE/CTV) of knockdown and control A172 cells, followed by co-culture with CAR-NK cells to evaluate target-specific cytotoxicity. H Assessment of CAR-NK apoptosis following treatment with supernatants from PSMD14-knockdown A172 and U251 cells. All data are mean ± SEM. P values were calculated using two-way ANOVA for Dunnett’s multiple-comparisons test. I Quantification of the killing efficiency of CAR-NK cells toward CFSE/CTV-labeled knockdown and control tumor cells. All data are mean ± SEM. P values were calculated using unpaired two-tailed Student’s t test. J, K Crystal violet staining analysis of PSMD14-knockdown A172 and U251 cells’ sensitivity to CAR-NK killing at varying E:T ratios. L Transwell migration assay measuring CAR-NK infiltration toward PSMD14-knockdown U251 cells, scale bars: 100 μm.
To determine whether the effect of PSMD14 on CAR-NK cytotoxicity was mediated by altered BCAA metabolism or changes in tumor immunogenicity, we differentially labeled PSMD14-knockdown, shPSMD14/BCKDK (rescue), and control U251 cells with CFSE or CTV and co-cultured them with CAR-NK cells at a 1:1 ratio. No significant variation was detected in the relative susceptibility of knockdown versus control tumor cells to CAR-NK-mediated killing within the same microenvironment, with overall cytotoxicity increasing as the proportion of PSMD14 knockdown U251 cells increased, and this effect was restored by BCKDK overexpression (Figs. 5G–I and S11E, F). Crystal violet staining further demonstrated that immune killing efficiency was enhanced with higher CAR-NK cell ratios, and PSMD14-knockdown tumor cells exhibited increased sensitivity to CAR-NK-mediated lysis (Fig. 5J, K); this effect was reversed by BCKDK overexpression (Fig. S11H, I). In vitro transwell assays revealed that PSMD14-knockdown GBM cells significantly promoted CAR-NK migration and infiltration, peaking at day 2 (Figs. 5L and S11G), while BCKDK overexpression attenuated this effect (Fig. S11J, K).
To assess the potential off-target cytotoxicity of PSMD14 inhibition on normal CNS cells, we treated primary GBM cultures (IL60-11 and 140-55) and normal brain-derived cells, including normal human astrocytes (NHA), microglia (HMC3), and oligodendrocyte precursor-like cells (MO3.13), with OPA at the same concentrations used in tumor cell assays. Flow-cytometry-based apoptosis profiling following OPA or CAR-NK challenge showed that both interventions induced markedly higher apoptosis in GBM cells than in normal CNS cells (Fig. S12A–E). Consistently, dose-escalation OPA treatment further revealed robust, concentration-dependent activation of canonical apoptotic signaling in GBM cells by immunoblotting, whereas activation of these pathways remained minimal in normal CNS cells under identical conditions (Fig. S12F–J).
Collectively, these findings support the translational feasibility of PSMD14 targeting by demonstrating preferential vulnerability of GBM cells with limited toxicity in normal CNS cells. Mechanistically, PSMD14 deubiquitinates and stabilizes BCKDK, thereby remodeling tumor BCAA metabolism and elevating BCAA availability in the TME, which suppresses NK cell activity and facilitates immune evasion.
PSMD14 promotes BCKDK-mediated immune suppression in vivo
To demonstrate the function of the PSMD14/BCKDK axis in reprogramming BCAA metabolism and mediating immunosuppression in vivo, we established an orthotopic model in C57BL/6 mice using luc-GL261 cells stably expressing PSMD14 shRNA, BCKDK open reading frame (ORF), or PSMD14 shRNA plus BCKDK ORF. Compared to other groups, PSMD14 knockdown significantly reduced tumor size and improved survival outcomes (Figs. 6A, B and S13A). PSMD14 knockdown markedly decreased BCAA levels within GL261 tumors, whereas BCKDK overexpression restored BCAA content in PSMD14-deficient tumors. Moreover, GL261 tumors with BCKDK overexpression in the scramble group displayed further elevated BCAA levels, as assessed by HPLC-MS/MS (Fig. S13B) (Table S5). Multiplex IF analysis showed that PSMD14 knockdown markedly increased TNF-α+ NK cell infiltration and reduced TIM3+ NK cell infiltration in GL261 tumors, while BCKDK overexpression attenuated the infiltration of functionally active NK cells in PSMD14-deficient tumors (Fig. 6C). Tumors were harvested and processed for flow cytometric analysis to evaluate NK cell infiltration. The amount of NK cells among tumor-infiltrating immune cells, as well as the frequencies of CD107+, PD-1+, TNF-α+, IFN-γ+, perforin+, and granzyme B+ subsets among NK cells, were determined by flow cytometry. PSMD14 knockdown led to a significant increase in overall NK cell infiltration and higher percentages of CD107+, TNF-α+, IFN-γ+, perforin+, and granzyme B+ NK cells, while reducing the amount of PD-1+ NK cells. In contrast, BCKDK overexpression reversed the immunostimulatory effects of PSMD14 knockdown and further exacerbated immune suppression in scramble tumors (Fig. S13C–I). IHC analysis confirmed that PSMD14/BCKDK expression patterns in vivo were consistent with in vitro findings: PSMD14 knockdown significantly enhanced NK cell infiltration and inhibited tumor proliferation, whereas BCKDK overexpression almost completely rescued the loss of NK cell infiltration and restored tumor proliferation in PSMD14-deficient tumors. TUNEL staining further demonstrated a significant increase in the apoptotic index in PSMD14-knockdown tumors (Fig. S13J–P).

A, B Tumor growth and survival analysis of C57 mice orthotopically implanted with GL261 cells stably expressing PSMD14 shRNA, BCKDK ORF, or PSMD14 shRNA plus BCKDK ORF (n = 6 mice per group). C Multiplex IF analysis of TNF-α⁺ and TIM3⁺ NK cell infiltration in GL261 tumors from different experimental groups, 50 μm (overview), 25 μm (boxed area). D Schematic of experimental workflow for scRNA-seq of dissociated scramble and shPSMD14 GL261 tumors. E UMAP visualization of scRNA-seq showing clustering by canonical markers. F Quantitative assessment of NK, CD8⁺ T, and DC populations within tumor-infiltrating immune cells. G Functional enrichment analysis highlighting changes in NK cell-mediated cytotoxicity in shPSMD14 GL261 tumors.
To further investigate the role of PSMD14 in modulating the tumor immune microenvironment, we dissociated scramble and PSMD14-knockdown GL261 tumors and conducted single-cell RNA sequencing (scRNA-seq) (Fig. 6D). Dimensionality reduction and clustering based on canonical marker genes (Figs. 6E and S14A) revealed a marked elevation in the proportions of intratumoral NK, CD8+ T, and dendritic cells (DCs) in shPSMD14 GL261 tumors (Fig. 6F). Functional enrichment analysis of cell subsets demonstrated that PSMD14 knockdown significantly influenced NK cell-mediated cytotoxicity within the NK cell compartment (Fig. 6G), and also affected regulating the T cell stimulation and immune cell differentiation within other immune subpopulations (Fig. S14B, C). CellChat analysis further indicated that intercellular communication was significantly enhanced in shPSMD14 GL261 tumors (Fig. S14D), with NK cells acting as key “Senders” orchestrating intercellular signaling, most notably in communication between NK and CD8+ T cells (Fig. S14E).
To assess the in vivo effects of the PSMD14 inhibitor OPA on tumor BCAA metabolic reprogramming and the immune microenvironment, we established an orthotopic luc-CT2A model in C57 mice. Compared to controls, OPA treatment resulted in significantly reduced tumor burden and improved survival (Fig. S15A–C). IHC demonstrated markedly decreased expression of PSMD14, BCKDK, and Ki-67, along with increased infiltration of NK1.1+ cells in OPA-treated tumors; TUNEL staining further indicated an elevated apoptosis index (Fig. S15D, E). HPLC-MS/MS analysis revealed that OPA administration significantly lowered BCAA levels in CT2A tumor tissues (Fig. S15F) (Table S5). Flow cytometric analysis showed that OPA treatment significantly increased NK cell tumor infiltration and enhanced the percentages of activated NK cells, while reducing PD-1+ NK cells within the tumor (Fig. S15G–I). Multiplex IF further confirmed that OPA treatment increased TNF-α+ NK cell infiltration and decreased TIM3+ NK cell infiltration in CT2A tumors compared to the control group (Fig. S15J).
Previous studies have established the existence of an NK-cDC1(conventional DC subset 1)-CD8⁺ T cell immune circuit mediating synergistic anti-tumor responses within the TME [33, 34]. Our single-cell transcriptomic analysis further demonstrated that PSMD14 knockdown markedly enhanced intercellular communication between intratumoral NK and CD8⁺ T cells. To disrupt the bridge facilitating NK and CD8⁺ T cell interactions in vivo, we utilized Batf3-deficient (Batf3–/–) mice, characterized by defective cDC1 development and function [35]. and established orthotopic luc-GL261 tumors with OPA treatment (Fig. S16A). In vivo imaging revealed that OPA-mediated tumor suppression was substantially attenuated in Batf3–/– mice compared to wild-type controls (Fig. S16B, D). Flow cytometric analysis of tumor tissues indicated that OPA significantly increased both NK and CD8⁺ T cell infiltration in wild-type mice, whereas only NK cell infiltration was elevated in Batf3–/– mice (Fig. S16C). Survival analysis further showed that the therapeutic efficacy of OPA was markedly diminished in Batf3–/– mice compared to wild-type animals (Fig. S16E). Given that tumor-driven BCAA depletion suppresses NK cell infiltration and immune activation, we next investigated whether in vivo BCAA supplementation, alone or combined with PD-1 blockade, could enhance anti-tumor efficacy in GL261 tumor–bearing mice (Fig. S16F). Tumor size and survival were comparable between the high and normal BCAA diet groups. However, adding anti–PD-1 antibody in the high BCAA group significantly reduced tumor burden and improved survival outcomes (Fig. S16G–J). IHC analysis confirmed a noticeable elevation in NK and CD8⁺ T cell infiltration following PD-1 immunotherapy in the high BCAA diet group (Fig. S16H). Collectively, these findings illustrate that while an increased BCAA diet alone does not inhibit tumor growth, such an immune-supportive microenvironment may facilitate the recruitment of cDC1s by restored NK cells, thereby promoting CD8⁺ T cell cytotoxicity during immunotherapy.
Inhibition of PSMD14 activity increases CAR-NK sensitivity
Our studies have indicated that PSMD14 has a critical function in regulating tumor BCAA metabolism and modulating the tumor immune microenvironment via influencing NK cell activity, indicating its potential as a therapeutic target for endogenous immune regulation. To investigate the potential synergistic effects of combining the PSMD14-specific inhibitor OPA with CAR-NK cells therapy, we established an orthotopic luc-IL60-11 patient-derived xenograft (PDX) GBM model. This model included groups treated with OPA alone, CAR-NK cells alone, and their combination, with therapeutic efficacy dynamically monitored by bioluminescent imaging (BLI) and magnetic resonance imaging (MRI) (Fig. 7A). While OPA monotherapy exhibited limited efficacy, both CAR-NK cell and combination therapies produced significant tumor growth inhibition, with the combined treatment displaying superior synergistic anti-tumor effects (Figs. 7B and S17A), as in vivo DiR fluorescent tracing demonstrated significantly increased CAR-NK cell persistence and tumor-infiltrating immunological function in the combination group (Figs. 7C and S17B). Combined therapy significantly prolonged overall survival, delayed weight loss, and improved the quality of life in treated mice compared to all other groups (Fig. S17C, D). MRI confirmed marked tumor regression and necrotic cavity formation following combination treatment (Fig. 7D, E). TUNEL staining indicated extensive tumor cell apoptosis (Fig. 7F, G), while WB analysis showed activation of the Bax/Bcl-2 apoptotic pathway in tumors from the combination group (Fig. 7H). On day 21 post-treatment, ELISA analyses of serum and tumor tissue demonstrated increased levels of pro-inflammatory cytokines (TNF-α, IFN-γ, IL-2, IL-6, IL-17A) and reduced anti-inflammatory cytokines (IL-4, IL-10) with combined therapy, highlighting an enhanced anti-tumor immune response (Fig. S17E, F).

A Schematic of the treatment protocol and experimental groups in the IL60-11-luc orthotopic PDX model (n = 5 mice per group). B Bioluminescence imaging (BLI) assessment of intracranial tumor growth following treatment with OPA, EGFRvIII-CAR NK cells, or their combination. C In vivo DiR fluorescent tracking of CAR-NK cell persistence and tumor infiltration. D, E MRI analysis of tumor burden and necrosis formation across groups. All data are mean ± SEM. P values were calculated using two-way ANOVA for Dunnett’s multiple-comparisons test. F, G TUNEL staining of tumor sections from each treatment group to assess apoptotic activity, 50 μm (overview), 25 μm (boxed area). All data are mean ± SEM. P values were calculated using two-way ANOVA for Dunnett’s multiple-comparisons test. H WB analysis of Bax/Bcl-2 pathway activation following therapy.
To further evaluate the influence of BCAA metabolism on the effectiveness of CAR-NK immunotherapy, we established an orthotopic luc-140-55 PDX model and administered either standard or high BCAA diets during PBS or CAR-NK cell treatment (Fig. S18A). High dietary BCAA intake markedly enhanced CAR-NK cell persistence in TME, promoted tumor-infiltrating immune activity, and significantly suppressed tumor growth (Fig. S18B–D). To evaluate therapeutic safety, TUNEL staining was performed on liver and spleen tissues after treatment, revealing no significant differences in apoptosis among groups, thus indicating an absence of detectable hepatic or splenic toxicity with OPA, CAR-NK therapy, or their combination (Fig. S18E, F).
PSMD14 and BCKDK clinical relevance in immune infiltration
To evaluate the relationship between PSMD14, BCKDK, and antitumour immune responses in GBM, we conducted multiplex IF staining using anti-CD8 and anti-CD56 antibodies on clinical GBM samples. Tumors with high PSMD14 expression displayed elevated levels of BCKDK, along with a marked reduction in the infiltration of CD8+ T and CD56+ NK cells (Fig. 8A–C). To further validate the link between PSMD14 and BCKDK expression in clinical samples, we conducted IHC in a cohort of 114 GBM specimens, including 41 with low and 73 with high PSMD14 expression (Figs. 8D and S19A, B). A total of 82.19% of the PSMD14-high samples illustrated elevated BCKDK levels compared to 14.63% of the PSMD14-low samples (Fig. S19B). Consistently, high PSMD14 expression was significantly associated with MGMT status (P = 0.017; χ² test) and with elevated BCKDK expression (P < 0.001; χ² test) (Table S6). In addition, multivariable Cox regression analyses identified PSMD14 and BCKDK levels as independent prognostic factors for 4-year overall survival in patients with GBM (Table S7).

A Representative multiplex IF images of two GBM cases showing the strategy for tumor-infiltrating lymphocyte (TIL) identification based on CD56 and CD8 expression; each marker is displayed in a distinct color, scale bars: 50 μm (overview), 25 μm (boxed area). Quantification of CD8⁺ T cells (B) and CD56⁺ NK cells (C) in GBM tissues with high (n = 73) or low (n = 41) PSMD14 expression, assessed by multiplex IF staining. All data are mean ± SEM. P values were calculated using unpaired two-tailed Student’s t test. D Representative IHC images of PSMD14 and BCKDK in human GBM samples, 200 μm (overview), 25 μm (boxed area). Kaplan–Meier survival analysis of GBM patients (n = 114), stratified by PSMD14 (E) or BCKDK (F) expression (log-rank test, P < 0.0001). G Schematic illustration of the PSMD14/BCKDK/IGF2BP3 positive feedback circuit, which stabilizes SLC7A5/SLC7A8 mRNAs to promote GBM-driven BCAA acquisition, suppress NK cell activation, and exacerbate the formation of an immunosuppressive TME.
Transcriptomic profiling from TCGA revealed significantly higher PSMD14 mRNA levels in GBM compared with low-grade glioma (LGG) and non-tumour brain (NTB) tissues (Fig. S19C). The CGGA analysis further illustrated a positive link between PSMD14 expression and glioma WHO grade (Fig. S19D). Kaplan-Meier analysis demonstrated that elevated expression of PSMD14 or BCKDK was linked to significantly worse overall survival (Fig. 8E, F), consistent with findings from the TCGA cohort (Fig. S19E, F). Moreover, multivariate survival analysis illustrated an inverse survival correlation with PSMD14 expression even when accounting for IDH mutation, 1p/19q codeletion, MGMT promoter methylation, as well as patient age and sex (Fig. S19G–P).
Collectively, these data indicate that the PSMD14–BCKDK axis is negatively associated with immune cell infiltration in GBM, supporting the therapeutic potential of PSMD14 in enhancing CAR-NK immunotherapy responses (Fig. 8G).