
Synthesis and physicochemical characterization of V-MBG microspheres and GCP-V-MBG hydrogels
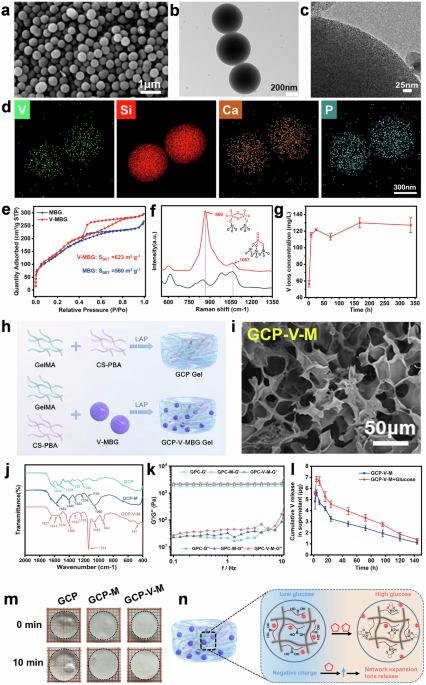
V-MBG microspheres with a CaO–SiO₂–P₂O₅–V₂O₅ composition were synthesized via a sol–gel approach based on a cooperative self-assembly mechanism using CTAB as a template (Supplementary Fig. 1a).18 SEM and TEM images revealed uniform spherical particles (~500 ± 20.5 nm) with well-defined mesoporous architecture (Fig. 1a–c), and elemental mapping confirmed homogeneous distribution of V, Si, Ca, and P (Fig. 1d). Nitrogen adsorption–desorption isotherms exhibited type IV curves with H1 hysteresis (Fig. 1e), indicating mesoporosity,18 and V-MBG showed increased surface area (623 m²/g) and pore volume compared to MBG. XPS analysis revealed a V 2p₃/₂ peak at 516.5 ± 0.1 eV, consistent with V⁵⁺ species.19 FTIR spectra displayed characteristic Si–O vibrational bands, and enhanced intensity at 945 cm⁻¹ that indicated V incorporation into the silica framework (Supplementary Fig. 1d). UV Raman spectroscopy further confirmed vanadium existed as polymerized oxides (869 cm⁻¹) on the surface and tetrahedral V = O species (1067 cm⁻¹) in the matrix (Fig. 1f).20 Furthermore, V ions could be gradually released from V-MBG in PBS over time (Fig. 1g).

Synthesis and physicochemical characterization of V-MBG microspheres and GCP-V-MBG hydrogels. a Scanning electron microscopy (SEM) of V-MBG microspheres. b, c Transmission electron microscopy (TEM) of V-MBG microspheres. d EDS elements mapping of V, Si, Ca, and P on V-MBG microspheres. e N2 adsorption–desorption isotherms of MBG and V-MBG microspheres. f UV Raman spectra of MBG and V-MBG microspheres. g Variations of V ions concentration for V-MBG microspheres to soak in PBS. h Schematic illustration of V-MBG@GCP hydrogel preparation. i SEM images of dry GCP-V-M hydrogels. j FTIR spectra of GCP, GCP-M, GCP-V-M hydrogels. k Rheological property of GCP, GCP-M, GCP-V-M hydrogels. l Glucose-responsive V ions release in different times. m Representative images of the various hydrogels soaking in high concentration of glucose solution (12 g/L). n Schematic illustration of glucose-responsive V ions release
To enable effective delivery of V-MBG into diabetic wounds, a glucose-responsive hydrogel was engineered (Fig. 1h). Phenylboronic acid (PBA), known for its glucose sensitivity, was grafted onto carboxymethyl chitosan (CS) via one-step synthesis,21 forming CS-PBA (Supplementary Fig. 1e, f). Together with GelMA, the CS-PBA formed a dynamic photocrosslinked network, yielding GelMA/CS-PBA (GCP) hydrogels. Incorporation of V-MBG or MBG microspheres produced GCP-V-MBG (GCP-V-M) and GCP-MBG (GCP-M) variants.
SEM imaging revealed that microsphere loading did not significantly alter hydrogel morphology or pore size (Fig. 1i, Supplementary Fig. 1G–I). EDS analysis confirmed the presence of Si and V elements on the scaffold surface, indicating successful microsphere embedding (Fig. 1j). FTIR spectra of GCP hydrogels showed characteristic bands of GelMA (1634, 1539, 1236 cm⁻¹) and CS-PBA (1550, 1398 cm⁻¹).22,23 After embedding, GCP-M and GCP-V-M displayed additional Si–O peaks (~457, 1060 cm⁻¹), and the emergence of peaks at 945 and 1134 cm⁻¹ confirmed the presence of vanadium species. Mechanical testing revealed that the incorporation of either V-MBG or MBG microspheres markedly enhanced both storage (G′) and loss (G″) moduli compared to the pure GCP hydrogel, improving the matrix’s mechanical robustness (Fig. 1k). Under conditions mimicking the hyperglycemic diabetic wound microenvironment (25 mM glucose) or exceeding it, GCP-V-M hydrogels released more vanadium ions (Fig. 1l and Supplementary Fig. 1l), attributed to glucose-triggered swelling (Fig. 1m and Supplementary Fig. 1k). Mechanistically, glucose binding to PBA increased the hydrogel’s negative charge density under hyperglycemic conditions, promoting matrix expansion and electrostatic release of VO₄³⁻ and MBG/V-MBG particles (Fig. 1n).24
In vivo study of GCP-V-MBG hydrogels on diabetic wounds
A diabetic mouse model was established using C57 mice (Fig. 2a and Supplementary Fig. 2a). Non-targeted metabolomic profiling of excised skin tissue revealed pronounced metabolic alterations between non-diabetic (N-DM) and diabetic (DM) groups (Supplementary Fig. 2b, c). Diabetic wounds exhibited a marked accumulation of acidic metabolites (Supplementary Fig. 2d), particularly lactic acid (Supplementary Fig. 2e(a)), and a significant reduction in palmitoleic acid Supplementary Fig. 2e(b), likely attributable to a high-sugar, high-fat diet. These data confirmed successful induction of diabetes-associated metabolic dysfunction in wound tissue.

In vivo study of GCP-V-MBG hydrogels on diabetic wounds. a Illustration of the timeline of animal experiments of hydrogels. b Representative photos and schematic diagrams of the diabetic wound on different times. c Quantitative analysis of wound closure rate (n = 5). d H&E staining of wound area in different hydrogel groups at day 3, 6, 12, and Masson’s trichrome staining at day 12 (n = 4). e, g Representative images of IHC staining for TNF-α, IL-10 in different groups on day 6. f, h Quantitative analysis of IHC staining for TNF-α, IL-10 in different groups on day 6 (n = 9, randomly-selected microscopic images). i Representative images of IF staining for CD206, iNOS in different groups on day 4. j, k Quantitative analysis of IF staining for CD206, iNOS in different groups on day 4 (n = 6, randomly-selected microscopic images). Data were represented as mean ± SD. Statistical significance between groups are marked as *P < 0.05, **P < 0.01, ***P < 0.001, ****P < 0.0001
To evaluate therapeutic efficacy, full-thickness dorsal wounds (6 mm diameter) were generated, followed by treatment with GCP-V-M hydrogel (Fig. 2a). Compared to other groups, GCP-V-M significantly accelerated wound closure at all time points (Fig. 2b), achieving near-complete healing (96.00 ± 1.18%) (Fig. 2c). Histological analyses via H&E and Masson staining further validated these observations. Wound lengths from day 3 to 12 were shortest in the GCP-V-M group (Fig. 2d), consistent with macroscopic healing. On days 3 and 6, this group also exhibited thicker epidermal and granulation layers (Supplementary Fig. 4a, b), suggesting enhanced inflammatory response and early regeneration. By day 12, both layers were significantly thinner, indicating a faster transition into the remodeling phase.22 Collagen deposition was also notably greater in GCP-V-M-treated wounds (Fig. 2d and Supplementary Fig. 4c), further supporting its beneficial role in modulating the inflammatory phase and promoting diabetic wound repair.
To clarify the contribution of V-MBG, its effect was examined independently. V-MBG alone significantly enhanced wound healing (Supplementary Fig. 2f–k) and improved the local metabolic profile. Metabolomic analysis showed reduced levels of accumulated amino acids, lipids, and acidic intermediates in V-MBG-treated wounds (Supplementary Fig. 3a–d), suggesting a correction of metabolic dysregulation.25 KEGG enrichment indicated differential metabolites were predominantly linked to lipid, amino acid, and carbohydrate metabolism (Supplementary Fig. 3e), implicating V-MBG in the regulation of cellular energy metabolism.8
Mechanism study of GCP-V-M hydrogels mediated wound healing in vivo
To investigate the molecular mechanisms underlying the regenerative effects of GCP-V-M hydrogel during the inflammatory phase, proteomic profiling was performed. Comparative analysis between GCP-V-M and GCP groups identified 310 differentially expressed proteins (DEPs; P < 0.05), including 78 upregulated and 232 downregulated proteins (Supplementary Fig. 4d). Gene ontology (GO) enrichment of downregulated DEPs revealed significant associations with inflammation and energy metabolism, such as “NF-kappaB binding”, “ATP binding”, and “regulation of interleukin-1 production” (Supplementary Fig. 4e). Notably, GO terms linked to epigenetic processes—including “DNA binding” and “histone methylation”—were also enriched. In contrast, upregulated DEPs were associated with immunoregulation and lipid metabolism, including “negative regulation of lymphocyte-mediated immunity”, “reactive oxygen species metabolic process”, and pathways such as “glycerolipid catabolism” and “phospholipid metabolism” (Supplementary Fig. 4f). These findings suggest that GCP-V-M hydrogel modulates inflammation, immunity, epigenetics, and metabolic functions to promote diabetic wound healing.
Immunohistochemistry (IHC) was used to evaluate inflammation and vascularization in regenerated tissues. Compared to controls, wounds treated with GCP-V-M and GCP-M hydrogels exhibited significantly reduced expression of pro-inflammatory cytokines TNF-α and IL-6, with GCP-V-M showing the greatest suppression (Fig. 2e, f and Supplementary Fig. 4g, h), indicating enhanced anti-inflammatory efficacy driven by vanadium ions. In parallel, IL-10 expression was markedly increased in the GCP-V-M group (Fig. 2g, h), further supporting its anti-inflammatory potential. CD31 staining indicated that neovascularization was observed in both the GCP-M and GCP-V-M groups, yet was significantly stronger in the GCP-V-M group (Supplementary Fig. 4i, j), underscoring its superior capacity to drive the microvascular regeneration essential for wound repair.
Given the central role of macrophages in regulating wound inflammation4 and the importance of M2 polarization in resolving chronic inflammation,5,6,7 we further assessed macrophage phenotype transitions in vivo. Immunofluorescence staining for iNOS (M1 marker) and CD206 (M2 marker) on day 4 demonstrated enhanced M2 polarization in the GCP-V-M group compared to all others (P < 0.01), including GCP-M (Fig. 2i–k). These results indicate that GCP-V-M hydrogel effectively reprograms macrophages toward a pro-regenerative M2 phenotype, with vanadium playing a pivotal role in immune modulation and wound resolution. This polarization effect was corroborated by cytokine profiling (IL-1β, TNF-α, IL-6, TGF-β, IL-10) and macrophage marker expression (CD206, iNOS) following V-MBG treatment (Supplementary Fig. 4k–n), confirming its role in inflammation attenuation and immune rebalancing. Besides, upregulation of TGF-β, IL-10, and CD31 suggests that mesenchymal stem cells, vascular endothelial cells, and fibroblasts are likely involved in shaping a pro-regenerative microenvironment to support M2 polarization.26,27 In summary, GCP-V-M does not merely accelerate wound closure but actively promotes a regenerative phenotype. This is achieved by orchestrating a multifaceted response that corrects hyperglycemia, resolves inflammation, and promotes vascularization, thereby shifting the healing paradigm away from fibrosis.
V-MBG regulates macrophage polarization in vitro
Given the pivotal in vivo role of V-MBG in promoting macrophage M2 polarization and mitigating inflammation, its effects were further explored in vitro. Extracts of V-MBG and MBG were prepared using a standard medium extraction protocol17,28 and co-cultured with bone marrow-derived macrophages (BMDMs) (Fig. 3a). ICP analysis confirmed the presence of V (8.0 ± 0.9 mg/L), Si (58.0 ± 0.7 mg/L), Ca (55.6 ± 4.4 mg/L), and P (36.3 ± 0.2 mg/L) ions in V-MBG extracts. Notably, Si, Ca, and P concentrations were comparable across V-MBG and MBG groups (Supplementary Table 2), while V ions were exclusive to V-MBG, suggesting their key role in modulating macrophage behavior.

V-MBG regulates macrophage polarization in vitro. a Schematic illustration of the preparation of V-MBG/MBG extracts and the concentration of V, Si, Ca, and P ions of extracts. b Cell viability of V-MBG extracts with different dilution ratios. c Relative expression for Il-1β, Il-6, Cd80, Cd206, Arg1, and Tgf-β genes of BMDM in different groups on 24 h (n = 4). d Protein expression for CD86, iNOS, CD163, CD206 and Arg1 of BMDM in different groups on 24 h (n = 3). e–h Flow cytometry analysis of CD86 and CD206 for BMDM in different groups on 24 h, and quantitative analysis of CD86+ and CD206+ cells (n = 3). i Representative images of IF staining for iNOS, Arg1 in different groups on 24 h. j, k Quantitative analysis of IF staining for iNOS, Arg1 in different groups on day 4 (n = 6, randomly-selected microscopic images). Data were represented as mean ± SD. Statistical significance between groups are marked as *P < 0.05, **P < 0.01, ***P < 0.001, ****P < 0.0001
To exclude cytotoxic effects, CCK-8 assays showed no significant toxicity at any dilution, with slight increases in viability at 100× and 200× dilutions (Fig. 3b). To assess immunomodulatory potential, LPS-induced M1-polarized BMDMs29 were treated with varying dilutions of V-MBG extracts. At 1/200 dilution, V-MBG significantly suppressed M1 markers (CD86, iNOS) and upregulated M2 marker CD163 (Supplementary Fig. 5b), indicating a shift toward an anti-inflammatory phenotype. This concentration was thus used for subsequent mechanistic studies, with MBG extract and vanadium-only solutions as controls.
Live/dead staining confirmed excellent cytocompatibility ( > 90% viability) across all groups (Supplementary Fig. 5a). RT-qPCR analysis demonstrated significant downregulation of M1-associated genes (Il-1β, Il-6, Cd80) and upregulation of M2-related genes (Cd206, Arg1, Tgf-β) in the LPS + V-MBG group, which showed the most pronounced effects (P < 0.05; Fig. 3c). Protein-level validation echoed these results: V-MBG treatment reduced CD86 and iNOS while markedly enhancing CD163, CD206, and Arg1 expression (Fig. 3d and Supplementary Fig. 5c–g).
Flow cytometry and immunofluorescence (IF) further confirmed M2 polarization, with IL-4 as a positive control. V-MBG reduced CD86⁺/CD206⁻ M1 macrophage populations and increased CD206⁺/CD86⁻ M2 macrophages (P < 0.01; Fig. 3e–h), similar to IL-4. IF staining showed decreased iNOS and increased CD206 levels in both IL-4 and V-MBG groups (Fig. 3i–k). Morphologically, V-MBG-treated BMDMs adopted elongated, spindle-like shapes typical of M2 macrophages, mirroring IL-4 effects30 (Fig. 3i). Collectively, these findings confirm that V-MBG robustly drives macrophage polarization toward the M2 phenotype.
V-MBG improves mitochondrial OXPHOS level of BMDM
To elucidate the molecular mechanisms underlying V-MBG-induced macrophage polarization, RNA sequencing was conducted on BMDMs stimulated with LPS alone (control) or LPS plus V-MBG extracts (V-M) for 24 h (Supplementary Fig. 6a). Principal component analysis and clustering revealed distinct transcriptomic profiles between groups, with 3790 differentially expressed genes (DEGs), including 1990 upregulated and 1800 downregulated genes in the V-M group (Supplementary Fig. 6b–d). Notably, V-MBG treatment upregulated M2 markers (Arg1, Chil3, Mrc1, Cd163) and downregulated M1-associated genes (Il-1β, Il-6, Nos2, Tnf, Cd86) (P < 0.05; Supplementary Fig. 6e), confirming M2 polarization. GO enrichment indicated that DEGs were significantly associated with “metabolic process” and “immune system process,” suggesting metabolic pathways may underlie this phenotypic switch (Fig. 4a).

V-MBG improves mitochondrial OXPHOS level of BMDM. a Go annotation analysis of BP significantly enriched from upregulated DEGs (V-M vs Ctrl) (n = 4). b Top KEGG pathways of metabolism significantly enriched from upregulated DEGs (V-M vs Ctrl) (n = 4). c–e GSEA analysis of oxidative phosphorylation (c), citrate cycle (d) and glycolysis (e) pathways for V-M vs Ctrl. f Oxygen consumption rate (OCR) –Time curve of BMDM in LPS, LPS + V-MBG and LPS + IL-4 groups (n = 6). g Mitochondrial basal respiration, maximal respiration and ATP production of BMDM in different groups (n = 6). h Extracellular acidification rate (ECAR)-Time curve of BMDM in different groups (n = 6). i Glycolysis, glycolytic capacity, glycolytic reserve of BMDM in different groups. j ATP production rate of BMDM in different groups (n = 6). k ATP rate index (mitoATP production rate/glycoATP production rate) of BMDM in different groups (n = 6). l Average±SD of mitoATP production rate and glycoATP production rate (Energetic map). m Mitochondrial morphology of BMDM triggered by LPS and LPS + V-MBG. n, o Mitochondrial aspect ratio (n) and mitochondrial area (o) of BMDM in LPS and LPS-V-MBG groups (n = 20). Data were represented as mean ± SD. Statistical significance between groups are marked as *P < 0.05, **P < 0.01, ***P < 0.001, ****P < 0.0001
Macrophage polarization is critically supported by energy metabolism, primarily glycolysis and OXPHOS.8,9,10,15. Transcriptomic KEGG analysis of upregulated genes highlighted pathways related to carbohydrate and energy metabolism (Supplementary Fig. 6f), notably “oxidative phosphorylation,” “glycolysis/gluconeogenesis,” and the “TCA cycle” (Fig. 4b). Gene set enrichment analysis (GSEA) confirmed significant activation of these energy pathways (Fig. 4c–e), implicating enhanced mitochondrial metabolism in V-MBG-induced M2 polarization.
To validate these findings functionally, metabolic profiling was performed using a Seahorse analyzer. V-MBG markedly enhanced oxygen consumption rate (OCR), comparable to IL-4 stimulation, indicating improved mitochondrial respiration (Fig. 4f). Quantitative analysis showed significantly increased basal respiration, maximal respiration, and ATP production in both V-MBG and IL-4 groups versus LPS alone (P < 0.01; Fig. 4g), demonstrating a robust enhancement of OXPHOS. Moreover, extracellular acidification rate (ECAR) measurements revealed that V-MBG slightly increased glycolytic activity relative to LPS (P < 0.05; Fig. 4h, i), although less prominently than its effects on mitochondrial respiration. IL-4, by contrast, reduced glycolysis. No notable changes were observed in glycolytic capacity or reserve between V-MBG and LPS groups, suggesting a modest role for glycolysis in this context. Furthermore, ATP production assays revealed that total ATP generation was significantly higher in the V-MBG group compared to LPS (P < 0.01), largely driven by OXPHOS-derived ATP (P < 0.05), with a minor decrease in glycolysis-derived ATP (Fig. 4j). The ATP Rate Index and Energetic Map confirmed a metabolic shift toward OXPHOS dominance in the V-MBG group (Fig. 4k, l), reinforcing the conclusion that mitochondrial ATP generation is the major energy source supporting macrophage M2 polarization.
TEM analysis further supported these findings. V-MBG treatment enhanced mitochondrial size, fusion, and membrane surface area (Fig. 4m). Quantitative metrics showed significant increases in mitochondrial aspect ratio and area (P < 0.0001; Fig. 4n, o), providing structural evidence for OXPHOS upregulation. These results collectively demonstrate that V-MBG promotes M2 polarization by reprogramming macrophage metabolism toward OXPHOS, supported by enhanced mitochondrial function and biogenesis.
Glucose-fueled mitochondrial OXPHOS drives V-MBG-induced macrophage polarization
To probe the metabolic mechanisms underlying enhanced OXPHOS during V-MBG–induced macrophage polarization, we analyzed central carbon metabolism in LPS-stimulated BMDMs treated with V-MBG extracts. Multivariate analysis revealed clear metabolic separation between LPS-V-MBG and LPS groups (Fig. 5a), with 43 differentially expressed metabolites (DEMs) identified (P < 0.05, FC > 1), including key intermediates of glycolysis and the TCA cycle (e.g., G6P, F6P, citrate, itaconate, succinate) (Fig. 5b). KEGG enrichment confirmed that the most affected pathways were glycolysis/gluconeogenesis, the pentose phosphate pathway, and the TCA cycle (Fig. 5c), implicating glucose metabolism in driving OXPHOS during macrophage polarization.

Glucose-fueled mitochondrial OXPHOS drive V-MBG induced macrophage polarization. a PCA plot of metabolome data between LPS and LPS-V-MBG groups. b Volcano plot of LPS-V-MBG versus LPS. c Top KEGG pathways significantly enriched from the differential metabolites (LPS-V-MBG vs LPS) (n = 3). d Quantification of differential metabolites associated with glycolysis and the Krebs cycle for LPS-V-MBG VS LPS groups (n = 3). e Schematic illustration of detecting glucose consumption of macrophages cultured in high glucose medium. f g Glucose consumption of BMDM and Raw264.7 treated by LPS-V-MBG and LPS. h OCR-Time curve of BMDM in LPS, LPS + V-M and LPS + V-M + UK5099 groups (n = 6). i Mitochondrial basal respiration, maximal respiration and ATP production of BMDM in different groups (n = 6). j ATP production rate of BMDM in different groups (n = 6). k Relative normalized expression of Arg1, Chil3, Mrc1, Retnla for gene level in different groups (n = 4). l Protein expression for CD163, Arg1 of BMDM in LPS, LPS + V-M and LPS + V-M + UK5099 groups (n = 3). m Schematic illustration of the decreased mitochondrial OXPHOS stimulated by V-M reduced macrophage M2 polarization. n Schematic illustration of the function of ETO and BPTES. o OCR-Time curve of BMDM in LPS, LPS + V-M, LPS + V-M + ETO, LPS + V-M + BPTES and LPS + V-M + ETP + BPTES groups (n = 6). p Mitochondrial OXPHOS-derived ATP production rate of BMDM in different groups (n = 6). q Mitochondrial total ATP production rate of BMDM in different groups (n = 8). Data were represented as mean ± SD. Statistical significance between groups are marked as *P < 0.05, **P < 0.01, ***P < 0.001, ****P < 0.0001
Metabolite profiling showed significantly increased levels of G6P and F6P in the V-MBG group (P < 0.05), while citrate accumulation (P < 0.01) and decreased itaconate, succinate, fumarate, and malate (P < 0.05) suggested a rerouting of TCA flux (Fig. 5d). These shifts imply that V-MBG modulates central metabolic nodes to enhance mitochondrial respiration. Consistently, intracellular glucose content declined upon V-MBG treatment (Fig. 5d), and time-resolved assays revealed increased glucose uptake and consumption in both BMDMs and RAW264.7 cells (P < 0.05; Fig. 5e–g), indicating elevated glycolytic flux supporting downstream OXPHOS.
To determine the role of glucose-fueled OXPHOS in this process, we used UK5099 to block mitochondrial pyruvate import. OCR analysis revealed a sharp decline in basal and maximal respiration and ATP production following UK5099 treatment in LPS + V-MBG–stimulated BMDMs (Fig. 5h, i), with OXPHOS-derived ATP production significantly reduced (P < 0.05; Fig. 5j). These findings confirm that mitochondrial pyruvate entry is essential for V-MBG–induced metabolic reprogramming and energy generation.
We next assessed whether this metabolic shift was necessary for M2 polarization. RT-qPCR showed that M2-associated genes (Arg1, Chil3, Mrc1, Retnla) were upregulated in V-MBG-treated cells but were significantly suppressed following UK5099 treatment (P < 0.01; Fig. 5k). Western blotting confirmed reduced expression of CD163 and Arg1 under glucose blockade (Fig. 5l and Supplementary Fig. 7a, b). Together, these data demonstrate that glucose-fueled OXPHOS is required for V-MBG-induced M2 polarization (Fig. 5m). Beyond glucose, we investigated whether fatty acids and glutamine contribute to energy supply. Levels of CPT1B and L-carnitine were reduced (Supplementary Fig. 7c, d), and α-KG/succinate ratios remained unchanged (Supplementary Fig. 7e–g), suggesting limited involvement. Inhibiting fatty acid oxidation (via etomoxir, ETO) and glutaminolysis (via BPTES) caused only modest declines in mitochondrial respiration (Fig. 5n, o and Supplementary Fig. 7h, i), with no significant reduction in OXPHOS-derived ATP (Fig. 5p), ruling out these pathways as dominant energy sources. Interestingly, co-inhibition of fatty acid and glutamine metabolism led to a compensatory rise in glycolysis-derived ATP production (P < 0.01), elevating total ATP (P < 0.05; Fig. 5q). ATP rate index and energetic mapping confirmed this metabolic shift toward glycolysis (Supplementary Fig. 7j, k), indicating that glycolysis can partially offset the loss of alternative fuels when required.
In conclusion, these findings establish that V-MBG enhances glucose uptake and metabolism, driving macrophage M2 polarization predominantly through glucose-fueled mitochondrial OXPHOS, with glycolysis acting as a backup under nutrient-restricted conditions.
Mechanism study of glucose-fueled mitochondrial OXPHOS-driven macrophage polarization
To elucidate the signaling mechanisms underpinning V-MBG–induced macrophage polarization and enhanced OXPHOS, KEGG enrichment analysis of upregulated DEGs revealed significant activation of pathways implicated in macrophage function,31 including PI3K-AKT, JAK-STAT, and TGF-β signaling (Fig. 6a). GSEA further validated these activations (Fig. 6b and Supplementary Fig. 6g, h), with chord diagram analysis highlighting gene enrichment primarily in the PI3K-AKT and JAK-STAT pathways (Supplementary Fig. 6i). However, only PI3K and AKT phosphorylation was significantly increased in the V-MBG group (Fig. 6c and Supplementary Fig. 8a, b), while STAT6 activation remained unchanged (Supplementary Fig. 6j, k), indicating that PI3K-AKT, rather than JAK-STAT, is the principal mediator in this context.

Mechanism study of glucose-fueled mitochondrial OXPHOS driven macrophage polarization. a Top KEGG pathways significantly enriched from upregulated DEGs (V-M vs Ctrl) (n = 4). b GSEA analysis of PI3K-AKT signaling pathway for V-M vs Ctrl. c Protein expression for PI3K, p-PI3K, AKT, and pAKT of BMDM in different groups on 24 h (n = 3). d Protein expression for INSR, GLUT4 of BMDM in different groups on 24 h (n = 3). e Representative images of IF staining for INSR, GLUT4 in different groups on 24 h. f Quantitative analysis of IF staining for INSR, GLUT4 in different groups (INSR, n = 5 each and GLUT4, n = 7 each, randomly-selected microscopic images). g Genes expression of metabolic enzyme involved in glycolysis and TCA cycle for LPS-V-M vs LPS. h Protein expression for IDHA, SDHA of BMDM in LPS and LPS + V-MBG groups on 24 h (n = 3). i Quantitative analysis of protein relative expression for IDHA, SDHA of BMDM in different groups on 24 h (n = 3). j Concentration of acetylCoA of BMDM in LPS and LPS + V-MBG (n = 6). k Protein expression for p-ACLY and ACLY of BMDM in different groups on 2, 4 h (n = 3). l Quantitative analysis of p-ACLY/ACLY protein relative expression (Normalized to GAPDH) of BMDM in different groups on 2, 4 h (n = 3). m Protein expression of H3K9ac, H3K27ac, H3K18ac for BMDM in different groups (n = 3). n Quantitative analysis of H3K9ac protein relative expression (Normalized to Histone H3) in LPS and LPS + V-MBG groups (n = 3). o Schematic illustration of the process for citrate-Ac-CoA flux to support M2 polarization through a defined H3K9ac-mediated epigenetic axis. Data were represented as mean ± SD. Statistical significance between groups are marked as *P < 0.05, **P < 0.01, ***P < 0.001, ****P < 0.0001
Given the metabolic demands of M2 polarization, we next investigated upstream regulation of glucose metabolism. Glucose uptake is mediated by insulin and IGF-1 signaling through the INSR-PI3K-AKT axis and facilitated by glucose transporters such as GLUT4 and GLUT1.32,33,34 V-MBG upregulated Insr gene expression (Supplementary Fig. 6i) and markedly elevated INSR protein levels, as confirmed by WB and IF (P < 0.05; Fig. 6d–f and Supplementary Fig. 8c). GLUT4 expression was significantly enhanced in V-MBG–treated cells (Fig. 6d–f and Supplementary Fig. 8d), while GLUT1 remained unchanged (Supplementary Fig. 8e–g), suggesting GLUT4 is the primary transporter involved. GLUT4-mediated glucose uptake into V-MBG-treated macrophages was further studied, and the results showed that GLUT4 inhibition by Fastentin increased overall glucose consumption (Supplementary Fig. 11c) and enhanced GLUT1 plasma membrane translocation (Supplementary Fig. 11g, h), indicating a compensatory response. In contrast, blocking GLUT1 via BAY-876 did not alter consumption but robustly increased GLUT4 translocation (Supplementary Fig. 11e, g, i). These findings demonstrate that GLUT4 is the preferred pathway for V-MBG-induced glucose uptake, and GLUT1 serves a compensatory role. These results collectively indicate that V-MBG promotes glucose uptake via the INSR–PI3K–AKT–GLUT4 axis.
LPS-treated macrophages exhibit disrupted TCA flux, impairing OXPHOS.35 RNA-Seq data revealed upregulation of key TCA enzymes, particularly IDH3A and SDHA (Fig. 6g). As IDH catalyzes conversion of isocitrate to α-ketoglutarate—a rate-limiting step in the TCA cycle—its enhanced expression (Fig. 6h, i) likely contributes to restored mitochondrial function. PI3K inhibition by LY294002 reduced IDH3A expression without affecting SDHA (Supplementary Fig. 8h, i), confirming that V-MBG–activated PI3K signaling upregulates IDH3A and enhances TCA throughput.
Furthermore, citrate, a key TCA metabolite elevated by V-MBG (Fig. 5d), may influence polarization via citrate/acetyl-CoA (Ac-CoA) metabolism.36 Mitochondrial citrate export supports M2 polarization by increasing nuclear Ac-CoA and promoting histone acetylation.37 V-MBG significantly elevated intracellular Ac-CoA levels (P < 0.0001; Fig. 6j), alongside increased phosphorylation of ATP-citrate lyase (p-ACLY) at 2 and 4 h (Fig. 6k, l), implicating citrate/Ac-CoA flux as a potential epigenetic mechanism in V-MBG–mediated polarization. To identify the specific histone acetylation involved, key acetylation marks (H3K9ac, H3K27ac, H3K18ac) to support macrophage polarization38 were evaluated for V-MBG-treated macrophages. The significant upregulation of H3K9ac (P < 0.01; Fig. 6m, n and Supplementary Fig. 8j, k) indicated that the citrate-Ac-CoA flux promotes M2 polarization through a defined H3K9ac-mediated epigenetic axis (Fig. 6o).
Collectively, these results suggest that V-MBG promotes macrophage M2 polarization by enhancing glucose uptake through the INSR–PI3K–AKT–GLUT4 axis, restoring TCA cycle activity via IDH3A, and modulating citrate-derived Ac-CoA production to support OXPHOS and potential epigenetic reprogramming.
INSR-PI3K-GLUT4 signal axis mediates the glucose-fueled mitochondrial OXPHOS
Building on prior findings, we hypothesized that V-MBG enhances glucose-fueled mitochondrial OXPHOS via activation of the INSR-PI3K-AKT pathway. To test this, mitochondrial respiration was assessed by OCR analysis following treatment with AGL-2263 (AGL), an INSR inhibitor. OCR measurements revealed a dose-dependent decrease in OCR (Fig. 7a), mitochondrial basal respiration, maximal respiration, and ATP production upon AGL treatment (p < 0.0001, Fig. 7b). Total ATP production in BMDMs was also significantly reduced in the LPS + V-MBG + AGL group versus LPS + V-MBG controls (p < 0.05), with both OXPHOS- and glycolysis-derived ATP significantly diminished (p < 0.01; Fig. 7c), confirming that INSR mediates OXPHOS enhancement. Next, RT-qPCR analysis showed that key M2 macrophage markers (Arg1, Chil3, Mrc1) were upregulated by V-MBG but significantly suppressed by AGL (p < 0.0001; Fig. 7d). Concordantly, CD163 and Arg1 protein levels declined upon INSR inhibition (Fig. 7e and Supplementary Fig. 9a, b), supporting the role of INSR in V-MBG-induced M2 polarization.

INSR-PI3K signal axis mediated the glucose-fueled mitochondrial OXPHOS. a OCR-Time curve of BMDM in LPS, LPS + V-M, LPS + V-M + AGL-10 and LPS + V-M + AGL-20 groups (n = 6). b Mitochondrial basal respiration, maximal respiration and ATP production of BMDM in different groups (n = 6). c ATP production rate of BMDM in different groups (n = 8). d Relative normalized expression of Arg1, Chil3, Mrc1 for gene level in different groups (n = 4). e Protein expression for CD163, Arg1 of BMDM in different groups (n = 3). f ECAR-Time curve of BMDM in different groups (n = 6). g Glycolysis, glycolytic capacity, glycolytic reserve of BMDM in different groups. h OCR-Time curve of BMDM in LPS, LPS + V-M, LPS + V-M + LY-20 and LPS + V-M + LY-40 groups (n = 6). i Mitochondrial basal respiration, maximal respiration and ATP production of BMDM in corresponding groups (n = 6). j ATP production rate of BMDM in corresponding groups (n = 8). k Relative gene expression of Arg1, Chil3, Mrc1 of BMDM by RT-qPCR after using PI3K inhibitor (LY294002) in different groups (n = 4). l Schematic illustration: INSR-PI3K signaling pathway mediates the improvement of glucose-derived OXPHOS and the following macrophage polarization toward M2 phenotype. Data were represented as mean ± SD. Statistical significance between groups are marked as *P < 0.05, **P < 0.01, ***P < 0.001, ****P < 0.0001
The impact of INSR on glycolysis was further explored via ECAR analysis. Increasing AGL concentrations caused a mild ECAR decline (Fig. 7f), with glycolysis and glycolytic capacity unaffected at 10 μM but significantly reduced at 20 μM (Fig. 7g). Notably, glycolytic reserve was nearly abolished at the higher dose, indicating that INSR inhibition impairs glycolysis, likely contributing to decreased OXPHOS. Similarly, inhibition of PI3K with LY294002 (LY) progressively reduced OCR in a dose-dependent manner (Fig. 7h), decreasing basal respiration, maximal respiration, and ATP production (p < 0.05 to p < 0.01, Fig. 7i). Given PI3K-AKT’s role in glycolytic regulation,33 ECAR analysis post-LY treatment showed a pronounced decrease in glycolysis (Supplementary Fig. 9c–e). Total ATP production also declined (p < 0.001), driven by a significant drop in glycolysis-derived ATP (p < 0.0001), while OXPHOS-derived ATP remained unchanged (Fig. 7j), indicating diminished glucose-derived ATP synthesis. Finally, RT-qPCR confirmed that V-MBG-induced upregulation of M2 markers (Arg1, Chil3, Mrc1) was dose-dependently reversed by LY (p < 0.05; Fig. 7k), paralleled by a reduction in Arg1 protein expression (Supplementary Fig. 9f, g), underscoring PI3K-AKT signaling as critical for macrophage M2 polarization.
Furthermore, the role of GLUT4-mediated glucose uptake in activating mitochondrial OXPHOS and M2 polarization was determined by employing Fasentin, a specific GLUT4 inhibit. GLUT4 inhibition evidently reduced OCR in macrophages (Supplementary Fig. 10a, c, e), significantly decreasing basal respiration, maximal respiration, and ATP production (p < 0.05 to p < 0.0001; Supplementary Fig. 10b, d, f). Concurrently, the V-MBG-induced upregulation of key M2 markers (Arg1, Chil3, Mrc1) at both the gene and protein (Arg1) levels was significantly reversed by Fasentin (p < 0.01; Supplementary Fig. 10g–i). These results establish GLUT4-mediated glucose uptake as a critical driver of the mitochondrial OXPHOS essential for macrophage M2 polarization.
Collectively, these data demonstrate that V-MBG–released vanadium ions activate INSR, triggering the PI3K-AKT axis to promote GLUT4-mediated glucose uptake and enhance metabolic flux via increased IDH3A expression, thus synergistically elevating mitochondrial OXPHOS and driving macrophage polarization toward the M2 phenotype (Fig. 7l).