
LAG-3 negatively regulates T-cell functions and TCR signaling in cooperation with PD-1, resulting in resistance to conventional immunotherapies. Hence, LAG-3/PD-1 coblockade has recently entered clinical practice. However, their specific mechanisms of action in establishing T-cell dysfunction in cancer are largely unknown. Here, extensive protein and phosphoprotein signatures of TCR signalosome inhibition were identified for PD-1/LAG-3 cosignaling (Fig. 1a). PD-1/LAG-3 cosignaling converges on MYC as an inhibited master regulator, which rewires the TCR:CD3 signalosome (Fig. 1a). Key terminators of TCR signaling were regulated by PD-1/LAG-3 (Fig. 1a). Moreover, only targeted MYC inhibition in T-cells emulated PD-1/LAG-3 cosignaling via key representative pathways and features (Fig. 1b). Multiomic analyses of an extensive collection of LAG-3 mutants in its conserved motifs highlighted the critical role of KIEELE/EP in suppressive functions (Fig. 1c) and the major role of EP as a MYC regulator (Fig. 1d). Our results reveal a novel molecular mechanism by which PD-1/LAG-3 reprograms T-cells through the inhibition of MYC regulation.

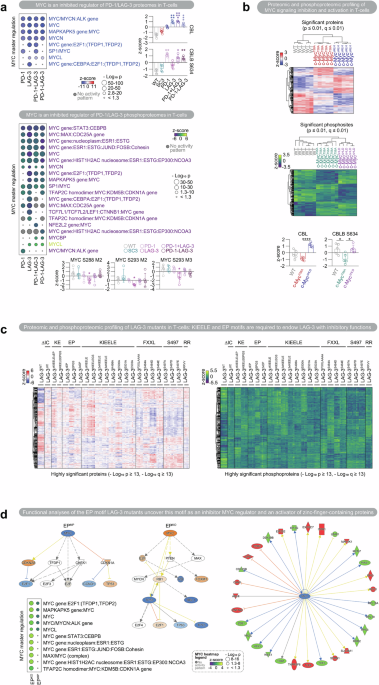
Proteomic and phosphoproteomic profiling of PD-1/LAG-3 signaling in T-cells. a Identification of MYC as an inhibited regulator of PD-1/LAG-3 proteomes and phosphoproteomes in T-cells. Heatmaps of the enriched MYC master regulators associated with the differential proteomic and phosphoproteomic profiles. Red and yellow, z-score > 0; blue and purple, z-score < 0; gray, z-score not predicted. The quantitative expression of CBL on the differential PD-1/LAG-3 proteomes compared with that in SC3 control cells is shown. The levels of the phosphoproteins MYC and CBLB in the differential PD-1/LAG-3 phosphoproteome compared with those in the SC3 control cells are shown. b Proteomic and phosphoproteomic profiling of MYC signaling inhibition and activation in T-cells. Up: Heatmaps of regulated proteins and phosphoproteins from T-cells expressing active (c-MYCT58A) or inactive (c-MYCΔHLH) MYC mutants, with unmodified cell lines used as controls. Heatmap tree structures represent hierarchical clustering on the basis of Euclidean distances. Red and yellow, z-score > 0; blue and purple, z-score < 0. p and FDR/q ≤ 0.01 proteins and phosphoproteins are plotted. Down: Quantitative expression of CBL in the differential MYC proteomes and phosphoproteomes compared with WT control cells as a common comparative standard. c Wide-range characterization of T-cell proteomes and phosphoproteomes associated with the expression of LAG-3 mutants. Heatmap of regulated proteins and phosphoproteins from T-cell lines expressing the indicated LAG-3 mutants, with LAG-3WT-cell lines used as controls. Heatmap tree structures represent hierarchical clustering on the basis of Euclidean distances. Red and yellow, z-score > 0; blue and purple, z-score < 0. Proteins and phosphoproteins with p and FDR/q ≤ 10-13 values are plotted. d Functional analysis of T-cells expressing EP knockout (EPKO) and overactivation (EPMP) motif mutants. Regulatory networks of MYC, as an upstream regulator of the EPKO and EPMP differential phosphoproteomic signatures are shown. The regulatory network of the activated TCR complex as an upstream regulator of the EPKO differential phosphoproteomic signatures is shown. A heatmap of enriched MYC master regulators associated with the indicated differential phosphoproteomic signatures is shown. Yellow, z-score > 0; purple, z-score < 0. Data information: Statistical comparisons are shown in the graph as indicated in the Methods section. Perseus was used for statistical analyses of proteomic and phosphoproteomic data. Briefly, one-way ANOVA was used for multiple comparisons, followed by a posteriori Tukey’s pairwise comparisons. An unpaired Student’s t test was used for direct comparisons between two groups. Differential molecules versus their control were identified, following the p-value and FDR/q ≤ 0.05, Log2 (fold change) ≥ 0.38 and Log2 (fold change) ≤ −0.38 criteria. “M” indicates peptide multiplicity: the number of target PTM occurrences on the collapsed peptidespeptide, with “3” marking three or more. For MYC phosphorylation, as shown in Fig. 1a, all peptide multiplicities are shown. For the rest of the figures, the most significant peptide multiplicity is shown. For functional analyses, QIAGEN IPA algorithms were used (accessed in 2024). The IPA utilizes two scores for inference: p-values from Fisher’s exact test to obtain an enrichment score and a z-score to assess the match of observed and predicted regulation patterns. *, indicates q < 0.05; **, indicates q < 0.01; ***; indicates q < 0.001; ****, indicates q < 0.0001; *****, indicates q = 0. The error bars correspond to ±SDs
First, to identify the effect of PD-1/LAG-3 on the TCR signalosome, PD-1/LAG-3 signaling was selectively and constitutively activated in Jurkat T-cells as described previously1 (Supplementary Methods). MYC was identified as an inhibited master upstream regulator of the PD-1/LAG-3 proteomes/phosphoproteomes (Fig. 1a). To our knowledge, this is the first study showing that PD-1/LAG-3 signaling is associated with MYC regulation to reprogramme T-cells. Importantly, the MYC S288/S293 residues were significantly dephosphorylated in the LAG-3 signature (Fig. 1a). The functional consequences of the phosphorylation/dephosphorylation of these two residues remain unknown. Thus, we propose that S288/S293 could be novel regulatory residues associated with LAG-3 signaling. MYC inhibition was corroborated in PDCD1/LAG3+ tumor-infiltrating T-cells from more than 500 cancer patients via single-cell sequencing (Supplementary Methods). Nevertheless, further experimental validation is needed to establish the functional role of the identified residues associated with PD-1/LAG-3 signaling.
We and others have shown that PD-1 and LAG-3 cosignaling regulates T-cell functions through CBL ubiquitin ligases.1,2 In addition, the activities of E3 ubiquitin ligases lead to the suppression of MYC-dependent processes. Here, CBL-B and its binding protein SH3KBP1 were hyperphosphorylated following PD-1/LAG-3 signaling (Fig. 1a). Importantly, we identified a novel phosphorylation site in CBL-BS634 associated with PD-1/LAG-3 (Fig. 1a). Thus, it is tempting to speculate that PD-1/LAG-3 signaling mechanisms could reinforce CBL-B functions through this phosphorylation.
A phosphosignature indicative of an inhibited TCR signalosome was found in all PD-1/LAG-3 profiles (Fig. 1a). Our study revealed that LCK is dephosphorylated at its activating site Y394. This effect was significant for LAG-3 signaling, which presented dephosphorylated LCK at several residues. Thus, we speculate that PD-1/LAG-3 signaling triggers the mechanism of LCK dephosphorylation, leading to CD3 dephosphorylation and abrogation of TCR:ZAP70 downstream signaling. These findings could shed light on the LAG-3:LCK-mediated mechanism of TCR downmodulation, as proposed elsewhere.3,4
To determine whether PD-1/LAG-3 regulation could be driven by selective and targeted MYC inhibition, the proteome/phosphoproteome of inactive or active MYC mutant T-cells was obtained (c-MYCΔHLH/c-MYCT58A) (Fig. 1b). Similar cell processes were regulated in T-cells expressing c-MYCΔHLH compared with those expressing PD-1/LAG-3. MYC and core TCR complex components were inhibited upstream regulators but activated with c-MYCT58A as a functional control (Fig. 1b). A c-MYCΔHLH-targeted signature was extracted, highlighting MAX hypophosphorylation and specific ubiquitin ligase enrichment, including CBL-BS634 hyperphosphorylation and CBL upregulation (Fig. 1b).
Finally, we addressed the contribution of LAG-3 motifs to its regulatory activities. LAG-3 contains conserved intracytoplasmic motifs: FXXL, KIEELE and EP. However, the functional role of each motif is not well understood, nor is their synergy with PD-1. Here, a proteomic/phosphoproteomic map associated with each motif was generated (Fig. 1c). Notably, the PD-1/LAG-3-mediated TCR downmodulation signature was reversed upon KIEELE/EP double KO (ΔKE and KEGS, Supplementary Methods), including MYC (S288/S293/S347), CD3 and ZAP70 hyperphosphorylation (Fig. 1c).
Importantly, the EP motif was found to be a regulator of MYC inhibition (Fig. 1d). None of the profiles associated with KIEELE or FXXL showed significant changes in MYC phosphorylation, whereas MYC was significantly hypophosphorylated when EP was multiplied (EPMP), especially at S62, which leads to MYC degradation. S344 was also identified as a potential EP regulatory residue associated with LAG-3 signaling. In contrast, when EP was eliminated (EPKO), the MYC binding protein MAX and the MYC-induced transcription factor AP4 were upmodulated. MYC is an inhibited master regulator of EPMP and activated in EPKO (Fig. 1d). Intriguingly, a zinc-finger phosphosignature was associated with EP (Fig. 1d). ZNF148 was hyperphosphorylated with EPMP and hypophosphorylated with EPKO. However, although it has been proposed that ZNF148 may be involved in TCR signaling and that its transcription is regulated by MYC, its functional role in T-cells remains unclear.5 As EP has been proposed to mediate LAG-3 recruitment of Zn2+ to dissociate LCK from CD4/CD8,4 we hypothesize that an EP-mediated mechanism regulated by zinc fingers through MYC inhibition contributes to TCR signal transduction termination.
In summary, the regulatory effects of PD-1/LAG-3 on the TCR signalosome were studied via proteomics/phosphoproteomics. Despite the multiomic and computational nature of our results, they provide highly valuable information on the mechanistic synergy of LAG-3 with PD-1, allowing a better understanding of LAG-3 mechanisms leading to immune inhibition. Importantly, MYC was computationally identified as an inhibited master regulator of the PD-1/LAG-3 proteome/phosphoproteome, which led to concerted downmodulation of the TCR signalosome. However, other synergistic or redundant mechanisms between LAG-3/PD-1 and other immune checkpoints could play a role in MYC regulation. A limitation of this study is the use of Jurkat cells to derive multiomic data. Additional validation in primary and in vivo T-cell models will be needed to characterize the PD-1/LAG-3/MYC mechanism of action further.
Analyses of the data from the mutations in EP/KIEELE motifs highlighted these domains as critical for LAG-3 inhibitory functions and, importantly, the role of EP as a MYC regulator. In conclusion, PD-1/LAG-3 regulate the inhibition of MYC in T-cells, shedding light on LAG-3 biology and suggesting many interesting mechanistic and clinical hypotheses. More experimental validation is needed to evaluate the clinical impact of anti-neoplastic treatments combining immunotherapy with MYC inhibitors.