
High-yield and scarless cmRNA synthesis via an engineered PIE
First, we engineered a new PIE platform based on the Anabaena tRNALeu gene with high yield and no extraneous nucleotides inserted into the cmRNA product. The rationale behind engineered PIE is to functionalize a selected 5’ end (termed E2’) and 3’ end (termed E1’) of the GOI as functions of E2 and E1 of classical PIE, respectively. As illustrated in Fig. 1a, the scarless cmRNA precursor in our engineered PIE consists of the 3’ half of the ribozyme, the GOI (which includes E2’ and E1’ surrogates at the ends of the GOI), and the 5’ half of the ribozyme. This rational design enables us to synthesize scarless cmRNA products while maintaining the high yield advantages of classical PIE.

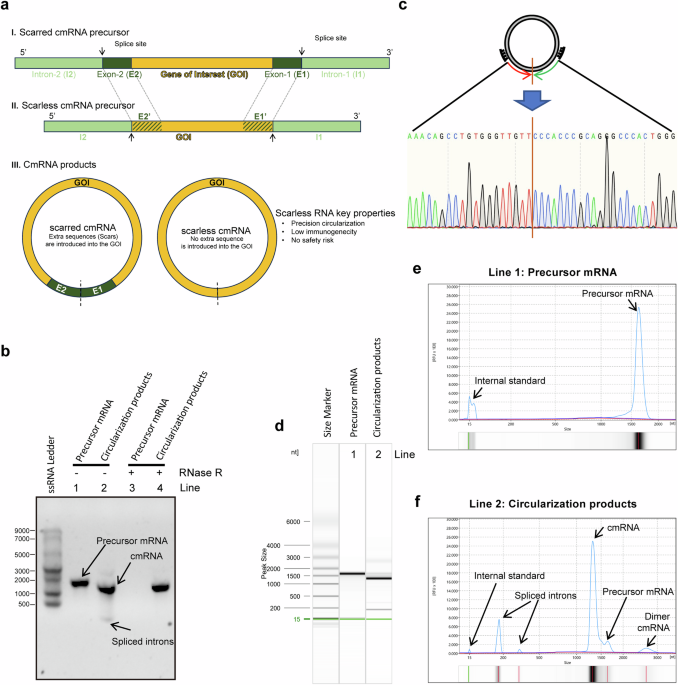
Highly efficient synthesis of scarless circRNAs via an engineered PIE-based circularization strategy. a Engineering strategy for scarless circular RNA synthesis. The classical PIE strategy keeps E1 and E2 residues in circular RNA products (scar circRNA), whereas the engineered new strategy generates scarless RNA products (scarless circRNA). b Confirmation of the generation of circular-form RNA molecules after circularization reactions via RNase R and RNase H treatments. c Confirmation of the precise sequence around the self-splicing junction site via Sanger sequencing. d–f Quantitative measurements of circularization reactions via capillary electrophoresis. The capillary electrophoresis separation results are shown as digital gel image bands (d) and classical peaks (e, f). The circularization efficiency was calculated as 100% * the area of the cmRNA peak/(the area of the cmRNA peak + the area of the precursor mRNA peak)
RNase R treatment of the precursor mRNA and cmRNA products confirmed the circular format of the products after the circularization reactions, which were resistant to RNase R while the linear precursor mRNAs were digested (Fig. 1b and Supplementary Fig. 1a, b). Circular mRNA products were also confirmed by poly(A) polymerase (Supplementary Fig. 1b) and RNase H endonuclease (Supplementary Fig. 1c). Sanger sequencing revealed that the RNA sequence near the self-splicing junction site was identical to that of the designed cmRNA (Fig. 1c and Supplementary Fig. 1d), confirming the scarless ability of our engineered PIE. Capillary electrophoresis allows us to quantitatively measure the circularization yields, and the results showed that the desired cmRNA accounted for ~90% yield, which is comparable to classical PIE (Fig. 1d–f and Supplementary Fig. 1e, f). The high yield of our engineered PIE is very amenable for downstream processes such as purification and scale-up. For example, RNase R treatment was able to completely digest linear molecules and yield cmRNA with high purity (Supplementary Fig. 1g). In addition, the low immunogenicity of the yield cmRNA was confirmed by the determination of IL-6, DDX58, CCL5, TLR3, and IFNB1 in the interferon-sensitive cell line A549 (Supplementary Fig. 2). For simplicity, we named our engineered PIE Hi-Scarless-PIE (high-yield and scarless PIE) hereafter.
Robust protein expression of synthesized scarless cmRNAs in vitro and in vivo
Next, we examined the translation capability of scarless cmRNA produced by Hi-Scarless-PIE in cell lines and in mice. We synthesized cmRNAs using the CVB3 IRES as the translation initiation module to translate the GLuc CDS (CVB3-GLuc). Linear GLuc mRNA (5’-capped, m1Ψ modified, and Poly(A) tailed) and scarred CVB3-GLuc cmRNA (produced by the PIE_176 nt scar version) were synthesized as controls (Fig. 2a). As shown in Fig. 2b, both scarred and scarless cmRNAs presented prolonged protein expression durations compared with those of linear mRNAs in HEK-293T cells. cmRNA-based protein expression lasted for approximately 4.5 days to reach the so-called “half-life” (here, the approximate time point at which the expression level decreased to half of the expression level on day 1), whereas the protein expression half-life of linear mRNA was approximately 2.5 days. The expression of GLuc was clearly detectable on day 7 for cmRNAs but sharply decreased on day 3 and was almost undetectable after day 4 for linear mRNAs. These results demonstrated that cmRNA driven enhanced and prolonged protein expression in vitro. Moreover, we tested the protein expression capability of scarless cmRNA produced by Hi-Scarless-PIE for other GOIs, including human erythropoietin (hEPO) and EGFP (Fig. 2c, d).

Robust protein expression of synthesized real-scarless cmRNAs in vitro and in vivo. a Schematic illustrations depicting the architectural configurations of linear RNA, scarred circular mRNA, and scarless circular mRNA. b Expression dynamics of GLuc mRNA in linear, scarred circular, and scarless circular mRNA formats in HEK-293T cells. c, d Expression of hEPO and EGFP scarless cmRNAs in HEK-293T cells was observed via fluorescence microscopy (c) or ELISA (d). e Illustration of the formulation process of LNPs encapsulating scarless cmRNA using a microfluidics mixer. f Size distributions of LNP-cmRNA particles for scar cmRNA (left) and scarless cmRNA (right). g The expression of GLuc cmRNA in mice after intramuscular injection of 5 µg of LNP-cmRNA per mouse was measured via bioluminescence imaging. h The fluorescence intensities of the mice in (g) are presented. The error bars indicate the SEM (two-way ANOVA; *P < 0.05; ns, not significant)
To test the in vivo protein expression of scarless cmRNAs, we formulated FLuc-coding cmRNAs with lipid nanoparticles (LNPs) via a microfluidics mixer (Fig. 2e). The formulated LNP-cmRNA exhibited an appropriate average particle diameter (~75.0 nm), PDI (<0.15), zeta potential (−5 ~ 5 mV), and encapsulation efficiency (~90%) (Fig. 2f and Supplementary Fig. 3). Intramuscular injection of 5 µg of LNP-cmRNA resulted in potent FLuc protein expression for cmRNA, and the expression lasted for 14 days (Fig. 2g). Although there was considerable interindividual variation among the mice, scarless cmRNAs consistently elicited higher FLuc expression than their scarred counterparts did on days 1, 3, and 7, with a statistically significant difference detected on day 3 (*p < 0.05) (Fig. 2h).
Scarless cmRNAs exhibit enhanced and prolonged CAR expression in primary human T cells
To compare the translational potential of circular versus linear mRNAs for CAR-T-cell engineering, we generated anti-CD19 CAR-T cells and anti-GPRC5D CAR-T cells by electroporating primary human T cells with either linear mRNAs or cmRNAs (Fig. 3a, b). The surface expression of the CARs was assessed via the use of PE-labeled human CD19 (20-291) protein or MonoRabTM rabbit anti-scFv cocktail. In the linear mRNA group, CAR expression peaked within 6 h post-electroporation and began to decrease, reaching undetectable levels by the fourth day post-transfection. In contrast, cmRNA-driven CAR expression peaked one day after transfection and was sustained for two days; thereafter, it began to decrease, with undetectable levels measured by the seventh day post-transfection. These data suggested that cmRNAs confer a more sustained expression profile in T cells (Fig. 3c–f and Supplementary Fig. 4a, b). Moreover, quantitative analysis of fluorescence intensity further revealed that cmRNA-transfected T cells presented a greater median fluorescence intensity (MFI) at peak expression than the linear mRNA group did, indicating increased CAR density on the T-cell surface (Fig. 3g, h). These findings suggest a greater density of CAR-T cells within the circular cohort than in the linear cohort, suggesting that the CAR-T cells in the circular groups presented increased cytotoxic potential (Fig. 3g, h). Consistent with these findings, RT‒qPCR analysis demonstrated that cmRNA exhibited greater stability and a significantly extended intracellular half-life relative to its linear counterpart (Supplementary Fig. 4c, d). In summary, the aforementioned results establish scarless cmRNAs as a potent platform for achieving sustained and high-level CAR expression in primary human T cells, with clear implications for improving the performance of mRNA-based cell therapies.

Scarless cmRNAs enhanced and prolonged the protein expression of the CD19 CAR on primary human T cells. a, b Structures of CAR-encoding cmRNA and second-generation anti-CD19 CAR (a) or anti-GPRC5D CAR (b). c, d Primary human T cells were activated and transfected with linear mRNAs (blue), scarred cmRNAs (green) or scarless cmRNAs (red) on day 4. Representative histograms of CAR expression analysis from 6 h to 7 days after transfection. PE-labeled human CD19 (20-291) protein was used for anti-CD19 CAR detection, MonoRabTM Rabbits Anti-scFv Cocktail (PE) was used for anti-GPRC5D CAR detection, and Zombie VioletTM Dye was used to exclude dead cells. e, f Proportion of CAR-expressing cells indicated by anti-CD19 CAR+ cells (E) and anti-GPRC5D CAR+ cells (F) from 6 h to 7 days post-transfection (n = 3 independent experiments/donors). g, h The median intensity of CAR expression from 6 h to 7 days post-transfection (n = 3 independent experiments)
cmCAR-T cells demonstrate potent cell-killing activities, specifically against malignant cells
We next evaluated the in vitro cytotoxicity of linear mRNA-based CAR-T (mCAR-T) and cmRNA-based CAR-T (cmCAR-T) cells via coculture assays with relevant tumor targets. For anti-CD19 CAR-T cells, CD19-positive NALM-6 and Raji cells, as well as CD19-negative K562 cells, were used as target populations (Supplementary Fig. 5a). For anti-GPRC5D CAR-T cells, we selected GPRC5D-positive MM.1S and RPMI-8226 cells, alongside GPRC5D-negative K562 cells (Supplementary Fig. 5b). CAR-T cells were cocultured with target cells at effector-to-target (E:T) ratios of 1:1, 2:1, and 5:1 for 16 h. Untransfected T cells were used as negative controls. The strengths and variations of the three types of CAR-T cells were assessed via flow cytometry. In the context of anti-CD19 CAR-T cells, both CAR-T-cell variants induced near-complete lysis of CD19-positive neoplastic cells while sparing their CD19-negative counterparts under diverse coculture ratios on the initial day following transfection (Fig. 4a and Supplementary Fig. 6a). By the fourth day post-transfection, the cytolytic activity of the mCAR-T cells had declined substantially. The killing efficiency of mCAR-T cells against NALM-6 cells decreased to 40–60%, and these cells failed to elicit measurable cytotoxicity against Raji cells. In contrast, the cmCAR-T cells maintained robust activity, eliminating 75–100% of the NALM-6 cells and 35–80% of the Raji cells (Fig. 4c). A similar pattern was observed with anti-GPRC5D CAR-T cells. While both CAR-T-cell variants were effective against MM.1S and RPMI-8226 cells on day 1, only cmCAR-T cells retained strong cytotoxic function by day 3, resulting in 50–95% lysis of MM.1S cells and 35–55% lysis of RPMI-8226 cells. mCAR-T cells showed markedly reduced activity, with 25–45% lysis of MM.1S and 10–35% lysis of RPMI-8226 cells (Fig. 4b, d and Supplementary Fig. 6b). Collectively, these outcomes substantiated the superior cytotoxic potency of cmRNA-based CAR-T cells against antigen-positive malignant cells, in line with their enhanced expression kinetics and stability.

cmCAR-T cells exhibited potent target cell-killing activities with increased cytokine release. a, b One day after transfection, anti-CD19 CAR-T cells generated from linear mRNAs, scarred cmRNAs, or scarless cmRNAs were cocultured with NALM-6 or Raji cells (a), and anti-GPRC5D CAR-T cells from the same mRNA platforms were cocultured with MM.1S or RPMI-8226 cells (b). c, d Four days after transfection, anti-CD19 CAR-T cells generated from linear mRNAs, scarred cmRNAs, or scarless cmRNAs were cocultured with NALM-6 or Raji cells (c), and anti-GPRC5D CAR-T cells from the same mRNA platforms were cocultured with MM.1S or RPMI-8226 cells (d). All cocultures were conducted at effector-to-target (E:T) ratios of 1:1, 2:1, and 5:1 for 16 h. e–j IFN-γ release (e), TNF-ɑ release (g), and IL-2 release (I) by linear mRNA-, scarred cmRNA- or scarless cmRNA-based anti-CD19 CAR-T cells after 16 h of coculture with NALM-6 or Raji cells. IFN-γ release (f), TNF-α release (h), and IL-2 release (j) by linear mRNA-based, scarred cmRNA-based or scarless cmRNA-based anti-GPRC5D cells after 16 h of coculture with MM.1S or RPMI-8226 cells. Untransfected (UTD) T cells were used as a negative control. The data are presented as the means ± SDs (n = 3 independent experiments; two-way ANOVA; *P < 0.05; **P < 0.01; ***P < 0.001; ns, not significant)
cmCAR-T cells elicit enhanced cytokine responses upon antigen engagement
To further evaluate effector function, we quantified the secretion of key cytokines, including interferon gamma (IFN-γ) and tumor necrosis factor alpha (TNF-α), which are critical for T-cell-mediated cytotoxicity, as well as interleukin-2 (IL-2), a marker of CAR-T-cell activation and persistence following the coculture of CAR-T cells with target tumor cells. As shown in Fig. 4e–j, untransfected T cells did not release detectable levels of the aforementioned cytokines when exposed to either CD19- or GPRC5D-positive tumor cells. Similarly, both mCAR-T cells and cmCAR-T cells failed to produce cytokines in response to antigen-negative targets, confirming the antigen specificity of the response (Supplementary Fig. 6c, d). Upon stimulation with antigen-positive tumor cells, both linear mRNA- and cmRNA-based CAR-T cells exhibited dose-dependent cytokine production. Notably, the cmRNA-based CAR-T cells produced significantly higher levels of IFN-γ, TNF-α, and IL-2 than did their linear mRNA counterparts across all tested E:T ratios (Fig. 4e–j). This trend was observed for both anti-CD19 CAR-T cells (Fig. 4e, g, i) and anti-GPRC5D CAR-T cells (Fig. 4f, h, j), in accordance with their enhanced cytolytic activity.
Dynamic changes in the transcriptomic profiles of mCAR-T cells and cmCAR-T cells over time
Several studies have revealed that CAR-T cells produced in different ways46 and CAR-T cells in patients with different outcomes (e.g., responders and long-term remission patients) have different transcriptomic profiles.47,48,49 Therefore, we conducted RNA-seq experiments in an attempt to understand the differences in cell killing and cytokine release behaviors between mCAR-T cells and cmCAR-T cells from a transcriptional perspective. Overall, untransfected T cells, cmCAR-T cells, and mCAR-T cells were distinctly different from each other on days 2 and 4, as indicated by the PCA dimension reduction analysis at the transcriptomic level shown in Fig. 5a. The GZMB gene expression level in cmCAR-T cells was significantly greater than that in mCAR-T cells on both day 2 and day 4 (Fig. 5b), which is in line with our previous results that cmCAR-T cells showed greater cytotoxic activity than mCAR-T cells did (Fig. 4). The representative coinhibitory genes PDCD1, TIGIT, LAG3 and CTLA4 presented different expression levels and changes (Fig. 5b and Supplementary Fig. 7). The absolute expression levels of PDCD1 (0.2–3.5 TPM) in all groups were much lower than those of TIGIT (20–40 TPM). Transfection of the mCAR or cmCAR resulted in increased expression of TIGIT on day 2 but decreased expression on day 4 compared with the control baseline (Supplementary Table 2). This finding might suggest that different transcriptomic profiles of CAR-T functional gene signatures differ between mCAR-T cells and cmCAR-T cells at different time points.

Transcriptomic profiles of mCAR-T and cmCAR-T cells on days 2 and 4 posttransfection. a Distribution of all samples under PCA dimensionality reduction analysis. b The expression levels (TPMs) of the GZMB and PDCD1 genes across groups. c The expression profiles of T-cell activation, coinhibitory, exhaustion, and cytotoxic gene signatures were visualized via a heatmap. d Differentially expressed genes (DEGs) between cmCAR-T cells and UTDs and DEGs between mCAR-T cells and UTDs were projected on the x-axis and y-axis, respectively, according to their log2FC values. Representative genes involved in T-cell activation, exhaustion, and cytotoxicity are labeled with gene names. e Enriched biological processes and signaling pathways of upregulated DEGs in cmCAR-T cells compared with mCAR-T cells on days 2 and 4 posttransfection (**P < 0.01, ****P < 0.0001)
Therefore, we visualized well-documented gene signatures related to T-cell activation, coinhibitory signals, T-cell exhaustion, and T-cell cytotoxicity via a heatmap (Fig. 5c). The dendrogram at the top of the heatmap shows that the control T-cell samples, mCAR-T-cell samples, and cmCAR-T-cell samples were clearly clustered into 3 clusters according to the heatmap hierarchical clustering algorithm, indicating obviously different overall patterns of these gene signatures between mCAR-T- and cmCAR-T-cell populations. To visualize the distribution of these gene signatures across the whole transcriptomic landscape, we performed DEG analysis and plotted all genes according to their log2FC values in both the mCAR-T-vs-Control and cmCAR-T-vs-Control DEG analyses. As shown in Fig. 5d, on day 2, 236 significantly upregulated DEGs were detected in both mCAR-T cells and cmCAR-T cells, including those encoding cytotoxic genes (GZMB, GZMH) and T-cell activation markers (CD69, GNLY, EGR1, EGR2, EGR3), whereas many T-cell exhaustion and coinhibitory signaling genes (TIGIT, CTLA4, PDCD1, TOX, and LAG3) did not significantly differ between mCAR-T cells and cmCAR-T cells compared with control T cells, except for PHLDA1 and LAYN. However, many of those T-cell activation- and cytotoxicity-related genes did not reach the DEG threshold on day 4, except that LAYN (a T-cell exhaustion marker) was significantly upregulated only in mCAR-T cells. To further understand the differences in transcription between mCAR-T cells and cmCAR-T cells, we directly compared cmCAR-T cells with mCAR-T cells via DEG analysis. There were 113 and 232 upregulated DEGs in cmCAR-T cells on days 2 and 4, respectively. Enrichment analysis revealed that these DEGs were significantly overrepresented in several cytokine signaling pathways on day 2 and interferon signaling on day 4 in cmCAR-T cells (Fig. 5e), which is in agreement with previous data (Fig. 4e–j and Supplementary Table 2). Moreover, as shown in Supplementary Fig. 8, prolonged CAR expression may induce transcriptomic differences between mCAR-T cells and cmCAR-T cells, including alterations in transcriptional programs; innate immune sensing of RNA constructs; and differences in metabolic, memory-related, and translational features.
Collectively, these findings suggest that T-cell activation and cytotoxic signals might differ between mCAR-T cells and cmCAR-T cells and that CAR-T functional signals are transient in both mCAR-T cells and cmCAR-T cells; however, cmCAR-T cells exhibit enhanced and prolonged cytotoxicity compared with mCAR-T cells.
Anti-CD19 CAR-T cells eliminate NALM-6 cells in a mouse model
To further investigate the in vivo persistence of mCAR-T and cmCAR-T cells, we administered CAR-T cells one day post-electroporation via tail vein injection at a dose of 3×10⁶ cells per mouse (Fig. 6a). Blood samples were collected on day 1, 3, and 5 postinjection to assess the duration of CAR-T-cell presence within the mice. As depicted in Fig. 6b, CAR-T cells were detectable on the first day post-injection, with the unmodified and modified linear mRNA groups constituting 32% and 47% of the total number of circulating T cells, respectively, while the number of T cells in the circular mRNA groups surpassed 80%. By the third day post-injection, unmodified linear mRNA-based CAR-T cells were undetectable, the percentage of modified linear mRNA-based CAR-T cells had decreased to 18%, whereas the percentage of circular mRNA-based CAR-T cells had remained greater than 50%. These findings are in accordance with previous in vitro results, indicating that cmRNA-based anti-CD19 CAR-T cells exhibited prolonged persistence in vivo. We subsequently evaluated the therapeutic timing and dosage for the cmRNA group. As shown in Fig. 6c, 1 × 10⁶ luciferase-labeled NALM-6 (NALM-6-luc) cells were injected into each mouse on day 0. Tumor proliferation within the mice was monitored through bioluminescence imaging, with imaging conducted on the third day, indicating the commencement of treatment. The low-dose and high-dose groups received injections of 1 × 10⁶ and 3 × 10⁶ cmRNA-based anti-CD19 CAR-T cells per mouse, respectively. The treatment was conducted every four days three times. Bioluminescence imaging results indicated that the tumor burden in both the low-dose and high-dose treatment cohorts was significantly lower than that in the untransfected group. Following three rounds of treatment, a trend toward increased tumor proliferation was observed within the low-dose group, with one particular instance of growth noted. Moreover, high-dose treatment resulted in more efficacious tumor clearance than did low-dose treatment (Fig. 6d–f). These findings suggest that a dosage regimen of 3 × 10⁶ CAR-T cells coupled with an increased frequency of treatment may be warranted.

Anti-CD19 CAR-T cells eliminated NALM-6 cells in vivo. a, b Schematic diagram and detection of the persistence of CAR-T cells in mice via flow cytometry; n = 3 mice per group. c Schematic diagram of the NALM-6 tumor model and procedure of scarless cmRNA-based anti-CD19 CAR-T-cell infusion time and dose. d Bioluminescence imaging analysis of NALM-6 tumors; n = 5 mice per group. e, f The tumor burden was quantified as the total flux (each line represents a single mouse) or mean flux from the luciferase intensity of each mouse, and the green dashed line represents the background value. The data are presented as the means ± SEMs (two-way ANOVA; *P < 0.05; **P < 0.01; ***P < 0.001)
cmRNA-based CAR-T cells elicit potent antitumor efficacy in vivo
We next assessed the feasibility and efficacy of cmRNA-based CAR-T cells in xenograft models of B-cell lymphoma and multiple myeloma. In a B-cell lymphoma model, NCG mice were intravenously inoculated with 1 × 10⁶ NALM-6-luc cells on day 0, followed by infusion of 3 × 10⁶ untransfected T cells, linear mRNA-, scarred cmRNA- or scarless cmRNA-based anti-CD19 CAR-T cells on day 3 (Fig. 7a). Longitudinal bioluminescence imaging revealed that, compared with control mice, cmRNA-based CAR-T cells significantly reduced the tumor burden (Fig. 7c, d). A similar trend was observed in the multiple myeloma model, in which 2 × 10⁶ MM.1S-luc cells were engrafted and treated with anti-GPRC5D CAR-T cells (Fig. 7b). Again, cmRNA-based CAR-T cells demonstrated superior tumor control over linear mRNA-transfected T cells and untransfected controls (Fig. 7e, f). Moreover, significant body weight loss was observed in the control groups due to the severe tumor burden, whereas a relatively stable body weight was observed in the groups infused with cmRNA-based CAR-T cells (Fig. 7g). Notably, cmRNA-based CAR-T-cell treatment markedly prolonged survival compared with that of the other groups (Fig. 7h). On day 12, peripheral blood samples were collected to detect CAR-T cells, and the data revealed a significantly greater frequency of CAR-T cells in the cmRNA groups than in the linear mRNA cohort (Fig. 7i and Supplementary Fig. 9). By day 20, cmRNA-treated mice also presented an increased proportion of memory T cells, indicating enhanced persistence and functional longevity of the engineered T cells (Fig. 7j and Supplementary Fig. 9, Fig. 10).

cmCAR-T cells outperform mCAR-T cells in eliminating target cells in vivo. a, b Schematic diagram of the NALM-6 tumor model and procedure of linear mRNA-, scarred cmRNA- or scarless cmRNA-based anti-CD19 CAR-T-cell infusion time and dose (a). Schematic diagram of the MM.1S tumor model and procedure of linear mRNA-, scarred cmRNA- or scarless cmRNA-based anti-GPRC5D CAR-T-cell infusion time and dose (b). The tumor burden was monitored via bioluminescence imaging analysis; n = 5 mice per group. c, d NALM-6 tumor burden was quantified as the total flux (c, each line represents a single mouse) or mean flux (d) from the luciferase intensity of each mouse. The purple dashed line represents the background value. e, f MM.1S tumor burden was quantified as the total flux (E, each line represents a single mouse) or mean flux (f) from the luciferase intensity of each mouse. The purple dashed line represents the background value. g, h Body weight change curves (g) and survival curve analysis (h) of the mice in the different treatment groups in the NALM-6 tumor model. i On the twelfth day of the experiment (a), the proportion of anti-CD19 CAR-T cells was determined by flow cytometry. j On the twentieth day of the experiment (a), the proportion of memory T cells was assessed by flow cytometry (***P < 0.001)
To benchmark against a clinical standard, we compared scarred cmRNA- and scarless cmRNA-based anti-CD19 CAR-T cells with lentivirus-transduced anti-CD19 CAR-T cells. Both cell types were administered in parallel in the NALM-6 model (Fig. 8a). Bioluminescence imaging demonstrated that cmRNA-CAR-T cells achieved tumor clearance comparable to that of lentiviral CAR-T cells (Fig. 8b–d and Supplementary Fig. 11), supporting the therapeutic equivalence of this nonviral approach. We further assessed CRS by monitoring IL-6, G-CSF, and CRP levels on days 3, 7, and 20 postinfusion. As shown in Fig. 8e–g and Supplementary Fig. 12, no overt CRS symptoms or significant elevations in CRP were observed in any group, likely due to the relatively low initial tumor burden. However, IL-6 and G-CSF levels were significantly elevated in the lentiviral CAR-T-cell group but not in the scarred and scarless cmRNA cohorts, suggesting that cmRNA-based CAR-T-cell therapy may mitigate the inflammatory toxicity associated with viral vector-based therapies. To ensure parity with the lentiviral setting, we also conducted single-infusion studies (Supplementary Fig. 13). In this context, lentiviral CAR-T cells provided the most durable tumor control, yet both scarred and scarless cmRNA-based CAR-T cells significantly outperformed linear CAR-T cells, confirming the advantage of the circular format even after a single dose. Notably, scarless cmRNA-based CAR-T cells maintained tumor suppression longer than their scarred counterparts did, resulting in increased survival on day 35. Collectively, these results demonstrated that cmRNA-based CAR-T cells mediate potent and durable antitumor activity in vivo, with functional persistence and a favorable safety profile, establishing cmRNAs as promising nonviral platforms for CAR-T-cell engineering.

cmCAR-T cells achieved antitumor effects similar to those of lentivirus-transduced CAR-T cells, with the potential to mitigate adverse side effects. a Schematic diagram of the NALM-6 tumor model and procedure of scarless cmRNA-based, scarred cmRNA-based or lentivirus-transduced anti-CD19 CAR-T-cell infusion time and dose. b–d Bioluminescence imaging analysis was used to monitor the NALM-6 tumor burden in the different groups (b). The tumor burden was quantified as the total flux (c, each line represents a single mouse) or mean flux (d) from the luciferase intensity of each mouse. The purple dashed line represents the background value. e–g The serum levels of IL-6 and G-CSF in the different groups were measured via ELISA on the third (e), seventh (f) and twentieth (g) days after CAR-T-cell infusion. The data are presented as the means ± SEMs (n = 3; one-way ANOVA; *P < 0.05; ***P < 0.001; ****P < 0.0001; ns, not significant)