
Study design, patient eligibility and treatment
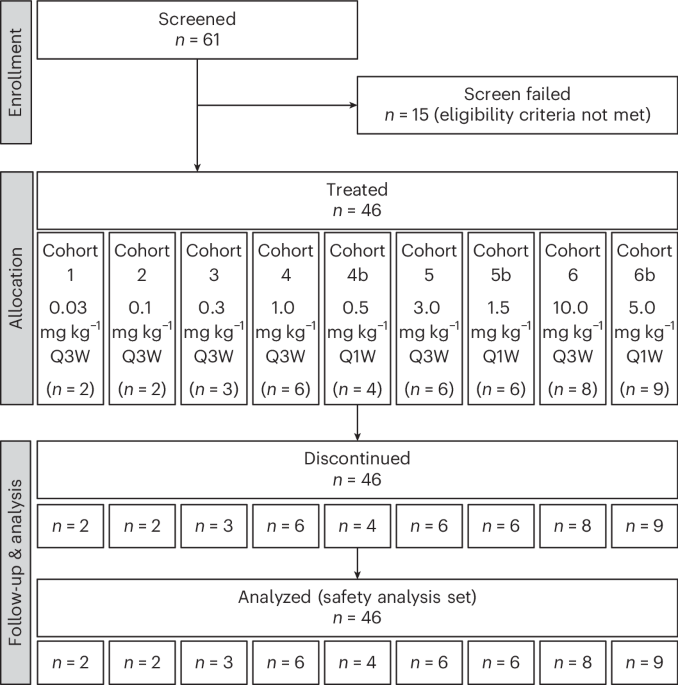
This was a phase 1, first-in-human, open-label, nonrandomized, dose-escalation study designed to assess the safety, tolerability, PK and PD profile of MP0317 (NCT05098405). The dose-escalation part was designed to determine the recommended dose for expansion (RDE) or the MTD for MP0317 monotherapy, while the safety expansion part was designed to confirm safety in a larger population. The dose-escalation scheme used an adaptive study design following a Bayesian logistic regression model (BLRM). The clinical study protocol was approved by the independent ethics committees Sud-Ouest et Outre-Mer II and The Medical Research Ethics Committee NedMec. The study was conducted in accordance with the ethical principles in the Declaration of Helsinki. All 61 participants provided written informed consent. A dose-escalation review committee monitored safety and governed all cohort dosing decisions. The safety expansion part was ultimately not conducted because the safety profile of MP0317 in monotherapy was considered adequately characterized. The study was conducted at two sites in France (Centre Léon Bérard in Lyon and IUCT-Oncopole in Toulouse) and the Netherlands (The Netherlands Cancer Institute in Amsterdam and the Department of Medical Oncology UMC Utrecht). Adult patients were eligible for inclusion if they had an ECOG PS of 0 or 1, and a life expectancy of 12 or more weeks per investigator judgment. Patients were not required to be FAP+ but needed to have measurable disease per RECIST v.1.1 from an advanced, histologically proven solid tumor of one of the protocol-specified types, based on reported FAP expression19,23, and for which approved therapies had been exhausted or for which the investigator considered the patient ineligible or unable to tolerate other treatments: colorectal cancer, ovarian cancer, endometrial cancer, gastric cancer, pancreatic cancer, anal cancer, cervical cancer, head and neck squamous cell carcinoma, mesothelioma, prostate cancer, NSCLC, melanoma, urothelial or bladder cancer, microsatellite-instability-high cancer of any type, cutaneous squamous cell cancer or breast cancer. Exceptionally, patients with other tumor types could be included after discussion with the sponsor based on reported FAP expression and potential benefit from immune therapy. A washout period of 21 days before first study drug administration was requested for prior anticancer treatment, including chemotherapy, hormonal therapy or radiotherapy of 28 days for prior investigational treatment. Mandatory paired tumor biopsies were collected at baseline and on treatment to assess local activation of CD40 within the TME as per the proposed mode of action.
MP0317 was administered intravenously in nine dose-ascending cohorts. Initially a Q3W regimen with up to six dose levels was planned. These dose levels were selected based on a translational PK/PD model linking MP0317 serum exposure levels and the predicted tumor CD40 target occupancy time course, based on potency estimates from an in vitro co-culture assay using human B cells and FAP-transfected CHO cells18. Three additional Q1W dose levels were introduced with a study amendment based on emerging clinical PK data from systemic CD40 agonists, which were not accounted for in the PK and PD model, but suggested a stronger CD40-mediated antigen sink and higher TMDD than predicted37. The Q1W regimen aimed to achieve both a higher extent and a longer duration of CD40 activation within the TME throughout the dosing interval. Patients were treated in 21-day cycles until disease progression, unacceptable toxicity, withdrawal of consent or other reasons to discontinue treatment, whichever occurred first.
The study protocol is included in Supplementary File 1.
Endpoints and assessments
The primary endpoints of the study were safety and tolerability, and identification of the MTD and RDE. Data on AEs and SAEs were collected from signing the informed consent form until 28 days after the last study drug administration or patient end of study. Secondary endpoints were the PK profile and antitumor activity of MP0317. Assessments for the latter included ORR and DCR according to RECIST v.1.1 and iRECIST (modified RECIST in cancer immunotherapy studies), as well as PFS. A patient’s disease was considered controlled at predefined time points, if the response evaluation resulted in a CR/iCR, PR/iPR or SD/iSD. The DCR was evaluated at first TA during treatment (at approximately 4–6 weeks), and on study days 90, 180 and 270. Exploratory endpoints assessed the PK and immunogenicity effects of MP0317.
Safety parameters were reviewed by the dose-escalation review committee before each dose-escalation. The DLT evaluation period was 28 days. Tumor response was monitored using computed tomography scans every 6–8 weeks with evaluation per RECIST v.1.1 and iRECIST.
Bioanalytical assays
MP0317 concentrations in serum were assessed using an electrochemiluminescence immunoassay developed and validated at Molecular Partners, which uses as capture reagent biotinylated human recombinant CD40 (Acrobiosystems) and as detection reagent a Sulfotag monoclonal antibody anti-MP0317 (CePower). The limit of quantification of the PK assay is 5 ng ml−1.
Detection of ADAs against MP0317 was performed with a validated method developed at Molecular Partners (electrochemiluminescence-based assay), using as a positive control the humanized anti-DARPin monoclonal antibody (Evitria).
PK data analysis
The following PK parameters were calculated from the serum MP0317 PK raw data: Cmax, time to Cmax (tmax), minimum serum concentration (Cmin), AUC, total clearance, volume of distribution at steady state (Vss) and half-life (t1/2).
Specifically, for the Q3W dosing cohorts (cohorts 1–6 with intravenous administration at 0.03, 0.10, 0.30, 1.0, 3.0 and 10 mg kg−1) both cycles 1 and 3 PK data were used to perform noncompartmental analysis, while for the Q1W dosing cohorts (cohorts 4b–6b with intravenous administration at 0.5, 1.5 and 5 mg kg−1) cycle 1 day 1 and cycle 1 day 15 were used instead.
PK parameters were calculated using standard noncompartmental PK analysis using the software Phoenix WinNonlin (v.8.4 or higher). ADA integrated summary was also performed using Phoenix.
For the PK analysis, the PK analysis set was used.
For PK parameter determination using noncompartmental analysis, the following rules were used for the PK data below the limit of quantification (BLQ) of the PK assay:
-
Pre-dose BLQ values (before the first study dose in cycle 1 day 1) were set to ‘0’.
-
Pre-dose BLQ values in subsequent visits after cycle 1 day 1 were set to the lower limit of quantification (0.005 μg ml−1) (LLOQ)/2.
-
For all visits, the first post-dose BLQ value was set to LLOQ/2, whereas subsequent BLQ values were treated as missing.
-
Embedded BLQ values (between two measurable concentrations) were treated as missing.
Immunogenicity analysis
Results of ADAs against MP0317 were integrated based on results of the ADA assay to determine the immunogenicity potential of MP0317. The immunogenicity analysis set was used to integrate the ADA summary. To integrate the immunogenicity results, the incidence rate of ADA was derived. The number of ADA+ patients (including treatment-induced and treatment-boosted as subcategories) and ADA− patients (including ADA− and treatment-unaffected as subcategories) throughout the study was reported for each cohort, for each dosing frequency (Q1W or Q3W) and overall according to the terminology by Shankar et al.57. The incidence rate of ADAs was reported as the number of patients in each category divided by the number of patients in the cohort.
The onset of ADA appearance was defined as the time point where the first ADA+ sample was observed. The onset of the ADA response was summarized based on basic statistics (median, range) for each cohort, according to dosing frequency and overall. Finally, the association of ADA and PK was evaluated to determine whether ADAs were clearing in nature.
PD (biomarker analyses)
Evaluable paired (n = 26) pre-treatment and on-treatment tumor biopsies taken at cycle 2 day 8 (that is, 28 days after the first dose of MP0317) were analyzed with mIF and bulk RNA-seq at a central laboratory. Peripheral serum and fresh blood collected as per protocol schedule of the assessments were analyzed using enzyme-linked immunosorbent assay and Meso Scale Discovery immunoassay and flow cytometry, respectively, at a central laboratory.
mIF analyses
A customized method for detecting eight biomarkers (FAP, CD40, a-DARPin, CD3, CD68, CD11c, CD163 and Pan cytokeratin) via mIF on formalin-fixed paraffin-embedded tumor tissue samples was qualified by Precision for Medicine. For each patient sample, hematoxylin and eosin stain was performed on one tissue section slide, then digitalized using the PhenoImager HT system (Akoya, formerly Vectra Polaris); tissue quality was evaluated and annotated by a pathologist. Tumor biopsy annotations included tumor, non-tumor and eventual areas of exclusions (such as necrosis, hemorrhage). Slides were loaded onto the Leica BOND Rx automatic staining instrument and stained with a 9-color panel with the primary antibodies for each biomarker; 4’,6-diamidino-2-phenylindole staining was used to determine the number of nuclei and morphology. Once stained and cover-slipped, slides were scanned using the PhenoImager HT system, unmixed using the inForm software and analyzed using the HALO image analysis software. The total percentage of nucleated cells positive for a specific biomarker out of the total nucleated cells, and cell density (count per μm2), was scored in two regions per sample. The antibodies used for mIF are provided in Supplementary Tables.
RNA-seq analysis
RNA-seq of biopsies was performed using an Illumina Novaseq 6000 by Neogenomics. Sequencing results were converted using bcl2fastq then aligned using STAR58; normalized transcripts per million were computed using TPMCalculator59. For RNA-seq and alignment quality control, the following measures were evaluated: gene origin of reads; per sequence quality score; per base sequence content; per sequence GC content; sequence length distribution; and sequence duplication levels. Gene set enrichment scores were then computed using the GSVA R package. The gene signatures45,60,61 used are provided in Supplementary Tables. Analysis was done on prespecified groups as for the mIF data. Statistical analysis of changes in GSVA scores was performed using a paired Wilcoxon signed-rank test, using the ggpubr package.
Flow cytometry
Whole-blood samples in 4 ml sodium heparin tubes were sent at ambient temperature for sample preparation and flow cytometry analysis according to validated assay protocols for research use. A multi-color validated custom flow cytometry panel, designed to identify and enumerate the T, B and NK cell subsets was used for monitoring blood cell numbers (Q2 Solutions). Samples were stained with primary antibodies for CD3, CD4, CD8, CD14, CD16, CD19, CD45 and CD56, and analyzed on BD FACS Canto II flow cytometers (BD Biosciences). Lymphocytes were gated on CD45+ side scatter (SSC), excluding debris and monocytes. T cells (CD3+), B cells (CD19+) and NK cells (CD3−CD16+CD56+) were identified within the lymphocyte gate, with CD4/CD8 defining T cell subsets. A multi-color flow cytometry panel was designed to identify and enumerate the immune cell subsets of interest (that is B, T and DC cells) described below. Samples were acquired using the Cytek Aurora (Cytek Biosciences). The combination of fixable viability stain and SSC-A was used to exclude dead cells from the analysis and CD45 expression to determine the CD45+ leukocyte population. Expression of CD19, HLA-DR and CD14 was used to define monocytes and B cells, with CD56, CD16 and CD3 used to define NK, NKT and T cells, respectively. CD8 and CD4 were then used to further define cytotoxic and helper T cells, respectively. DC subsets were defined by CD123 and CD11c expression and further classified by the expression of CD1c and CD141. CD86, CD69, CD54, CD40, CD25 and HLA-DR markers were assessed in the previously defined subsets. Data analysis was performed with the BD FACSDiva or SpectroFlo software and ggplot2 and ggpubr packages in R v.4.5.
The flow cytometry panels and antibodies used for immunophenotyping are provided in Supplementary Tables.
Electrochemiluminescence assays
Serum aliquots of clinical samples (up to 0.5 ml per vial) were stored at −80 °C till the analyses below were performed by Precision for Medicine. The concentration (pg ml−1) of IFNγ, interleukin-10 (IL-10), IL-12p70, IL-13, IL-1β, IL-2, IL-4, IL-6, IL-8, TNF, IP-10 (CXCL10), MIG (CXCL9) in serum was measured using a validated electrochemiluminescence (ECL) method (MSD). The following ready-to-use kits were used: V-PLEX Plus Proinflammatory Panel 1 (human) Kit (cat. no. K150496-2), V-PLEX Plus Human IP10 Kit (cat. no. K151NVG), R-PLEX Human MIG Assay, SECTOR (cat. no. K1510IR) with Antibody Set (cat. no. B210I-3). The V-PLEX Plus kits are developed and validated by the manufacturer, which provides lot no. specifications, including LLOQ and ULOQ reference values. Analyses were performed according to the manufacturer’s instructions. The R-PLEX Human MIG Assay is an early developed assay within the MSD platform and was further qualified by Precision for Medicine.
sFAP and sCD40 concentrations were determined in human serum using ECL-based sandwich immunoassays, qualified at Molecular Partners. To analyze sFAP, an MSD GOLD 96-well Streptavidin SECTOR Plate (cat no. L15SA, Meso Scale Discovery) was coated with biotinylated human FAP antibody (cat. no. DY3715, R&D systems). The reference material used for calibration standards and the quality control preparation was recombinant human FAP (cat. no. 3715-SE, R&D Systems). SulfoTag-labeled D8 antibody (cat. no. MABS1001, Vitatex) was used for detection. To analyze sCD40, an MSD GOLD 96-well Small Spot Streptavidin SECTOR Plate (cat. no. L45SA, Meso Scale Discovery) was coated with biotinylated human CD40 antibody (cat. no. C217B-3, Meso Scale Discovery). The reference material used for the calibration standards and quality control preparation was recombinant human CD40 (cat. no. C017B-2, Meso Scale Discovery). SulfoTag-labeled human CD40 antibody (cat. no. D217B-3, Meso Scale Discovery) was used for detection.
Statistics and reproducibility
Nine dose levels were tested with at least two to nine patients per dose level. The following analysis sets were defined in the statistical analysis plan:
-
The safety analysis set (SAS) included all patients who received at least one administration of MP0317 and had at least one post-dose safety assessment. The SAS was the primary population for all demography, safety, immunogenicity, efficacy and PD related endpoints, except for determination of the dose–DLT relationship.
-
The dose-determining set (DDS) included all patients in the SAS who met the DLT evaluability criteria. The DDS was used to estimate the dose–DLT relationship in the dose-escalation part of the study.
-
The PK analysis set consisted of all patients who received at least one dose of MP0317 and had at least one post-dose PK measurement.
-
The immunogenicity analysis set consisted of all patients in the SAS who had at least one post-baseline blood sample collected to assess immunogenicity.
For the dose-escalation part, a two-parameter adaptive BLRM was used to determine the RDE or MTD. The BLRM was guided by the escalation with overdose control principle which mandated that any dose of MP0317 that had more than a 25% chance of being in the excessive toxicity category was not considered for the next cohort.
AEs were coded using the MedDRA v.24.1 and updates. Safety laboratory assessments were performed in a local laboratory and analyzed according to patient and visit. Vital signs and pulse oximetry, electrocardiogram, physical examination and ECOG PS were analyzed according to treatment group and visit.
Efficacy analyses were done according to investigator‑assessed response criteria: ORR was summarized with two-sided 90% exact Clopper–Pearson CIs for binomial proportions. In addition, waterfall plots were created displaying the maximum percentage change in sum of the longest diameter of the target lesions compared to baseline and the best overall response according to RECIST v.1.1/iRECIST. The DCR was summarized with two-sided 90% exact Clopper–Pearson CIs for binomial proportions according to treatment group.
For all response assessments, swimmer plots were created displaying the RECIST v.1.1/iRECIST assessments per patient over time.
Patient demographics and other screening data were listed and summarized using descriptive statistics. Exposure to study treatment was summarized with descriptive statistics for the total number of infusions received.
Data distribution was assumed to be normal but this was not formally tested.
Reporting summary
Further information on research design is available in the Nature Portfolio Reporting Summary linked to this article.