
Patient enrollment, demographics, and clinical characteristics
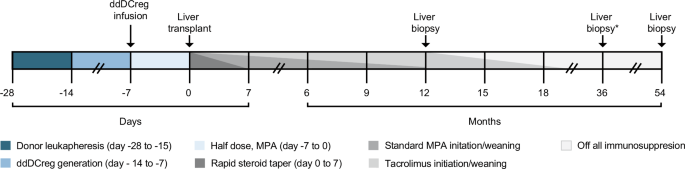
A graphical representation of the study schematic and anticipated drug weaning schedule is available in Fig. 1. In total, sixteen donor-recipient pairs were enrolled (Fig. 2a). To minimize immunologic confounders38 and in line with our pre-specified protocol, 1 patient, prior to any intervention, was withdrawn from the study following a positive crossmatch after enrollment. Elutriated monocyte fractions were obtained, via leukapheresis, from the remaining 15 prospective donors. Good manufacturing practice (GMP)-grade ddDCregs were generated, as previously described39, and infused into 15 recipients 7-days prior to transplantation. After transplantation, 2 additional participants were withdrawn from the study for health reasons deemed unrelated to the study, as indicated in Fig. 2a. Altogether, 13 ddDCreg-infused participants were included in the final analysis (Fig. 2a–c, Table 1).

Following eligibility assessment and study enrollment, living donor liver transplant donors underwent 1 (n = 12 donors) or 2 (n = 1 donor) rounds of leukapheresis to acquire sufficient monocytes. Donor-derived regulatory dendritic cells (ddDCregs) were generated from the elutriated monocytes and infused into the transplant recipient 7-days prior to transplantation with daily mycophenolate (500-mg, twice daily) until transplant. Following transplantation, recipients received a rapid steroid taper over the first 7-days in addition to the standard-of-care (SOC) mycophenolic acid (MPA) and tacrolimus immunosuppression. A 12-month protocol biopsy was used to determine patient eligibility for complete MPA withdrawal and staged tacrolimus withdrawal. Tacrolimus withdrawal and weaning was expected to take less than 12 months and not to exceed 55 weeks from the eligibility evaluation from the 12-month protocol biopsy. A final end-of-study (EOS) liver biopsy was performed for all patients off IS and/or for patients who elected to undergo an additional EOS biopsy. Additional liver biopsies, as indicated by the *, were conducted for all patients all IS for a duration of one-year.

a Modified Consolidated Standards of Reporting Trials (CONSORT) diagram of the Phase I/IIa, single-center, prospective, open-label, non-controlled, non-randomized, interventional, 16 patient cohort study in which low-risk, living donor liver transplant (LDLT) recipients received a single infusion of ddDCreg 1 week before transplantation. After enrollment and eligibility assessment, 1 patient was excluded secondary to a positive crossmatch. Following infusion and transplantation, two additional patients were excluded. In total, 13 patients underwent 12-month (M) protocol biopsies. Eight patients were eligible for staged immunosuppression (IS) withdrawal: of these, 4 were weaned off all IS, 3 of the 4 achieved operational tolerance and remained off all IS drugs until the end-of-study (EOS). The other patients with eligible, permissive protocol biopsies failed weaning (n = 4) or resumed IS following complete withdrawal (n = 1). *, one patient who failed weaning died 48.2 months post-transplant secondary to a geriatric fall and was included in the longitudinal analysis. b Modified swimmer plot demonstrating the clinical course and timeline for each individual patient included in the final study analysis. c Modified change heatmap depicting the initial evaluation and histologic changes, according to the Banff criteria, over time in the 1-year off IS and EOS biopsies compared to each patient’s initial baseline eligibility biopsy (12 M protocol biopsy). Each row represents a single patient, and operationally tolerant patients are denoted by a *. To calculate change over time, absolute scores at baseline were subtracted from scores at follow-up for the following parameters: portal inflammation, interface inflammation, perivenular inflammation, perivenular fibrosis, and liver allograft fibrosis score (LAFSc). All score scales range from 0 to 3 except the LAFSc scale, which ranges from 0 to 9. Purple indicates an increase in score and green indicates a decrease in score; increasing intensity of either purple or green indicates a larger magnitude of change. Gray indicates no biopsy; white indicates no change.
The LDLT cohort’s mean age and body mass index were 62 (interquartile range (IQR): 58–68) years and 30.0 (IQR: 25.8–33.9), respectively. The median Model for End-Stage Liver Disease score was 10 (IQR: 8–16). Most patients underwent transplantation for a primary diagnosis of alcohol-associated liver disease, followed by metabolic dysfunction-associated steatohepatitis and hepatocellular carcinoma (Table 1). Additional demographic, clinical, and donor information are in Table 1, S1–2. The median number of HLA-mismatches per patient was 7, corresponding to a median total eplet-load of 50 (IQR: 21-60) (Table 1, S3–4). All tissue typing based-results are available in Tables S3, 4. Pre-transplant, pre-infusion, donor-specific antibody (DSA) was noted in 2 patients, although all 13 patients included in the final study were crossmatch-negative (Table 1, S5). Other patient-specific factors, such as recipient characteristics or operation-related details, appeared similar across the cohort (Table 1, S6).
Feasibility and safety
Donor leukapheresis was well-tolerated. Sufficient elutriated monocytes were obtained following one-round of leukapheresis from all but two donors, who underwent a second-round. No complete cell acquisition or manufacturing failures occurred; product release criteria are in Table 2. The mean dose and total number of ddDCregs infused were 5.2 × 10⁶ DCregs per kg and 3.98 × 10⁸ DCregs, respectively. A target dose range of 2.5–10 × 106 ddDCregs per kg was achieved in 12 patients. A T-cell co-inhibitory (PD-L1) to co-stimulatory molecule (CD86) expression ratio of >1 was confirmed for all but one of the ddDCreg products. The mean ddDCreg anti- to pro-inflammatory cytokine (IL-10:IL-12) secretion ratio was 32.4. In patients who received an insufficient target dose (#13) or who received a product with a lower PD-L1:CD86 target ratio (#7), the IL-10:IL-12 ratio was 27 and 40, respectively, consistent with a tolerogenic DC phenotype. All infusions were monitored and well-tolerated, with no infusion reactions or adverse events (AEs) (Fig. 3). Pre- and post-infusion monitoring indicated mild presumptive hematopoietic cell sequestration and modest reductions in several laboratory tests (Fig. 3). As previously reported, intact infused ddDCreg were evident (mean 1.5% DC chimerism) in 8 of 9 recipients that could be analyzed 1-hour post-infusion (day −7). However, in these 8 patients, donor cells were no longer evident at later time-points (day −3 to the day of surgery); continued analysis performed 1-month post-transplant revealed intact donor cells (most likely graft-derived) in only 1 of the 9 patients.

a Spaghetti plots demonstrating temperature (top), blood pressure (middle-top, middle), respiratory rate (middle-bottom), and oxygen saturation (bottom) during and post-ddDCreg infusion (n = up to 13 per available samples per timepoint). Blue line indicates the cohort median with the interquartile range per timepoint. Arrow indicates the end of ddDCreg infusion and start of post-infusion monitoring. b-g Paired pre- and post-ddDCreg-infusion laboratory results for (b) creatinine, (c) albumin, (d) alkaline phosphatase (ALP), (e) alanine aminotransferase (ALT, left), aspartate aminotransaminases (AST, middle), and gamma-glutamyl transferases (GGT, right), (f) blood components such as hemoglobin (left), platelets (middle), and white blood cell count (right), as well as (g) prothrombin time (PT) and partial thromboplastin time (PTT). All pre- and post-ddDCreg infusion values (b–g) were compared utilizing a Wilcoxon paired-signed rank two tailed test (n = 13). Paired data are presented as mean values ± standard error of the mean. Statistically significant differences are indicated per plot *P ≤ 0.05 (albumin: P = 0.0156; PT: P = 0.151), **P ≤ 0.01 (ALT: P = 0.0012; GGT: P = 0.0015) and *** P ≤ 0.001 (ALP: P = 0.0002; AST: P = 0.0005; Hemoglobin: P = 0.0002; Platelets: P = 0.0002; WBCs: P = 0.0002).
The mean ( ± standard deviation) total hospital stay following transplantation was 14.0 ± 13 days (Table S6). One patient underwent reoperation following transplantation, whereas 5 patients were readmitted following discharge for non-ddDCreg-related issues (Table S6). At 12 months, no significant differences in biopsy-proven acute cellular rejection (BPAR), reoperation, readmission rates, vascular, biliary, or infectious complications were noted compared to a propensity-matched standard-of-care (SOC) LDLT reference cohort37. Infectious complications, until EOS, occurred in only 5 patients (Table S7). More importantly, only one per-protocol grade-4 AE occurred (Table S8): one patient (#8) died 48.2 months post-transplant secondary to a traumatic head injury.
DSA was routinely monitored throughout the study (Fig. 4, Table S5). Within the first-year post-transplant, 5 patients developed DSA. However, at 12-months, only 1 patient (#12) – who had pre-transplant DSA – exhibited persistent memory DSA. At 18-months, coinciding with ISW, 4 patients developed de-novo DSA. At EOS, 5 patients had circulating DSA. Of these 5 patients with EOS DSA, 2 were operationally tolerant (#2,12), 1 (#6) resumed SOC IS after 1-year off all IS, and 1 was ineligible for ISW (#13) (Figs. 2b, 4a, Table S5). The remaining patient, with EOS DSA, failed staged ISW (#1). Of note, only 3 patients (#1, 2, 12) at EOS had a strong immunodominant antibody, defined as a mean fluorescent intensity >5000 (Fig. 4a, Table S5). Moreover, C4d staining was positive in only 2/8 patients with available EOS biopsies (#1, 12) (Tables S9–13).

a Development of DSA across the study duration by patient count (top-left) and by immunodominant DSA subtype per patient (class I, left-middle; class II, left-bottom). Dashed line marks threshold for a strong DSA level, defined as a mean fluorescent intensity (MFI) of 5000. b-c Spaghetti plot depicting the immunosuppression taper by (b) tacrolimus trough levels and (c) dose per day of mycophenolate (Mofetil/CellCept) across all patients over time; patient 1012 received Mycophenolate Sodium/Mycophenolic Acid (Myfortic). d-f Spaghetti plots of (d) alanine aminotransferase (ALT), (e) aspartate aminotransaminases (AST), (f) gamma-glutamyl transferase (GGT) throughout the study (n = up to 13 per available samples per timepoint). Dashed line indicates the upper reference value for (d) ALT (72 U L−1), (e) AST (57 U L−1), and (f) GGT (78 U L−1). All, blue line indicates the cohort mean with the 95% confidence interval per timepoint; dashed green line indicates the mean value with standard deviation for the subset of operational tolerance patients (n = 3). Arrows above each x-axis, as indicated in (a), mark the days of ddDCreg infusion and subsequent liver transplantation.
Given the variable pathogenicity of immunoglobulin G (IgG) subtypes and the greater occurrence of class II DSA in our cohort, IgG subtyping of DSA from 4 patients was performed (#2,6,8,12). Two patients displayed only elevated levels of IgG1 DSA (#2,6). The remainder exhibited the temporal transition of predominantly IgG1 to increasing IgG4 concentrations suggestive of chronic antigen exposure (#8,12) (Table S14).
Additional clinical monitoring, safety, and preliminary efficacy exploration
As previously reported37, longitudinal monitoring of allograft function/outcomes including BPAR up to 12-months post-transplant revealed no significant differences between the ddDCreg-recipients and a propensity-matched SOC LDLT reference cohort. In fact, only one patient who received a sub-target dose of ddDCregs, experienced BPAR (#13) at 3.5 months post-transplant (#13). Following treatment (Table S13), she remained stable, without any additional issues, on her baseline IS until EOS.
At 12-months post-transplant, protocol biopsy analysis and eligibility assessment completed by the study pathologist, indicated that 8 ddDCreg recipients were eligible for ISW, according to published criteria40 (Fig. 2a–b, Tables S11). The remaining five patients with either a nonpermissive biopsy or BPAR, all remained on their baseline IS and were stable throughout the remainder of the study (Fig. 2b, Tables S11, S13). For patients with a permissive protocol biopsy, complete mycophenolic acid (MPA) cessation occurred at 12.1 ± 1.4 months post-transplant (Fig. 4b–c). During staged tacrolimus ISW, a transient elevation in liver-related laboratory tests occurred at 18 months post-transplant (Figs. 4d–f, 5a–b). 4 of the 8 eligible patients (#1, 8, 11, 16) failed staged ISW (Fig. 2b, Table S13). Each patient who failed staged ISW, returned to their baseline IS, were monitored biochemically, and remained stable until EOS (Table S13).

a-e Spaghetti plots of (a) alkaline phosphatase (ALP), (b) albumin, (c) random blood glucose, (d) estimated glomerular filtration rate (eGFR), and (e) Systolic blood pressure throughout the study (n = up to 13 per available samples per timepoint). Dashed line indicates the upper reference value for (a) ALP (126 U L−1), the standard reference value for (b) albumin (4 g dL−1), (c) a glucose value of 126 mg dL−1, (d) an eGFR value of 60 mL/min/1.73 m2, and (e) a systolic blood pressure value of 130 mmHg. All, blue line indicates the cohort mean with the 95% confidence interval per timepoint; dashed green line indicates the mean value with standard deviation for the subset of operational tolerance patients (n = 3). Arrows above each x-axis, as indicated in (a), mark the days of ddDCreg infusion and subsequent liver transplantation.
The other 4 patients eligible for ISW achieved complete tacrolimus withdrawal 11.4 ± 2.2 months after their 12-month protocol biopsy (#2, 6, 9, 12) (Table S11, Figs. 2b, 4b, Supplementary Fig. 1). Three of these four patients had no overt evidence of T-cell mediated rejection one-year off all IS (operationally tolerant) and remained off all IS until the EOS (#2, 9, 12) (Table S11). The fourth patient (#6) – off all IS – experienced suspected immune re-activation and rejection two weeks after COVID-19 vaccination; they returned to their baseline IS without any further issues (Fig. 2b, Table S13). Compared to the historical benchmark of successful early ISW34 without an additional intervention, the proportion of patients achieving OT, however, was not statistically significant (P = 0.188, 95% confidence interval: 0.09–0.76). All biopsy-related details (study and local pathologist evaluations), timing, and eligibility assessments for ISW/cessation/return to IS are available in Tables S9–13 with changes depicted overtime in Fig. 2c.
At EOS, the cohort’s mean tacrolimus trough level was 2.8 ± 1.9 ng mL−1, down from an initiation trough of 5.8 ± 3.3 ng mL−1 (Fig. 4b). However, the average tacrolimus dose, for those on IS at EOS, rose slightly above the cohort’s baseline of 2.4 ± 1.6 to 2.7 ± 2.3 mg per day (Supplementary Fig 1). The urine protein excretion ratio (Supplementary Fig. 2a) also remained below 0.2 in 8/9 subjects at 36–48 months and random glucose levels at EOS decreased from baseline by a paired mean difference of 14.7 ± 45.2 mg dL−1 (Fig. 5c). Without accounting for EOS IS differences, mean estimated glomerular filtration rate (eGFR) increased from baseline to EOS, across the cohort, by a paired difference of 4.4 ± 27.8 mL per min per 1.73 m2 (Fig. 5d). However, paired mean increases in systolic blood pressure (10.5 ± 16.3 mmHg) and triglycerides (98.9 ± 141.3 mg dL−1) were noted at EOS (Fig. 5e, Supplementary Fig. 2b). Other factors, such as blood urea nitrogen (BUN) levels, creatinine, cholesterol, and diastolic blood pressure remained within expected ranges (Supplementary Fig. 2c–f). No new cases of hypertension, despite a rising cohort average, post-transplantation diabetes, hyperlipidemia, or hypercholesterolemia requiring medication or intervention were observed beyond the pre-existing instances identified at study inception. Mean hemoglobin, platelet, and white blood cell counts rose above baseline and remained within expected levels throughout the study (Supplementary Fig. 3a–c). Quality-of-life (QOL) evaluation demonstrated reduced metrics from 1-year post-transplant to EOS (Table S15).
Monitoring of inflammatory mediators, T-cell populations and anti-donor reactivity
Plasma mediators were measured sequentially using 32-plex meso-scale technology. Heatmaps depicting analyte clusters by timepoint (Fig. 6a) showed modulation of key pro-inflammatory cytokines (IL-12p70, IL-12/IL-23p40, TNF-b, GM-CSF, IL-17A, IFN-γ) and intercellular adhesion molecules (VCAM-1; ICAM-1) from pre-transplantation, pre-infusion to EOS (Fig. 6a). Comprehensive longitudinal immunophenotyping of circulating CD3+ T-cells (Fig. 6b, Supplementary Figs. 4–6) revealed decreasing percentages of CD4+ compared with CD8+ T-cells (Fig. 6b, Supplementary Fig. 4a–c). Within the CD8+ T-cell compartment, a decrease occurred in PD-1+ T-cells, but not in cells expressing EOMES or TIM-3, additional markers of exhaustion (Fig. 6b, Supplementary Fig. 5a–b). No substantial changes were observed in percentages or absolute numbers of Tregs (CD3+CD4+CD25hiCD127−FOXP3+) (Fig. 6b, Supplementary Fig. 6a–b), or in the percentages of memory (CD45RO+) and/or follicular T-cells (CD4+CD45RO+CXCR5+) (Supplementary Fig. 6c–d). The gating strategy and representative plots are available in Supplementary Fig. 7a.

a Heatmaps depicting 32-plex analytes at indicated timepoints. Each row depicts an analyte whereas each column depicts an individual patient (*, denotes operationally tolerant patients, n = 3). Heatmaps are hierarchically clustered (Euclidian distance with complete linkage) by row based on scaled gene expression and by patient at each timepoint. Gray marks plasma analytes without a value. b Longitudinal immune cell dynamics on selected cell types (CD4+ T-cells, left-top; CD8+ T-cells, right-top; Treg: CD25hi CD127− FoxP3+ out of CD4+ T-cells, left-bottom; CD8+ PD-1+, right-bottom) for all patients throughout the study. All, blue line indicates the cohort mean with the 95% confidence interval per timepoint; dashed green line indicates the mean value with standard deviation for the subset of operational tolerance patients (n = 3). Arrows above each x-axis, as indicated in the top left graph, mark the days of ddDCreg infusion and subsequent liver transplantation. c Incidences of IFN-γ + proliferating CD4+ T-cells (upper-panel) and CD8+ T-cells (lower-panel) cells in mixed-leukocyte reactions against donor or third-party (3rdP) cells at different timepoints: pre-infusion (Pre, n = 3), 12-months (12 M, n = 9), and 54-months (54 M, n = 11). In violin plots, each dot represents 1 patient; medians are indicated and interquartile ranges denoted by dashed lines. Statistical analyses among groups were performed using a two tailed Mann–Whitney U test given the small sample sizes and normality testing with the Kolmogorov-Smirnov test. Statistically significant differences are indicated per plot *P ≤ 0.05 (IFN-γ + proliferating CD4+ T-cells – 12 M: P = 0.01, 54 M: P = 0.0128; IFN-γ + proliferating CD8+ T-cells – 12 M: P = 0.03), **P ≤ 0.01, and ***P ≤ 0.001 (IFN-γ + proliferating CD8+ T-cells – 12 M: P = 0.001). Effect estimates (Cohen D) are reported in parentheses for all statistically significant results.
To investigate alloimmune reactivity, mixed leukocyte reactions were set up between recipient T-cells and donor or third-party stimulators at three timepoints: pre-infusion, 12-months, and 54-months post-transplant (EOS). Significantly lower proliferation of donor-specific T-cells, including IFN-γ-expressing CD4+ and CD8+ T-cells compared to third-party alloreactive T-cells was observed 12- and 54-months post-transplant, in contrast to similar degrees of alloreactivity before ddDCreg infusion (Fig. 6c, Supplementary Figs. 7b-c, 8a-c). This aligns with our previously published observations at 12 months post-LT37, when ddDCreg-recipients, but not propensity-matched SOC LDLT patients, displayed lower proliferation of donor-specific, IFN-γ-expressing CD4+ and CD8+ T-cells compared with third-party alloreactive IFN-γ-expressing CD4+ and CD8+ T-cells.